List of countries by natural gas production
This is a list of countries by natural gas production based on statistics from the The World Factbook,[1] and OECD members natural gas production by International Energy Agency (down) [2]
.svg.png.webp)
Countries by natural gas proven reserves (2014), based on data from The World Factbook
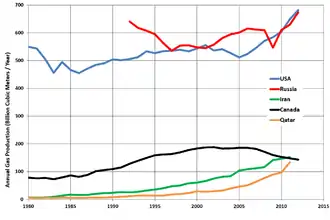
Trends in the five countries with largest production of natural gas (data from US Energy Information Administration
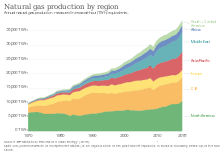
Natural gas production by region
Countries by Natural gas production
The data in the following table comes from The World Factbook.[3]
| Rank | Country | Continent | Annual NG production (million m3) | Date of information |
|---|---|---|---|---|
| 1 | North America | 766,200 | 2015 est. | |
| 2 | Europe | 598,600 | 2015 est. | |
| 3 | Asia | 184,800 | 2015 est. | |
| 4 | Asia | 164,000 | 2015 est. | |
| 5 | North America | 149,900 | 2015 est. | |
| 6 | Asia | 138,400 | 2016 est. | |
| — | — | 118,200 | 2016 est. | |
| 7 | Europe | 117,200 | 2015 est. | |
| 8 | Asia | 102,300 | 2015 est. | |
| 9 | Asia | 86,940 | 2015 est. | |
| 10 | Asia | 83,700 | 2015 est. | |
| 11 | Africa | 83,040 | 2015 est. | |
| 12 | Oceania | 67,200 | 2015 est. | |
| 13 | Asia | 63,430 | 2015 est. | |
| 14 | Asia | 60,180 | 2015 est. | |
| 15 | Asia | 55,700 | 2015 est. | |
| 16 | Europe | 47,460 | 2016 est. | |
| 17 | Africa | 45,150 | 2015 est. | |
| 18 | South America | 44,600 | 2017 est. | |
| 19 | Europe | 41,340 | 2015 est. | |
| 20 | Caribbean | 40,870 | 2015 est. | |
| 21 | North America | 40,370 | 2015 est. | |
| 22 | Asia | 39,820 | 2015 est. | |
| 23 | Asia | 39,300 | 2015 est. | |
| 24 | Asia | 29,930 | 2015 est. | |
| 25 | Asia | 29,370 | 2016 est. | |
| 26 | Asia | 26,210 | 2016 est. | |
| 27 | Asia | 26,100 | 2016 est. | |
| 28 | South America | 26,000 | 2015 est. | |
| 29 | Eurasia | 22,890 | 2017 est. | |
| 30 | Asia | 21,070 | 2016 est. | |
| 31 | South America | 20,510 | 2017 est. | |
| 32 | South America | 20,410 | 2015 est. | |
| 33 | Europe | 19,000 | 2015 est. | |
| 34 | Asia | 17,500 | 2015 est. | |
| 35 | Asia | 16,910 | 2015 est. | |
| 36 | South America | 12,620 | 2015 est. | |
| 37 | Asia | 12,000 | 2015 est. | |
| 38 | Africa | 11,600 | 2015 est. | |
| 39 | Europe | 11,170 | 2015 est. | |
| 40 | South America | 9,897 | 2015 est. | |
| 41 | Asia | 9,890 | 2017 est. | |
| 42 | Oceania | 9,800 | 2015 est. | |
| 43 | Europe | 8,730 | 2015 est. | |
| 44 | Asia | 8,500 | 2015 est. | |
| 45 | Asia | 7,700 | 2015 est. | |
| 46 | Africa | 6,200 | 2015 est. | |
| 47 | Europe | 6,132 | 2015 est. | |
| 48 | Europe | 5,785 | 2016 est. | |
| 49 | Africa | 5,695 | 2015 est. | |
| 50 | Oceania | 4,954 | 2015 est. | |
| 51 | Europe | 4,618 | 2015 est. | |
| 52 | Asia | 4,453 | 2015 est. | |
| 53 | Asia | 4,300 | 2015 est. | |
| 54 | Asia | 3,942 | 2017 est. | |
| 55 | Africa | 3,610 | 2015 est. | |
| 56 | Asia | 2,850 | 2015 est. | |
| 57 | Africa | 2,063 | 2015 est. | |
| 58 | Europe | 1,772 | 2015 est. | |
| 59 | Europe | 1,691 | 2016 est. | |
| 60 | Africa | 1,575 | 2015 est. | |
| 61 | Africa | 1,500 | 2015 est. | |
| 62 | Caribbean | 1,185 | 2016 est. | |
| 63 | Europe | 1,124 | 2016 est. | |
| 64 | Africa | 1,100 | 2015 est. | |
| 65 | Africa | 1,100 | 2015 est. | |
| 66 | South America | 1,008 | 2015 est. | |
| 67 | Asia | 1,002 | 2015 est. | |
| 68 | Africa | 773 | 2015 est. | |
| 69 | Africa | 680 | 2015 est. | |
| 70 | Europe | 586 | 2016 est. | |
| 71 | Africa | 554 | 2016 est. | |
| 72 | South America | 497 | 2015 est. | |
| 73 | Eurasia | 381 | 2015 est. | |
| 74 | Africa | 378 | 2015 est. | |
| 75 | Asia | 340 | 2015 est. | |
| 76 | Europe | 247 | 2015 est. | |
| 77 | Asia | 188 | 2015 est. | |
| 78 | Asia | 165 | 2016 est. | |
| 79 | Asia | 151 | 2015 est. | |
| 80 | Europe | 132 | 2015 est. | |
| 81 | Africa | 94 | 2015 est. | |
| 82 | Europe | 94 | 2015 est. | |
| 83 | Europe | 79 | 2016 est. | |
| 84 | Europe | 62 | 2015 est. | |
| 85 | Africa | 62 | 2015 est. | |
| 86 | Europe | 35 | 2015 est. | |
| 87 | Asia | 30 | 2015 est. | |
| 88 | Europe | 30 | 2015 est. | |
| 89 | Europe | 28 | 2015 est. | |
| 90 | Europe | 25 | 2015 est. | |
| 91 | Asia | 20 | 2015 est. | |
| 92 | Caribbean | 17 | 2016 est. | |
| 93 | Asia | 10 | 2015 est. | |
| 94 | Africa | 8 | 2011 est. | |
| 95 | Europe | 8 | 2015 est. | |
| 96 | Europe | 6 | 2015 est. | |
| 97 | Europe | 4 | 2015 est. | |
| 98 | Europe | 4 | 2017 est. |
OECD Mebmers natural gas production by International Energy Agency [4]
As of 2019 :
| Rank | Country | Continent | Annual NG production (million m3) |
|---|---|---|---|
| 1 | North America | 955,000 | |
| 2 | North America | 177,000 | |
| 3 | Oceania | 142,000 | |
| 4 | Europe | 119,000 | |
| 5 | Europe | 40,000 | |
| 6 | Europe | 34,000 | |
| 7 | Rest of OECD | - | 71,000 |
See also
References
- IEA. Key World Energy Statistics 2014. Natural Gas. Access date - 01/17/2021
- CIA. The World Factbook. Natural gas - production.
- https://www.iea.org/reports/natural-gas-information-overview Access date - 01/17/2021
This article is issued from Wikipedia. The text is licensed under Creative Commons - Attribution - Sharealike. Additional terms may apply for the media files.