New Salem, North Dakota
New Salem is a city in Morton County, North Dakota, United States. It is part of the "Bismarck, ND Metropolitan Statistical Area" or "Bismarck-Mandan". The population was 946 at the 2010 census.[5] New Salem was founded in 1883.
New Salem, North Dakota | |
|---|---|
 New Salem, North Dakota | |
 Location of New Salem, North Dakota | |
| Coordinates: 46°50′35″N 101°24′43″W | |
| Country | United States |
| State | North Dakota |
| County | Morton |
| Area | |
| • Total | 1.40 sq mi (3.62 km2) |
| • Land | 1.39 sq mi (3.59 km2) |
| • Water | 0.01 sq mi (0.03 km2) |
| Elevation | 2,185 ft (665.98 m) |
| Population | |
| • Total | 946 |
| • Estimate (2019)[3] | 989 |
| • Density | 714.08/sq mi (275.77/km2) |
| Time zone | UTC-6 (Central (CST)) |
| • Summer (DST) | UTC-5 (CDT) |
| ZIP code | 58563 |
| Area code(s) | 701 |
| FIPS code | 38-56700 |
| GNIS feature ID | 1030399[4] |
| Website | NewSalem-ND.com |
Geography
New Salem is located at 46°50′35″N 101°24′43″W (46.842993, -101.412058).[6]
According to the United States Census Bureau, the city has a total area of 1.47 square miles (3.81 km2), of which, 1.46 square miles (3.78 km2) is land and 0.01 square miles (0.03 km2) is water.[7]
New Salem is one mile south of Interstate 94.
Demographics
| Historical population | |||
|---|---|---|---|
| Census | Pop. | %± | |
| 1900 | 229 | — | |
| 1910 | 621 | 171.2% | |
| 1920 | 711 | 14.5% | |
| 1930 | 804 | 13.1% | |
| 1940 | 875 | 8.8% | |
| 1950 | 942 | 7.7% | |
| 1960 | 986 | 4.7% | |
| 1970 | 943 | −4.4% | |
| 1980 | 1,081 | 14.6% | |
| 1990 | 909 | −15.9% | |
| 2000 | 938 | 3.2% | |
| 2010 | 946 | 0.9% | |
| 2019 (est.) | 989 | [3] | 4.5% |
| U.S. Decennial Census[8] 2018 Estimate[9] | |||
2010 census
As of the census[2] of 2010, there were 946 people, 404 households, and 241 families residing in the city. The population density was 647.9 inhabitants per square mile (250.2/km2). There were 449 housing units at an average density of 307.5 per square mile (118.7/km2). The racial makeup of the city was 96.4% White, 2.3% Native American, 0.1% Asian, 0.1% from other races, and 1.1% from two or more races. Hispanic or Latino of any race were 1.2% of the population.
There were 404 households, of which 25.0% had children under the age of 18 living with them, 50.0% were married couples living together, 5.9% had a female householder with no husband present, 3.7% had a male householder with no wife present, and 40.3% were non-families. 36.6% of all households were made up of individuals, and 20.1% had someone living alone who was 65 years of age or older. The average household size was 2.18 and the average family size was 2.83.
The median age in the city was 48.2 years. 20.9% of residents were under the age of 18; 5.2% were between the ages of 18 and 24; 19.9% were from 25 to 44; 24.2% were from 45 to 64; and 29.7% were 65 years of age or older. The gender makeup of the city was 47.5% male and 52.5% female.
2000 census
As of the census of 2000, there were 938 people, 411 households, and 246 families residing in the city. The population density was 649.0 people per square mile (249.8/km2). There were 448 housing units at an average density of 310.0 per square mile (119.3/km2). The racial makeup of the city was 97.23% White, 1.71% Native American, and 1.07% from two or more races.
There were 411 households, out of which 21.4% had children under the age of 18 living with them, 54.3% were married couples living together, 4.4% had a female householder with no husband present, and 40.1% were non-families. 38.7% of all households were made up of individuals, and 25.8% had someone living alone who was 65 years of age or older. The average household size was 2.14 and the average family size was 2.83.
In the city, the population was spread out, with 21.1% under the age of 18, 2.9% from 18 to 24, 21.0% from 25 to 44, 20.6% from 45 to 64, and 34.4% who were 65 years of age or older. The median age was 49 years. For every 100 females, there were 85.0 males. For every 100 females age 18 and over, there were 81.4 males.
The median income for a household in the city was $26,848, and the median income for a family was $36,761. Males had a median income of $27,446 versus $19,091 for females. The per capita income for the city was $16,514. About 9.4% of families and 9.2% of the population were below the poverty line, including 5.2% of those under age 18 and 20.9% of those age 65 or over.
History
New Salem began in April 1882 when John Christiansen hopped off a westbound freight train. The only sign of civilization he saw were the train tracks behind him and the belongings he brought. Soon after his arrival a Colonization Bureau out of Chicago sent settlers to the area and gave the colony its independence for $600. A church, land office, lumber yard, drugstore, and general store were soon built, and by the end of 1883, the town was ready for Great Plains living.
Sites of interest
- Salem Sue, large fiberglass sculpture of a cow
Climate
| Climate data for New Salem, ND 1893-2016 | |||||||||||||
|---|---|---|---|---|---|---|---|---|---|---|---|---|---|
| Month | Jan | Feb | Mar | Apr | May | Jun | Jul | Aug | Sep | Oct | Nov | Dec | Year |
| Record high °F (°C) | 62 (17) |
68 (20) |
85 (29) |
93 (34) |
105 (41) |
110 (43) |
119 (48) |
108 (42) |
106 (41) |
96 (36) |
82 (28) |
66 (19) |
119 (48) |
| Average high °F (°C) | 21.0 (−6.1) |
25.8 (−3.4) |
37.7 (3.2) |
55.0 (12.8) |
67.4 (19.7) |
76.3 (24.6) |
84.5 (29.2) |
83.5 (28.6) |
72.4 (22.4) |
58.5 (14.7) |
39.4 (4.1) |
26.1 (−3.3) |
54.0 (12.2) |
| Average low °F (°C) | −0.2 (−17.9) |
4.7 (−15.2) |
16.1 (−8.8) |
29.5 (−1.4) |
40.4 (4.7) |
50.4 (10.2) |
56.0 (13.3) |
53.5 (11.9) |
43.5 (6.4) |
32.2 (0.1) |
18.4 (−7.6) |
5.9 (−14.5) |
29.2 (−1.6) |
| Record low °F (°C) | −43 (−42) |
−41 (−41) |
−30 (−34) |
−14 (−26) |
10 (−12) |
22 (−6) |
32 (0) |
30 (−1) |
10 (−12) |
−10 (−23) |
−26 (−32) |
−40 (−40) |
−43 (−42) |
| Average precipitation inches (mm) | 0.46 (12) |
0.46 (12) |
0.80 (20) |
1.49 (38) |
2.36 (60) |
3.38 (86) |
2.34 (59) |
1.88 (48) |
1.42 (36) |
0.99 (25) |
0.55 (14) |
0.46 (12) |
16.59 (422) |
| Average snowfall inches (cm) | 6.6 (17) |
6.4 (16) |
7.6 (19) |
4.4 (11) |
0.9 (2.3) |
0.0 (0.0) |
0.0 (0.0) |
0.0 (0.0) |
0.2 (0.51) |
2.2 (5.6) |
5.7 (14) |
6.2 (16) |
40.2 (101.41) |
| Average precipitation days (≥ 0.01 in) | 6 | 5 | 6 | 7 | 9 | 10 | 8 | 7 | 6 | 5 | 5 | 6 | 80 |
| Average snowy days (≥ 0.1 in) | 6 | 6 | 5 | 2 | 0 | 0 | 0 | 0 | 0 | 1 | 4 | 6 | 30 |
| Source: WRCC https://wrcc.dri.edu/cgi-bin/cliMAIN.pl?nd6365, Snow days from Nowdata | |||||||||||||
References
- "2019 U.S. Gazetteer Files". United States Census Bureau. Retrieved July 27, 2020.
- "U.S. Census website". United States Census Bureau. Retrieved June 14, 2012.
- "Population and Housing Unit Estimates". United States Census Bureau. May 24, 2020. Retrieved May 27, 2020.
- "US Board on Geographic Names". United States Geological Survey. October 25, 2007. Retrieved January 31, 2008.
- "2010 Census Redistricting Data (Public Law 94-171) Summary File". American FactFinder. United States Census Bureau. Retrieved May 2, 2011.
- "US Gazetteer files: 2010, 2000, and 1990". United States Census Bureau. February 12, 2011. Retrieved April 23, 2011.
- "US Gazetteer files 2010". United States Census Bureau. Archived from the original on January 12, 2012. Retrieved June 14, 2012.
- United States Census Bureau. "Census of Population and Housing". Retrieved July 19, 2013.
- "Population Estimates". United States Census Bureau. Retrieved June 11, 2019.
External links
Municipalities and communities of Morton County, North Dakota, United States | ||
|---|---|---|
| Cities | 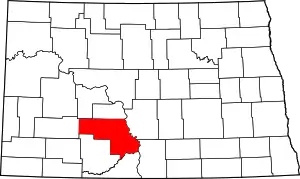 Map of North Dakota highlighting Morton County | |
| Township | ||
| CDP | ||
| Unincorporated communities | ||
| ||
| Counties | 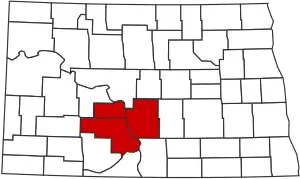 | |
|---|---|---|
| Core cities | ||
| Surrounding areas |
| |
| Authority control |
|---|