Morton County, North Dakota
Morton County is a county in the U.S. state of North Dakota. As of the 2010 United States Census, the population was 27,471,[1] making it the seventh-most populous county in North Dakota. Its county seat is Mandan.[2] Morton County is included in the Bismarck, ND, Metropolitan Statistical Area.
Morton County | |
|---|---|
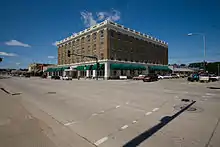
 Morton County Courthouse in Mandan | |
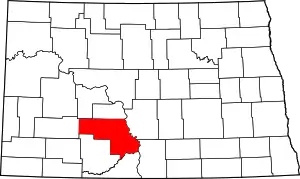 Location within the U.S. state of North Dakota | |
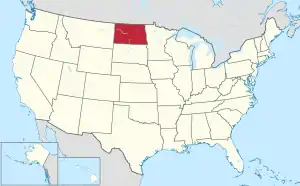 North Dakota's location within the U.S. | |
| Coordinates: 46°43′N 101°17′W | |
| Country | |
| State | |
| Founded | January 8, 1873 (created) March 27, 1896 (present configuration) |
| Seat | Mandan |
| Largest city | Mandan |
| Area | |
| • Total | 1,945 sq mi (5,040 km2) |
| • Land | 1,926 sq mi (4,990 km2) |
| • Water | 19 sq mi (50 km2) 1.0% |
| Population (2010) | |
| • Total | 27,471 |
| • Estimate (2019) | 31,364 |
| • Density | 14/sq mi (5.5/km2) |
| Time zone | UTC−6 (Central) |
| • Summer (DST) | UTC−5 (CDT) |
| Congressional district | At-large |
| Website | www |
Early History
The county was created on January 8, 1873 by the Dakota Territory legislature, using territory that had not previously been included in any county. The county organization was not completed at that time, but the new county was not attached to any other county for administrative or judicial matters. Its organization was completed on November 5, 1878. It was named for Oliver Hazard Perry Throck Morton (1823-1877), governor of Indiana during the American Civil War and later a United States Senator. Portions of the county were partitioned off on February 10, 1879, causing the county organization to be not fully organized.[3] This lasted until February 28, 1881, when the organization was again completed. The county's boundaries were adjusted in 1881 and in 1887. In 1916, a portion of Morton County was partitioned off to create Grant County, setting Morton County's boundaries to their present configuration.
After the Northern Pacific Railroad announced the location for the western approach to its Missouri River bridge, a new settlement appeared in December 1878. Initially the US Post Office designated the riverside settlement "Morton" after the corresponding county. The Morton post office later moved to the city center 3 miles west.[4] The county was reorganized in 1881 after the detached land was returned to Morton County by the 1881 legislature. The town, eventually renamed Mandan, was named the county seat.[5][6][7][8]
Recent History
DAPL protests
The 1,172-mile long Dakota Access Pipeline (DAPL) route submitted in its final permit applications starting in September 2014 would include a 72-mile portion through Morton County.[9] The county became a focus of DAPL protests in April 2016. In August 2016 the Standing Rock Sioux Tribe (SRST) filed an injunction against United States Army Corps of Engineers (USACE) to attempt to halt construction. In his 58-page decision by United States District Judge James E. Boasberg shows that the tribe failed to participate in the process of the USACE and Energy Transfer Partners (ETP) to address the tribes complaints.[10] Furthermore, the tribe did not cite a fear of water contamination in the injunction. The injunction request was denied and also failed on appeal. Amnesty International wrote a letter to Sheriff Kyle Kirchmeier on September 28, 2016, requesting that he investigate the use of force by private contractors, remove blockades and discontinue the use of riot gear by Morton County sheriff's deputies when policing protests in order to facilitate the right to peaceful protests in accordance with international law and standards.[11] This letter was written in response to private security guards using guard dogs on advancing protesters on September 3, along with using pepper spray.[12] On November 20, North Dakota police officers fired rubber bullets, tear gas, CS canisters and water from fire hoses at rioting protesters in subfreezing temperatures.
Geography
The Missouri River flows south-southeastward along the east boundary line of Morton County, and Cannonball River flows east-northeastward along the eastern portion of the county's south boundary line. The county terrain consists of low rolling hills, etched by gullies and drainages; the more level areas are devoted to agriculture.[13] The terrain generally slopes to the east and south, but also slopes into the river valleys, with the high point near the midpoint of the north boundary line, at 2,375' (748m) ASL.[14] The county has a total area of 1,945 square miles (5,040 km2), of which 1,926 square miles (4,990 km2) is land and 19 square miles (49 km2) (1.0%) is water.[15]
Major highways
Adjacent counties
- Oliver County - north
- Burleigh County - northeast
- Emmons County - east
- Sioux County - southeast
- Grant County - south
- Stark County - west
- Mercer County - northwest
Protected areas[13]
- Lake Patricia National Wildlife Refuge
- Morton County State Game Management Area
- Storm Creek State Game Management Area
- Sweet Briar Dam State Game Management Area
Demographics
| Historical population | |||
|---|---|---|---|
| Census | Pop. | %± | |
| 1880 | 200 | — | |
| 1890 | 4,728 | 2,264.0% | |
| 1900 | 8,069 | 70.7% | |
| 1910 | 25,289 | 213.4% | |
| 1920 | 18,714 | −26.0% | |
| 1930 | 19,647 | 5.0% | |
| 1940 | 20,184 | 2.7% | |
| 1950 | 19,295 | −4.4% | |
| 1960 | 20,992 | 8.8% | |
| 1970 | 20,310 | −3.2% | |
| 1980 | 25,177 | 24.0% | |
| 1990 | 23,700 | −5.9% | |
| 2000 | 25,303 | 6.8% | |
| 2010 | 27,471 | 8.6% | |
| 2019 (est.) | 31,364 | [16] | 14.2% |
| US Decennial Census[17] 1790-1960[18] 1900-1990[19] 1990-2000[20] 2010-2019[1] | |||
2000 census
As of the 2000 United States Census, there were 25,303 people, 9,889 households, and 6,932 families in the county. The population density was 13 people per square mile (5/km2). There were 10,587 housing units at an average density of 6 per square mile (2/km2). The racial makeup of the county was 95.82% White, 0.16% Black or African American, 2.39% Native American, 0.30% Asian, 0.01% Pacific Islander, 0.16% from other races, and 1.16% from two or more races. 0.65% of the population were Hispanic or Latino of any race. 64.5% were of German and 10.6% Norwegian ancestry.
There were 9,889 households, out of which 34.90% had children under the age of 18 living with them, 58.20% were married couples living together, 8.50% had a female householder with no husband present, and 29.90% were non-families. 25.70% of all households were made up of individuals, and 10.90% had someone living alone who was 65 years of age or older. The average household size was 2.51 and the average family size was 3.03.
The county population contained 27.00% under the age of 18, 7.80% from 18 to 24, 28.20% from 25 to 44, 22.40% from 45 to 64, and 14.60% who were 65 years of age or older. The median age was 37 years. For every 100 females there were 99.30 males. For every 100 females age 18 and over, there were 96.30 males.
The median income for a household in the county was $37,028, and the median income for a family was $44,592. Males had a median income of $30,698 versus $21,301 for females. The per capita income for the county was $17,202. About 6.80% of families and 9.60% of the population were below the poverty line, including 11.00% of those under age 18 and 14.30% of those age 65 or over.
2010 census
As of the 2010 census, there were 27,471 people, 11,289 households, and 7,523 families in the county.[21] The population density was 14.3 inhabitants per square mile (5.5/km2). There were 12,079 housing units at an average density of 6.3 per square mile (2.4/km2).[22] The racial makeup of the county was 93.6% white, 3.6% American Indian, 0.4% black or African American, 0.2% Asian, 0.1% Pacific islander, 0.4% from other races, and 1.6% from two or more races. Those of Hispanic or Latino origin made up 1.5% of the population.[21] In terms of ancestry,[23]
Of the 11,289 households, 30.9% had children under the age of 18 living with them, 53.1% were married couples living together, 9.3% had a female householder with no husband present, 33.4% were non-families, and 27.7% of all households were made up of individuals. The average household size was 2.38 and the average family size was 2.90. The median age was 39.3 years.[21]
The median income for a household in the county was $50,591 and the median income for a family was $62,713. Males had a median income of $42,044 versus $31,505 for females. The per capita income for the county was $25,303. About 5.4% of families and 8.2% of the population were below the poverty line, including 10.8% of those under age 18 and 9.6% of those age 65 or over.[24]
Communities
Census-designated place
Unincorporated communities[13]
- Bluegrass
- Breien
- Eagle Nest
- Fallon
- Fort Rice
- Huff
- Judson
- Rock Haven
- St. Anthony
- Sims
- Solen
- Sweet Briar
- Timmer
- Youngstown
Township
Politics
Morton County voters have been reliably Republican for decades. In only one national election since 1964 has the county selected the Democratic Party candidate.
| Year | Republican | Democratic | Third parties |
|---|---|---|---|
| 2016 | 71.6% 11,336 | 19.5% 3,080 | 8.9% 1,416 |
| 2012 | 63.8% 8,680 | 32.8% 4,469 | 3.4% 464 |
| 2008 | 59.0% 7,869 | 38.1% 5,079 | 2.9% 391 |
| 2004 | 65.9% 8,325 | 32.2% 4,073 | 1.9% 235 |
| 2000 | 62.3% 6,993 | 30.6% 3,439 | 7.1% 791 |
| 1996 | 46.7% 4,699 | 37.2% 3,745 | 16.2% 1,626 |
| 1992 | 43.8% 5,042 | 31.2% 3,594 | 25.1% 2,886 |
| 1988 | 53.5% 5,588 | 45.1% 4,708 | 1.5% 151 |
| 1984 | 62.9% 7,146 | 35.2% 3,996 | 1.9% 214 |
| 1980 | 66.8% 7,659 | 25.0% 2,861 | 8.2% 938 |
| 1976 | 47.0% 4,921 | 50.1% 5,241 | 2.9% 300 |
| 1972 | 59.9% 5,494 | 36.1% 3,312 | 4.0% 371 |
| 1968 | 55.0% 4,465 | 38.9% 3,156 | 6.1% 494 |
| 1964 | 36.3% 2,955 | 63.6% 5,173 | 0.1% 10 |
| 1960 | 45.3% 4,028 | 54.7% 4,866 | 0.0% 1 |
| 1956 | 66.3% 5,232 | 33.3% 2,628 | 0.4% 30 |
| 1952 | 74.9% 6,309 | 24.7% 2,079 | 0.5% 38 |
| 1948 | 56.4% 3,607 | 39.4% 2,521 | 4.2% 266 |
| 1944 | 65.3% 3,537 | 34.2% 1,850 | 0.5% 28 |
| 1940 | 65.3% 5,499 | 34.3% 2,889 | 0.5% 40 |
| 1936 | 23.0% 1,857 | 69.4% 5,612 | 7.7% 621 |
| 1932 | 24.6% 1,828 | 74.7% 5,548 | 0.7% 54 |
| 1928 | 42.0% 2,881 | 57.6% 3,946 | 0.4% 26 |
| 1924 | 44.3% 2,377 | 4.9% 265 | 50.8% 2,728 |
| 1920 | 86.4% 4,618 | 11.8% 632 | 1.8% 97 |
| 1916 | 56.4% 2,785 | 37.1% 1,835 | 6.5% 322 |
| 1912 | 27.9% 1,011 | 28.1% 1,017 | 44.0% 1,590 |
| 1908 | 67.9% 2,021 | 29.3% 873 | 2.8% 82 |
| 1904 | 80.8% 1,474 | 17.6% 321 | 1.6% 30 |
| 1900 | 66.0% 1,056 | 33.5% 536 | 0.4% 7 |
References
- "State & County QuickFacts". United States Census Bureau. Archived from the original on June 7, 2011. Retrieved November 1, 2013.
- "Find a County". National Association of Counties. Retrieved June 7, 2011.
- The territorial legislature removed the eastern part of Morton County, including Fort Abraham Lincoln and the adjacent military reservation, attaching it to Burleigh County. Lincoln, the civilian settlement north of Fort Abraham Lincoln, was county seat 1878 to 1879 until it was reassigned to Burleigh County.
- Patera, Alan H. (1982). North Dakota Post Offices 1850-1982. The Depot, Burtonsville MD. p. 56.
- "County History". Official Portal for North Dakota State Government. Archived from the original on February 2, 2015. Retrieved May 4, 2011.
- Wick, Douglas A. "Mandan (Morton County)". North Dakota Place Names. Retrieved May 6, 2011.
- Certification of the division of Morton County, ND - 28 November 1916 Archived July 3, 2008, at the Wayback Machine
- "Dakota Territory, South Dakota, and North Dakota: Individual County Chronologies". Dakota Territory Atlas of Historical County Boundaries. The Newberry Library. 2006. Retrieved February 3, 2015.
- Dalrymple, Amy (August 18, 2016). "Pipeline route plan first called for crossing north of Bismarck". The Bismarck Tribune. Archived from the original on November 1, 2016. Retrieved September 23, 2016.
- "Dakota Access Order | Sioux". Scribd. Retrieved January 24, 2017.
- "Amnesty International to Morton County Sheriff: Investigate Use of Force Against Protectors at DAPL - Indian Country Media Network". indiancountrytodaymedianetwork.com. Retrieved April 12, 2018.
- "VIDEO: Dakota Access Pipeline Company Attacks Native American Protesters with Dogs and Pepper Spray". Democracy Now!. Retrieved April 12, 2018.
- Morton County ND Google Maps (accessed 19 February 2019)
- ""Find an Altitude/Morton County ND" Google Maps (accessed 19 February 2019)". Archived from the original on May 21, 2019. Retrieved February 19, 2019.
- "2010 Census Gazetteer Files". US Census Bureau. August 22, 2012. Archived from the original on January 29, 2015. Retrieved February 1, 2015.
- "Population and Housing Unit Estimates". Retrieved March 27, 2020.
- "US Decennial Census". US Census Bureau. Retrieved February 1, 2015.
- "Historical Census Browser". University of Virginia Library. Retrieved February 1, 2015.
- Forstall, Richard L., ed. (April 20, 1995). "Population of Counties by Decennial Census: 1900 to 1990". US Census Bureau. Retrieved February 1, 2015.
- "Census 2000 PHC-T-4. Ranking Tables for Counties: 1990 and 2000" (PDF). US Census Bureau. April 2, 2001. Retrieved February 1, 2015.
- "Profile of General Population and Housing Characteristics: 2010 Demographic Profile Data". US Census Bureau. Archived from the original on February 13, 2020. Retrieved March 14, 2016.
- "Population, Housing Units, Area, and Density: 2010 - County". US Census Bureau. Archived from the original on February 13, 2020. Retrieved March 14, 2016.
- "Selected Social Characteristics in the US – 2006-2010 American Community Survey 5-Year Estimates". US Census Bureau. Archived from the original on February 13, 2020. Retrieved March 14, 2016.
- "Selected Economic Characteristics – 2006-2010 American Community Survey 5-Year Estimates". US Census Bureau. Archived from the original on February 13, 2020. Retrieved March 14, 2016.
- Leip, David. "Atlas of US Presidential Elections". uselectionatlas.org. Retrieved April 12, 2018.
External links
- Morton County official website
- Morton County maps, Sheet 1 (northeast), Sheet 2 (southeast), and Sheet 3 (western), North Dakota DOT
Places adjacent to Morton County, North Dakota | ||||||||||
|---|---|---|---|---|---|---|---|---|---|---|
| ||||||||||
Municipalities and communities of Morton County, North Dakota, United States | ||
|---|---|---|
| Cities | Map of North Dakota highlighting Morton County | |
| Township | ||
| CDP | ||
| Unincorporated communities | ||
| ||
| Counties | 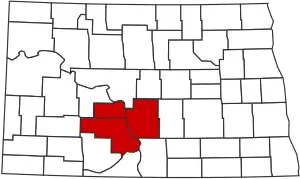 | |
|---|---|---|
| Core cities | ||
| Surrounding areas |
| |
| Authority control |
|---|
- "Dakota Access Order | Sioux". Scribd.