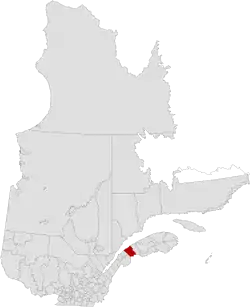
Rimouski-Neigette Regional County Municipality
Rimouski-Neigette is a regional county municipality in the Bas-Saint-Laurent region of Quebec, Canada.
Rimouski-Neigette | |
|---|---|
 | |
| Coordinates: 48.33°N 68.67°W[1] | |
| Country | |
| Province | |
| Region | Bas-Saint-Laurent |
| Effective | May 26, 1982 |
| County seat | Rimouski |
| Government | |
| • Type | Prefecture |
| • Prefect | Francis Saint-Pierre |
| Area | |
| • Total | 2,946.10 km2 (1,137.50 sq mi) |
| • Land | 2,715.17 km2 (1,048.33 sq mi) |
| Population (2016)[3] | |
| • Total | 56,650 |
| • Density | 20.9/km2 (54/sq mi) |
| • Change 2011–2016 | |
| • Dwellings | 28,811 |
| Time zone | UTC−5 (EST) |
| • Summer (DST) | UTC−4 (EDT) |
| Area code(s) | 418 and 581 |
The county seat is in Rimouski.
Subdivisions
There are 10 subdivisions within the RCM:[2]
- Cities & Towns (1)
- Municipalities (1)
- Parishes (7)
- La Trinité-des-Monts
- Saint-Anaclet-de-Lessard
- Saint-Eugène-de-Ladrière
- Saint-Fabien
- Saint-Marcellin
- Saint-Narcisse-de-Rimouski
- Saint-Valérien
- Unorganized Territory (1)
Demographics
Population
| Canada census – Rimouski-Neigette Regional County Municipality community profile | |||
|---|---|---|---|
| 2016 | 2011 | 2006 | |
| Population: | 56,650 (+2.8% from 2011) | 55,095 (+3.6% from 2006) | 53,193 (+1.7% from 2001) |
| Land area: | 2,715.17 km2 (1,048.33 sq mi) | 2,716.52 km2 (1,048.85 sq mi) | 2,716.47 km2 (1,048.83 sq mi) |
| Population density: | 20.9/km2 (54/sq mi) | 20.3/km2 (53/sq mi) | 19.6/km2 (51/sq mi) |
| Median age: | 47.3 (M: 45.0, F: 49.3) | 46.2 (M: 44.4, F: 47.8) | 44.1 (M: 42.8, F: 45.2) |
| Total private dwellings: | 28,811 | 27,127 | 25,380 |
| Median household income: | $56,835 | $50,891 | $43,616 |
| References: 2016[4] 2011[5] 2006[6] earlier[7] | |||
|
| ||||||||||||||||||||||||
| [8][9][3] | |||||||||||||||||||||||||
Language
| Canada Census Mother Tongue Language – Rimouski-Neigette Regional County Municipality[8][3] | ||||||||||||||||||
|---|---|---|---|---|---|---|---|---|---|---|---|---|---|---|---|---|---|---|
| Census | Total | French |
English |
French & English |
Other | |||||||||||||
| Year | Responses | Count | Trend | Pop % | Count | Trend | Pop % | Count | Trend | Pop % | Count | Trend | Pop % | |||||
2016 |
55,595 |
54,900 | 98.11% | 375 | 0.67% | 165 | 0.29% | 515 | 0.92% | |||||||||
2011 |
54,320 |
53,495 | 98.48% | 345 | 0.64% | 145 | 0.27% | 335 | 0.62% | |||||||||
2006 |
52,170 |
51,050 | 97.85% | 380 | 0.73% | 95 | 0.18% | 645 | 1.24% | |||||||||
2001 |
50,975 |
50,490 | 99.05% | 270 | 0.53% | 70 | 0.14% | 145 | 0.28% | |||||||||
1996 |
51,895 |
51,215 | n/a | 98.69% | 420 | n/a | 0.81% | 130 | n/a | 0.25% | 130 | n/a | 0.25% | |||||
Transportation
See also
References
- Reference number 141044 of the Commission de toponymie du Québec (in French)
- Geographic code 100 in the official Répertoire des municipalités (in French)
- "Census Profile, 2016 Census: Rimouski-Neigette, Municipalité régionale de comté [Census division], Quebec". Statistics Canada. Retrieved December 19, 2019.
- "2016 Community Profiles". 2016 Canadian Census. Statistics Canada. February 21, 2017. Retrieved 2019-12-19.
- "2011 Community Profiles". 2011 Canadian Census. Statistics Canada. July 5, 2013. Retrieved 2014-01-27.
- "2006 Community Profiles". 2006 Canadian Census. Statistics Canada. March 30, 2011. Retrieved 2013-05-10.
- "2001 Community Profiles". 2001 Canadian Census. Statistics Canada. February 17, 2012.
- Statistics Canada: 1996, 2001, 2006, 2011 census
- "(Code 2410) Census Profile". 2011 census. Statistics Canada. 2012.
- Official Transport Quebec Road Map
External links
 Media related to Rimouski-Neigette Regional County Municipality at Wikimedia Commons
Adjacent Counties & Equivalent Territories | |
|---|---|
| Regional county municipalities and equivalent territories | |
|---|---|
| Municipalities | |
This article is issued from Wikipedia. The text is licensed under Creative Commons - Attribution - Sharealike. Additional terms may apply for the media files.