Saint-Cézaire-sur-Siagne
Saint-Cézaire-sur-Siagne is a commune in the Alpes-Maritimes department in southeastern France.
Saint-Cézaire-sur-Siagne | |
|---|---|
 | |
 Coat of arms | |
Location of Saint-Cézaire-sur-Siagne 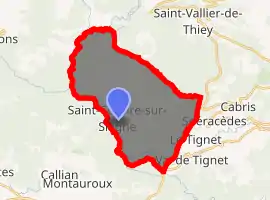
| |
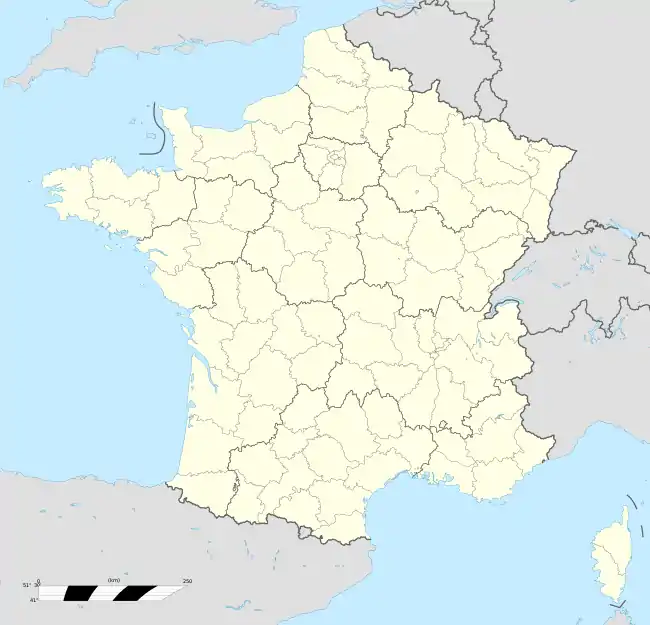 Saint-Cézaire-sur-Siagne 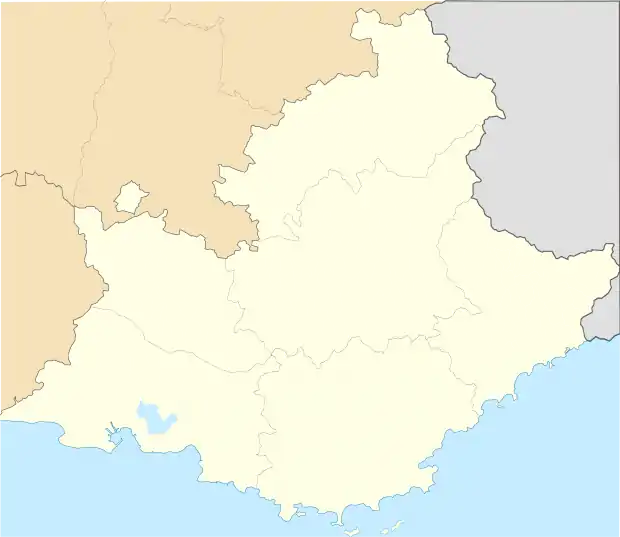 Saint-Cézaire-sur-Siagne | |
| Coordinates: 43°38′59″N 6°47′37″E | |
| Country | France |
| Region | Provence-Alpes-Côte d'Azur |
| Department | Alpes-Maritimes |
| Arrondissement | Grasse |
| Canton | Grasse-1 |
| Government | |
| • Mayor (2008–2014) | Maxime Coullet |
| Area 1 | 30.02 km2 (11.59 sq mi) |
| Population (2017-01-01)[1] | 3,908 |
| • Density | 130/km2 (340/sq mi) |
| Time zone | UTC+01:00 (CET) |
| • Summer (DST) | UTC+02:00 (CEST) |
| INSEE/Postal code | 06118 /06530 |
| Elevation | 95–771 m (312–2,530 ft) (avg. 500 m or 1,600 ft) |
| 1 French Land Register data, which excludes lakes, ponds, glaciers > 1 km2 (0.386 sq mi or 247 acres) and river estuaries. | |
Geography
Far from the major thoroughfares, Saint-Cézaire-sur-Siagne lies halfway between the beaches of the Côte d'Azur and the ski resorts of the Maritime Alps. It is located on a plateau at 475 m. Protected from north winds by the alpine foothills around Grasse, it enjoys an exceptionally tempered climate.
Saint-Cézaire-sur-Siagne is located at the extreme west end of Alpes-Maritimes, perched on a spur that dominates the valley of the Siagne.
Saint-Cézaire lies 15 km southwest of Grasse, 30 km from Cannes, and 52 km from Nice.
On the north are Escragnolles and Saint-Vallier-de-Thiey. To the south are Spéracèdes and Le Tignet. On the southwest are the valley of the Siagne and the massif of Tanneron, which forms the boundary between Alpes-Maritimes and the department of Var.
Population
|
|
References
- "Populations légales 2017". INSEE. Retrieved 6 January 2020.
| Wikimedia Commons has media related to Saint-Cézaire-sur-Siagne. |
| Authority control |
|
|---|