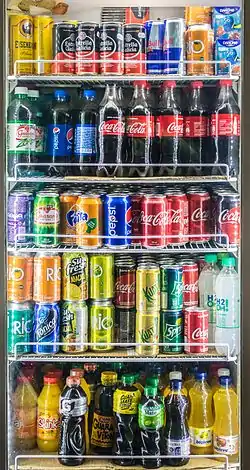
Sweetened beverage
A sweetened beverage is any beverage with added sugar.[1] It has been described as "liquid candy".[2] Consumption of sweetened beverages has been linked to weight gain, obesity, and associated health risks.[3][4] According to the CDC, consumption of sweetened beverages is also associated with unhealthy behaviors like smoking, not getting enough sleep and exercise, and eating fast food often and not enough fruits regularly.[5]
Sugar-related health concerns
A number of studies suggest that there is a significant correlation between increased consumption of sweetened beverages and weight gain leading to obesity.[3] There has also been an association between consumption of sweetened beverages and health risks such as coronary heart disease and diabetes.[6] Due to negative health effects of overconsumption of sweetened beverages, a sweetened beverage tax (soda tax) has been recommended by the Institute of Medicine in 2009.[4]
Some countries have tried to reduce sugary beverages in an effort to bring liquid caloric intake down. Mexico placed a tax on sugar-sweetened beverages (SSBs) in 2014.[7] Drinks that were not taxed included drinks with NNSs, milk with no added sugar, and water.[7] Other governments are active in placing policy on school lunches or what is being offered in school cafeterias in regards to beverages. Governmental activity is trying to eventually slow down the obesity epidemic.[7]
Non-nutritive sweeteners in sugar-sweetened beverages
Non-nutritive sweeteners (NNSs) have been introduced into the market in non-caloric drinks such as diet sodas. These artificial sweeteners are popular due to the growing demand for alternatives to SSBs. Consumption of artificially sweetened beverages (ASBs) with low-caloric NNSs has risen worldwide in recent years, with reports of consumption in approximately 30% of adults and 15% of children in USA between 2007 and 2008.[8] These sweeteners are more potent than regular, natural sugars and work by promoting GLP-1 (glucagon-like peptide1) secretion, which then stimulates gastric emptying and increases insulin secretion.[9] NNSs have shown to help short-term weight loss initiatives, but they don't show significance in the long-term.[10] Recent studies have been conducted to see whether or not NNSs pose a great risk for the development of certain diseases. Due to its ability to dissociate the sensation of sweet from caloric intake via hormonal changes, NNSs may increase appetite and promote larger food consumption and weight gain.[9] Studies have found various negative health outcomes associated with NNSs, including weight gain, obesity, metabolic syndrome, type II diabetes, cardiovascular events, and bladder cancer.[8][11] NNSs pose a greater risk to children especially because caloric compensation after consumption of NNSs is more complete in children who, compared to adults, lack social cues, learned behaviors, and self-control. Children compensate for NNSs consumption by increasing meal-associated calories and thus are at a higher risk of NNSs-associated weight gain.[9] One study researched the effect of NNSs with cardiovascular disease.[12] The research was taken using post menopausal women.[12] Women who consumed two or more diet drinks (containing NNSs) were found to be 30% at risk for cardiovascular disease.[12] There has been a decline in liquid calories due to the introduction of NNSs.[10]
Health implications of sugar sweetened beverages
Outlook on the population's health
Sugar sweetened beverages or sugary drinks are beverages that contain any form of added sugars.[13] Out of the entire diet, Americans add sugar to beverages more so than any other product.[14] Sugar-Sweetened beverages or sugary drinks are the leading source of added sugars in the American diet. Added sugars include syrups and other caloric sweeteners.[14] Other examples of added sugars, especially ones that can be listed as an ingredient, include brown sugar, corn sweetener, corn syrup, dextrose, fructose, glucose, high fructose corn syrup, honey, invert sugar, lactose, malt syrup, maltose, molasses, raw sugar, sucrose, trehalose, and turbinado sugar.[15] The added sugar content is associated with several health concerns like weight gain, obesity, type 2 diabetes, heart disease, liver disease, dental implications, and gout.[13] Naturally occurring sugars, such as those in fruit or milk, are not added sugars.[15] Even though there are several beverages/drinks that have sugar in them, some beverages, such as milk, fruit juice, and diet drinks, fall into a "gray" area because of different contributions to health and weight gain is more complex.[16] Sugar-sweetened beverages contain added sugars such as sucrose or fructose, often in large amounts, which contribute to the overall energy density of diets. The World Health Organization (WHO) has developed guidance on free sugars. Based on the impact of free sugars intake and its effects on weight gain and dental issues the WHO has taken action on such problems. Free sugars include monosaccharides and disaccharides added to foods and beverages by the manufacturer, cook or consumer, and sugars naturally present in honey, syrups, fruit juices and fruit juice concentrates. Current evidence suggests that increasing consumption of sugar-sweetened beverages is associated with weight gain. Reducing consumption of sugar-sweetened beverages can also reduce the risk of unhealthy weight gain in adults.[17] For a normal calorie diet, calories from added sugars should be less than 10 percent of the daily calorie limit.[15] Eating habits that include a lesser amount of added sugars, that can be from reduced intake of sugary drinks, can be associated with reduced risk of CVD in adults, and moderate evidence indicates that these eating patterns are associated with reduced risk of obesity, type 2 diabetes, and some types of cancer in adults.[15]
Sugar addiction
Evidence regarding sugar addiction is mainly based on literature and research conducted on animals. There is a biomedical and neurological science behind the usage of mini-pigs and lab rodents. In these animal species, there are similarities with humans in terms of cognition, development of food preferences and eating disorders, digestive anatomy and functions, as well as brain development.[17] Research has demonstrated that, under certain conditions, rats can develop addiction-like behaviors with respect to sugar.[17] The food addiction model asserts that excessive consumption of palatable foods may be understood within the same neurobiological framework as drug addiction.[17] The test subjects have similar brain anomalies as those described in humans. Drug addiction has an impact on the brain's reward center and substance abuse. In drug addiction, there is a "drug-seeking" behavior, which is similar having a "sweet tooth" and seeking to satisfy the desire for a sweet item. Reward from eating is controlled by the mesolimbic dopamine (DA) pathway. In the animal study, a fructose and glucose diet induced modifications in several brain regions involved in reward and eating behavior. The observations from the study asserts that food and drug consumption share a common neurobiology that "hijack" a neural system that primarily processes natural rewards like foods. Sugar is believed to stimulate dopamine in the central nervous system.[18] In summary, the research provided several clinical facts and evidences on the effects of sugar consumption on the central nervous system.[18]
Human research has also been conducted on sugar (in the form of sugar-sweetened beverages) and its effects on the kidneys. Sugar consumption has been associated with the rising prevalence of chronic kidney disease in the United States.[19] Since 1997, the nation has dramatically increased sugar consumption to nearly half a pound per person per day. Much of this increase is driven by high fructose syrup (HFCS) consumption, which now amounts to over 62 lb per person per year, largely in form of sugar-sweetened beverages. In addition to dietary sugar being associated with CKD risk factors, data from animal studies do suggest that sugar consumption may independently affect kidney disease risk. Studies have been conducted to highlight the severity of sugary sweetened beverage consumption.[19] These studies were completed with a variety of test subjects to account for age, sex, diets, lifestyle choices, physical activity, smoking, level of education, and health status.[19] The variety in the test subjects created a wide spectrum of results to match any individual. Also, the experiments consisted of a variety of consumption frequencies. Some studies only consumed one glass of a sugary sweetened beverage a week, while others consumed more than seven glasses of a sugary sweetened beverage a week.[20]
In a recent study, the notion of sugar addiction has been challenged.[21] The study examined a sample of 1495 human participants to determine if foods mainly containing sugar cause "addiction-like" problems that meet clinical Diagnostic and Statistical Manual of Mental Disorders criteria for substance dependence. The researchers also investigated whether potential dependence on sugar relates to body weight and negative affectivity such as mood depression. The results revealed that the majority of participants experienced at least one symptom of food dependence for combined high-fat savoury (30%) and high-fat sweet (25%) foods while only a minority experienced such problems for low-fat/savoury (2%) and mainly sugar-containing foods (5%). Furthermore, while addictive-like symptoms for high-fat savoury and high-fat sweet foods correlated to overweight conditions, this was not found to be the case for foods mainly containing sugar.[21] Consequently, the findings indicated that sugary foods have a minimal role to contributing to food dependence and the increased risk of weight gain.
Milk vs sweetened beverage consumption
Research has demonstrated when school aged children (3–7 yrs. Of age) are given the choice of choosing milk or sweetened beverages at lunch time, they tend to choose the sweetened beverages.[22] This has major health implications for children, as nutrition is essential for proper development.[23] Studies have shown sugar sweetened beverages displace important nutrients such as iron and calcium which result in deficiency-related conditions. For example, iron deficiency can result in nerve impulse delay.[23] Children who do not consume the appropriate amount of calcium into their daily diets have lower calcium consumption as they get older.[22] In contrast, as they get older, their intake of sugary beverages increases.[22] Many children grow to have a level of intolerance to milk and another significant percentage grow to not like the taste of milk.[6] Insufficient levels of calcium throughout adolescence is a precursor for osteoporosis and even obesity in some cases.[24] Maternal consumption of milk can influence children's consumption. A study of 9-year-old girls and calcium consumption reported those who met the average recommended intake (AI) for calcium consumed almost twice as much milk and less sweetened beverages (18%) had mothers who drank milk more frequently than those who were under the AI for calcium.[25]
Healthy schools campaign is an initiative set forth by Michelle Obama that promotes nutritional enrichment through food an education.[26] The national initiatives under this program are cooking up change, green clean schools, school nurse leadership, and national collaborations.[26] As a result, many of the sugary drinks/ sodas in elementary, middle, and high schools have been replaced by water and other nutritious drinks.[27]
Obesity
Between 1975 and 2016, the worldwide prevalence of obesity nearly tripled. According to the World Health Organization, in 2016, more than 1.9 billion of adults, 18 years and older, were overweight. Of these, over 650 million (34%) were obese. Over 340 million children and adolescents aged 5–19 were overweight or obese in 2016.[28] The obesity rate is forecasted to rise to 42% by 2030.[29] Every year, the United States spends an estimated $190 billion on obesity related conditions, or 21% of all United States health care costs.[30]
Obesity prevalence is due to genetic, metabolic, cultural, environmental, socioeconomic, and behavioral factors. Along with the increase in overweight and obese populations, the consumption of carbohydrates, particularly in the form of added sugars has increased.[31]
Research studies have indicated that there is a correlation between drinking sugar-sweetened beverages and gaining weight or becoming obese. Sugar-sweetened beverages do not provide the feeling of fullness like solid foods do, which may cause one to consume more of the beverage.[32] According to the Center for Disease Control, the Behavioral Risk Factor Surveillance System Survey found that 30.1% of American adults consume at least one sugar-sweetened beverage daily.[33] Around the United States, sugar-sweetened beverage intake differs based on geographic regions and socio-demographic characteristics. States known for their obesity rates also had high consumption rates of sugar-sweetened beverages. For example, 47.1% of Mississippi adults consume at least one sugar-sweetened beverage a day.[33] Their obesity rate correlates, with 35.6% of the adult population being obese in 2016.[34]
The World Health Organization has advised reducing intake of free sugars, such as monosaccharides and disaccharides that are added to beverages by manufacturers, cooks, or consumers.[32] Studies have supported WHO's guidance as well. A 2006 clinical trial found that when over weight or obese adults replaced caloric beverages with water or noncaloric beverages for 6 months, they averaged weight losses of 2–2.5%.[35] In addition, The Obesity Society recommends minimizing children's intake of sugar-sweetened beverages.[36]
Efforts to reduce consumption of sugar-sweetened beverages and obesity include both monetary penalties and limiting exposure to sugar-sweetened beverages. For example, numerous states, including Vermont have proposed taxing sugar-sweetened beverages or increasing the prices to reduce consumption.[37] Economists estimate that increasing sugar sweetened beverage prices by 10% would reduce sugar sweetened beverage consumption by 12%.[38] Global experts in fiscal policies concluded that a minimum of 20% increase in sugar-sweetened beverage taxes would result in proportional reduction in consumption.[39] Other solutions target children, focusing on prohibiting sugar-sweetened beverages on school/after care property, including vending machines and lunches.[37] Limits are also being considered on sugar-sweetened beverages in the workplace.[37] Furthermore, beverage companies are being approached about reducing portion sizing of sugar-sweetened beverages because portion sizes have increased substantially over the past few decades.[37]
Impact on oral health
Oral health has shown to be affected with regard to sugar sweetened beverage consumption. Acid erosion and dental caries have been the main health concerns to sugar sweetened beverages.
Acid erosion is defined as the loss of tooth enamel caused by acid attack.[40] When consuming carbonated sugar sweetened beverages, acid deposits on the teeth, attacking the enamel. Over a gradual period, the enamel is worn down, which can lead to dental caries. Erosion of tooth enamel begins at a pH of 5.5,[41] and ingredients found in sugar sweetened beverages such as phosphoric acid and citric acid significantly contribute to the demineralization of the enamel. Citric acid in various sugar sweetened beverages can cause chelation.[42]
Consumption of sports and energy drinks have been linked to irreversible tooth damage.[43] This is especially common in adolescents who consume about 30-50% of the beverages that are on the market.[44] Studies have shown that energy drinks have caused twice as much damage on teeth than sports drinks. Citric acid, the preservative found in many sugar sweetened beverages causes stripping of the enamel.[45]
Fruit juices generally contain lower amounts of sugar than carbonated sugar sweetened beverages.[45] The acidity levels found in fruit juices vary, with citrus based juices having the lowest pH levels. The low acidity found in fruit juices cause higher risk of cavities with enamel exposure.[46]
Frequency of sugar sweetened beverages results in dental caries, which are caused by Streptococcus bacteria. Dental caries is an infectious oral disease and is the breakdown of the teeth due to the bacteria in the mouth. It occurs when bacteria within the plaque metabolize the sugar,[47] releasing various acids as waste compounds. As the acids are released, they form holes in the teeth which dissolve the enamel. The sugars, therefore provide a passageway for the activities of the oral bacteria, lowering salivary pH. The bacteria alone are not the sole cause of tooth decay, as it is the presence of these sugars that inhibit the production of acid.
Effects on blood potassium levels
Hypokalemia is a potassium deficiency. It is defined by the level of potassium in the blood; levels 3.5 and 5.0 mmoL are considered to be normal while levels below 3.5 mmol/L are defined as hypokalemia.
There are many case reports on the relationship between hypokalemia and sugar sweetened beverages such as cola-based drinks. Based on reports published,[48][49] patients' potassium levels decreased because of an increase in cola consumption; and as the consumption was reduced potassium levels rose back to normal levels.[49] Oral supplements and other methods did not help raise potassium levels. And so it was concluded that extreme cola consumption can lead to hypokalemia. Symptoms caused by an increased consumption of cola that lead to hypokalemia include muscle weakness, leg cramps, and fatigue.[49]
There are three mechanisms that lead to potassium deficiency due to cola drinks. They are as follows: (1) a large intake of glucose which leads to an intracellular redistribution of potassium; (2) potassium wasting due to large masses of indigestible fructose in the gastrointestinal tract; (3) the caffeine in cola drinks lead to diuresis, an increase in the sodium-potassium pumps via cellular phosphodiesterase inhibition, increased renin levels, and also produced metabolic alkalosis which all lead to hypokalemia.[49]
The consumption of sugar sweetened beverages has increased over the years; this includes caffeinated and un-caffeinated drinks. The rise in consumption of soft drinks is due to the current convenience, availability, and accessibility of sugar sweetened beverages today. Over these years an increase in concern and action towards the accessibility of sugar sweetened beverages have been taken through policy. Government officials and doctors alike have responded to the increase in sugar sweetened beverages and its health effects.[49] Internists have further discussed adding extreme sugar sweetened beverages consumption to the list of usual questions about alcohol, tobacco, and illicit drugs that lead to hypokalemia. Although low potassium levels are tolerated in healthy adults, as cola consumption increases things like obesity, hypertension, and diabetes can be developed from hypokalemia.[49]
Pregnancy
Dietary improvements in expecting mothers are important for the future health of the mother and child. Sugar-sweetened beverages among other beverages like coffee and alcohol are recommended to be reduced in intake. A Norwegian study, showed that pregnant woman minimized their intake of sugar-sweetened beverages, alcohol, and coffee, when educated about the negative effects these beverages can have on their unborn child.[50] The statistics for each beverage showed that among alcohol, coffee, and sugar-sweetened beverages, sugar-sweetened beverages were still consumed more despite there being a minimized intake. The minimized intake of coffee and alcohol is due to the less harmful effects sugar-sweetened beverages have compared to coffee and alcohol.[50][51] The report declares that the minimized intake may be due to alcohol and coffee being a part of socializing and therefore becomes substituted by sugar-sweetened beverages at social events.[50]
Risk of type II diabetes
A large prospective cohort study showed an approximate doubling of the risk of Type II Diabetes in women who consumed at least one sugary drink per day when compared to women who consumed on average less than one sugary drink daily. This risk seemed to further be linked to an increase in BMI (Body Mass Index) that is associated with obesity and weight gain over the time course of follow-up in the study. It is important to note that fruit juice (containing no added sugars) did not significantly increase the risk for Type II Diabetes throughout the course of this study and these increases in risk seemed to be associated with beverages such as fruit punch, which have much more added sugar.[52]
Type II diabetes pathogenesis
The hallmarks of type II diabetes (T2DM) pathogenesis are insulin resistance and impaired insulin secretion. In the earlier stages of disease development, cells throughout the body become resistant to the effects of insulin. Therefore, insulin is unable to cause cells to take up glucose (among other impairments) and glucose builds up in the blood. As a result, insulin secretion is ramped up, to try to compensate for this lack of response. For a while this may work, but eventually, the body's ability to secrete insulin from the pancreatic beta cells gets burnt out. In later stages of T2DM, patient cells are both resistant to insulin effects and the pancreas has lost its ability to produce adequate insulin in response to glucose. Type II diabetes is a progressive disease which eventually can lead to patients becoming dependent on exogenous insulin to lower their blood glucose levels.[53]
Consumption of high fructose and sucrose-containing diets have been previously associated with increased risk of T2DM through animal studies linking increased sugar consumption to decreased insulin sensitivity.[54][55] However, a definitive conclusion on this association is still controversial, owing to a lack of data and trials on the direct effect of high-sugar diets in T2DM development.[56] Current evidence suggests that the danger of high-sugar diets in increasing T2DM risk comes not from the direct effects of sugar on insulin resistance, but more so from the imbalance of energy intake-use that high-sugar diets can contribute to.[57]
In the United States
The increase in consumption of sweetened beverages has been described as a worldwide health problem, but it is particularly visible in the United States, from where most popular drinks, like sodas, have originated.[6] In the US, sweetened beverages such as most sodas are the most widely consumed type of foods containing added sugar, and they account for about a third of all consumption of added sugars (about half if counted together with fruit juice; about twice the amount that is gained from the categories of "desserts" and "sweets").[4][58][59] They represent about 7% of total energy intake, where they can account for up to 15% in children, and have been described as the "largest single food source of calories in the US diet".[6] The consumption of sweetened beverages has increased in the US since the 1970s, accounting for a significant portion (perhaps as high as a half) of the rise in caloric intake among the American populace.[2] Some more recent research suggests that the added sugar consumption in the US has started declining in the 21st century, due to a related decrease in the consumption of sweetened beverages, encouraged by the government health awareness initiative and other programs.[59]
The following drinks have been classified in the US as sweetened beverages if they contained sugar or other caloric sweeteners: fruit or fruit-flavored drinks, energy drinks, flavored water, coffees, teas, nonalcoholic wines and beers.[60]
Influence of the household and media/advertisement
Household
Taste preferences and eating behaviors in children are molded at a young age by factors, such as parents' habits and advertisements.[61][62] One study compared what adults and children considered when choosing beverages.[62] For the most part, adults considered whether beverages had sugar, caffeine, and additives.[62] Some of the 7- to 10-year-old children in the study also mentioned "additives" and "caffeine", which may be unfamiliar terms to them. This showed the possibility of the parents' influence on their children's decision-making on food choice and eating behaviors.
Media
Although many factors contribute to eating behaviors and food choices in children, food advertising and media are also important factors to consider.[61] Marketing and media influences include television advertising, in-school marketing, product placements, kids clubs, the internet, toys and products with brand logos, and youth-targeted promotions.[61] Marketers heavily target children and adolescents as consumers because of the amount of their own money spent annually, their influence on household food purchases, and their future as adult consumers.[61] It has been estimated that US adolescents spend $140 billion a year. Of that, children under 12 years spend another $25 billion and may have the potential to influence another $200 billion of spending per year.[61] Although there are limited studies on food advertisement on actual food intake, a literature review concluded that children exposed to advertising will choose advertised food products, attempt to influence food purchases their parents buy, and request for specific brands, all at higher rates compared to children not exposed.[63]
See also
References
- Jesse Kurtz - Nicholl, Students Growing Food: The Study of a Food - Production Focused Intervention in a California High School: Differences in Food Habits and Attitudes between Program and Control Students, (PDF) http://www.livablefutureblog.com/wp-content/uploads/2010/07/capstone-final-paper22.pdf. Missing or empty
|title=(help) - Dianne Hales (1 January 2010). An Invitation to Health: Choosing to Change. Cengage Learning. p. 189. ISBN 978-0-538-73655-8. Retrieved 20 April 2013.
- Frank Hu Associate Professor of Nutrition and Epidemiology Harvard School of Public Health (20 February 2008). Obesity Epidemiology. Oxford University Press. pp. 283–285. ISBN 978-0-19-971847-4. Retrieved 20 April 2013.
- Travis A. Smith (November 2010). Taxing Caloric Sweetened Beverages: Potential Effects on Beverage Consumption, Calorie Intake, and Obesity. DIANE Publishing. pp. 13–14. ISBN 978-1-4379-3593-6. Retrieved 20 April 2013.
- "Sugar Sweetened Beverage Intake". Centers for Disease Control and Prevention. Retrieved 2017-11-01.
- Cardiac rehabilitation manual. Springer. 2011. p. 55. ISBN 978-1-84882-794-3. Retrieved 20 April 2013.
- Blecher, E (2015). "Taxes on tobacco, alcohol and sugar sweetened beverages: Linkages and lessons learned". Social Science and Medicine. 136–137: 175–179. doi:10.1016/j.socscimed.2015.05.022. PMID 26005761.
- Swithers, Susan E. (September 2013). "Artificial sweeteners produce the counterintuitive effect of inducing metabolic derangements". Trends in Endocrinology & Metabolism. 24 (9): 431–441. doi:10.1016/j.tem.2013.05.005. PMC 3772345. PMID 23850261.
- Brown, Rebecca J.; De Banate, Mary Ann; Rother, Kristina I. (2010-08-01). "Artificial Sweeteners: A systematic review of metabolic effects in youth". International Journal of Pediatric Obesity. 5 (4): 305–312. doi:10.3109/17477160903497027. ISSN 1747-7174. PMC 2951976. PMID 20078374.
- Swithers, SE (2015). "Artificial sweeteners are not the answer to childhood obesity". Appetite. 93 (9): 85–90. doi:10.1016/j.appet.2015.03.027. PMID 25828597.
- Howe, G.R; Burch, J.D; Miller, A.B; Morrison, B; Gordon, P; Weldon, L; Chambers, L.W; Fodor, G; Winsor, G.M (September 1977). "Artificial Sweeteners and Human Bladder Cancer". The Lancet. 310 (8038): 578–581. doi:10.1016/S0140-6736(77)91428-3. PMID 71398.
- Vyas, A; Rubenstein, L; Robinson, J; Seguin, RA; Vitolins, MZ; Kazlauskaite, R; Shikany, JM; Johnson, KC; Snetselaar, L; Wallace, R (2015). "Diet Drink Consumption and the Risk of Cardiovascular Events: A Report from the Women's Health Initiative". Journal of General Internal Medicine. 30 (4): 462–468. doi:10.1007/s11606-014-3098-0. PMC 4371001. PMID 25515135.
- "Cut Back on Sugary Drinks". Centers for Disease Control and Prevention. Retrieved 2016-12-16.
- "Chapter 2 Introduction - 2015-2020 Dietary Guidelines - health.gov". health.gov. Retrieved 2016-12-16.
- "A Closer Look Inside Healthy Eating Patterns - 2015-2020 Dietary Guidelines - health.gov". health.gov. Retrieved 2016-12-16.
- "Healthy Beverage Toolkit" (PDF). Retrieved 2016-12-16.
- "Reducing consumption of sugar-sweetened beverages to reduce the risk of unhealthy weight gain in adults". World Health Organization. Retrieved 2016-12-16.
- Ochoa, Melissa; Malbert, Charles-Henri; Meurice, Paul; Val-Laillet, David; Cheng, Juei-Tang (1 September 2016). "Effects of Chronic Consumption of Sugar-Enriched Diets on Brain Metabolism and Insulin Sensitivity in Adult Yucatan Minipigs". PLOS ONE. 11 (9): e0161228. Bibcode:2016PLoSO..1161228O. doi:10.1371/journal.pone.0161228. PMC 5008621. PMID 27583555.
- Karalius, Vytas P.; Shoham, David A. (March 2013). "Dietary Sugar and Artificial Sweetener Intake and Chronic Kidney Disease: A Review". Advances in Chronic Kidney Disease. 20 (2): 157–164. doi:10.1053/j.ackd.2012.12.005. PMID 23439375.
- Solak, Yalcin; Karagoz, Ali; Atalay, Huseyin (October 2010). "Sugar-sweetened soda consumption, hyperuricemia, and kidney disease". Kidney International. 78 (7): 708, author reply 708–9. doi:10.1038/ki.2010.273. PMID 20842151.
- Markus, C. Rob; Rogers, Peter J.; Brouns, Fred; Schepers, Robbie (July 2017). "Eating dependence and weight gain; no human evidence for a 'sugar-addiction' model of overweight". Appetite. 114: 64–72. doi:10.1016/j.appet.2017.03.024. hdl:1983/699cf0f2-1344-4414-bd84-0cf80c0feff5. PMID 28330706.
- Keller, Kathleen L.; Kirzner, Jared; Pietrobelli, Angelo; St-Onge, Marie-Pierre; Faith, Myles S. (March 2009). "Increased Sweetened Beverage Intake Is Associated with Reduced Milk and Calcium Intake in 3- to 7-Year-Old Children at Multi-Item Laboratory Lunches". Journal of the American Dietetic Association. 109 (3): 497–501. doi:10.1016/j.jada.2008.11.030. PMC 2748414. PMID 19248869.
- "Mealtime Memo For Child Care" (PDF). 2001. Archived from the original (PDF) on 2011-08-12.
- "Osteoporosis and Calcium: Learn About Supplements". eMedicineHealth. Retrieved 2016-12-16.
- Fisher, Jennifer O.; Mitchell, Diane C.; Smiciklas-Wright, Helen; Mannino, Michelle L.; Birch, Leann L. (2004-04-01). "Meeting calcium recommendations during middle childhood reflects mother-daughter beverage choices and predicts bone mineral status". The American Journal of Clinical Nutrition. 79 (4): 698–706. doi:10.1093/ajcn/79.4.698. ISSN 0002-9165. PMC 2530917. PMID 15051617.
- "School Food | Healthy Schools Campaign". Healthy Schools Campaign. Retrieved 2016-12-16.
- Rhodan, Maya. "Michelle Obama's Pro-Water (Soda Silent) Campaign Makes Waves". TIME.com. Retrieved 2016-12-16.
- "Obesity and overweight". World Health Organization. Retrieved 2017-11-01.
- Finkelstein, Eric A.; Khavjou, Olga A.; Thompson, Hope; Trogdon, Justin G.; Pan, Liping; Sherry, Bettylou; Dietz, William (2012-06-01). "Obesity and severe obesity forecasts through 2030". American Journal of Preventive Medicine. 42 (6): 563–570. doi:10.1016/j.amepre.2011.10.026. ISSN 1873-2607. PMID 22608371.
- Cawley, John; Meyerhoefer, Chad (2012-01-01). "The medical care costs of obesity: an instrumental variables approach". Journal of Health Economics. 31 (1): 219–230. doi:10.1016/j.jhealeco.2011.10.003. ISSN 1879-1646. PMID 22094013.
- Malik, Vasanti S; Schulze, Matthias B; Hu, Frank B (2016-12-17). "Intake of sugar-sweetened beverages and weight gain: a systematic review". The American Journal of Clinical Nutrition. 84 (2): 274–288. doi:10.1093/ajcn/84.2.274. ISSN 0002-9165. PMC 3210834. PMID 16895873.
- "Reducing consumption of sugar-sweetened beverages to reduce the risk of childhood overweight and obesity". World Health Organization. Retrieved 2016-12-17.
- Park, Sohyun; Xu, Fang; Town, Machell; Blanck, Heidi M. (2016-01-01). "Prevalence of Sugar-Sweetened Beverage Intake Among Adults — 23 States and the District of Columbia, 2013". MMWR. Morbidity and Mortality Weekly Report. 65 (7): 169–174. doi:10.15585/mmwr.mm6507a1. ISSN 0149-2195. PMID 26914018.
- "Mississippi State Obesity Data, Rates and Trends: The State of Obesity". stateofobesity.org. Retrieved 2016-12-17.
- Tate, Deborah F.; Turner-McGrievy, Gabrielle; Lyons, Elizabeth; Stevens, June; Erickson, Karen; Polzien, Kristen; Diamond, Molly; Wang, Xiaoshan; Popkin, Barry (2012-03-01). "Replacing caloric beverages with water or diet beverages for weight loss in adults: main results of the Choose Healthy Options Consciously Everyday (CHOICE) randomized clinical trial". The American Journal of Clinical Nutrition. 95 (3): 555–563. doi:10.3945/ajcn.111.026278. ISSN 1938-3207. PMC 3632875. PMID 22301929.
- "Reduced Consumption of Sugar-Sweetened Beverages Can Reduce Total Caloric Intake - The Obesity Society". www.obesity.org. Retrieved 2016-12-17.
- http://www.changelabsolutions.org/sites/default/files/SSB_Playbook_FINAL-20131004.pdf
- Powell, Lisa M.; Chriqui, Jamie F.; Khan, Tamkeen; Wada, Roy; Chaloupka, Frank J. (2016-12-17). "Assessing the Potential Effectiveness of Food and Beverage Taxes and Subsidies for Improving Public Health: A Systematic Review of Prices, Demand and Body Weight Outcomes". Obesity Reviews. 14 (2): 110–128. doi:10.1111/obr.12002. ISSN 1467-7881. PMC 3556391. PMID 23174017.
- Temo, Waqanivalu (2016). Fiscal policies for diet and prevention of noncommunicable diseases : technical meeting report, 5-6 May 2015, Geneva, Switzerland. Nederveen, Leo,, World Health Organization. Geneva, Switzerland. ISBN 9789241511247. OCLC 961182381.
- "Oral treatments and dental health ' Mouth Conditions ' Dental erosion | The British Dental Health Foundation". www.dentalhealth.org. Retrieved 2016-12-17.
- "21 Century Dental | Drinks That Eat Teeth". www.21stcenturydental.com. Retrieved 2016-12-17.
- Mishra, MB; Mishra, Shanu (2011-01-01). "Sugar-Sweetened Beverages: General and Oral Health Hazards in Children and Adolescents". International Journal of Clinical Pediatric Dentistry. 4 (2): 119–123. doi:10.5005/jp-journals-10005-1094. ISSN 0974-7052. PMC 5030497. PMID 27672250.
- "Know Your Teeth - Infobites - Sports and Energy Drinks Responsible for Irreversible Damage to Teeth -- Search By Keyword, Letter or Phrase - 1-877-2X-A-YEAR (1-877-292-9327)". www.knowyourteeth.com. Retrieved 2016-12-17.
- "Energy Drinks Can Take Teeth On An Irreversible Acid Trip". NPR.org. Retrieved 2016-12-17.
- "Soft Drinks & Oral Health - United Concordia Dental Insurance". www.sunlifedentalbenefits.com. Retrieved 2016-12-17.
- "Acid Erosion - Is It Eating Away Your Teeth? - Doon South Dental". Doon South Dental. 2016-02-18. Retrieved 2016-12-17.
- Touger-Decker, Riva; Loveren, Cor van (2003-10-01). "Sugars and dental caries". The American Journal of Clinical Nutrition. 78 (4): 881S–892S. doi:10.1093/ajcn/78.4.881S. ISSN 0002-9165. PMID 14522753.
- Dubey, Divyanshu; Sawhney, Anshudha; Sharma, Abhishek; Dubey, Devashish (2016-12-17). "Paroxysmal Paralytic Attacks Secondary to Excessive Cola Consumption". Clinical Medicine & Research. 12 (1–2): 61–64. doi:10.3121/cmr.2013.1167. ISSN 1539-4182. PMC 4453309. PMID 24573702.
- Packer, C. D. (2009-06-01). "Cola-induced hypokalaemia: a super-sized problem". International Journal of Clinical Practice. 63 (6): 833–835. doi:10.1111/j.1742-1241.2009.02066.x. ISSN 1742-1241. PMID 19490191.
- Skreden, Marianne; Bere, Elling; Sagedal, Linda R.; Vistad, Ingvild; Øverby, Nina C. (2015-05-01). "Changes in beverage consumption from pre-pregnancy to early pregnancy in the Norwegian Fit for Delivery study". Public Health Nutrition. 18 (7): 1187–1196. doi:10.1017/S136898001400189X. ISSN 1475-2727. PMID 25221910.
- Dale, Maria T. G.; Bakketeig, Leiv S.; Magnus, Per (2016-04-01). "Alcohol consumption among first-time mothers and the risk of preterm birth: a cohort study". Annals of Epidemiology. 26 (4): 275–282. doi:10.1016/j.annepidem.2015.08.013. ISSN 1873-2585. PMID 26520847.
- Schulze, Matthias B. (2004-08-25). "Sugar-Sweetened Beverages, Weight Gain, and Incidence of Type 2 Diabetes in Young and Middle-Aged Women". JAMA. 292 (8): 927–34. doi:10.1001/jama.292.8.927. ISSN 0098-7484. PMID 15328324.
- "Type 2 diabetes - Symptoms and causes - Mayo Clinic". www.mayoclinic.org. Retrieved 2017-10-30.
- Benetti, Elisa; Mastrocola, Raffaella; Rogazzo, Mara; Chiazza, Fausto; Aragno, Manuela; Fantozzi, Roberto; Collino, Massimo; Minetto, Marco A. (2013). "High Sugar Intake and Development of Skeletal Muscle Insulin Resistance and Inflammation in Mice: A Protective Role for PPAR- Agonism". Mediators of Inflammation. 2013: 509502. doi:10.1155/2013/509502. PMC 3703883. PMID 23861559.
- Palanker Musselman, L.; Fink, J. L.; Narzinski, K.; Ramachandran, P. V.; Sukumar Hathiramani, S.; Cagan, R. L.; Baranski, T. J. (30 June 2011). "A high-sugar diet produces obesity and insulin resistance in wild-type Drosophila". Disease Models & Mechanisms. 4 (6): 842–849. doi:10.1242/dmm.007948. PMC 3209653. PMID 21719444.
- Stanhope, Kimber L. (17 September 2015). "Sugar consumption, metabolic disease and obesity: The state of the controversy". Critical Reviews in Clinical Laboratory Sciences. 53 (1): 52–67. doi:10.3109/10408363.2015.1084990. PMC 4822166. PMID 26376619.
- Macdonald, I. A. (23 November 2016). "A review of recent evidence relating to sugars, insulin resistance and diabetes". European Journal of Nutrition. 55 (S2): 17–23. doi:10.1007/s00394-016-1340-8. PMC 5174139. PMID 27882410.
- Lindsay H Allen; Andrew Prentice (28 December 2012). Encyclopedia of Human Nutrition 3E. Academic Press. pp. 231–233. ISBN 978-0-12-384885-7. Retrieved 4 April 2013.
- Welsh, J. A.; Sharma, A. J.; Grellinger, L.; Vos, M. B. (13 July 2011). "Consumption of added sugars is decreasing in the United States". American Journal of Clinical Nutrition. 94 (3): 726–734. doi:10.3945/ajcn.111.018366. PMC 3155936. PMID 21753067.
- How Food Away from Home Affects Children's Diet Quality. DIANE Publishing. January 2011. pp. 12–. ISBN 978-1-4379-4084-8. Retrieved 20 April 2013.
- Story, Mary; French, Simone (2004). "Food Advertising and Marketing Directed at Children and Adolescents in the US". International Journal of Behavioral Nutrition and Physical Activity. 1 (1): 3. doi:10.1186/1479-5868-1-3. PMC 416565. PMID 15171786.
- Bucher, Tamara; Siegrist, Michael (23 January 2015). "Children's and parents' health perception of different soft drinks". British Journal of Nutrition. 113 (3): 526–535. doi:10.1017/S0007114514004073. PMID 25612601.
- Coon, KA; Tucker, KL (October 2002). "Television and children's consumption patterns. A review of the literature". Minerva Pediatrica. 54 (5): 423–36. PMID 12244280.
Sugar (as food commodity) | |||||||
|---|---|---|---|---|---|---|---|
| Chemistry |  | ||||||
| Sources | |||||||
| Products |
| ||||||
| Industry |
| ||||||
| History | |||||||
| Culture | |||||||
| Related | |||||||
| Research | |||||||
| |||||||