Westmorland, California
Westmorland (formerly, Westmoreland)[6] is a city in Imperial County, California. Westmorland is located 8.5 miles (14 km) southwest of Calipatria.[6] The population was 2,225 at the 2010 census, up from 2,131 in 2000. It is part of the El Centro Metropolitan Area. The mayor of Westmorland is Ana Beltran.
City of Westmorland | |
|---|---|
City | |
 City Hall of Westmorland | |
 Seal | |
| Motto(s): "Today's Roadrunners Tomorrow's Leaders" | |
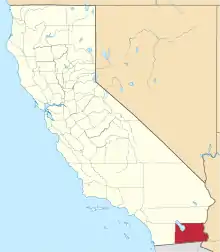
 Location in Imperial County and the state of California | |
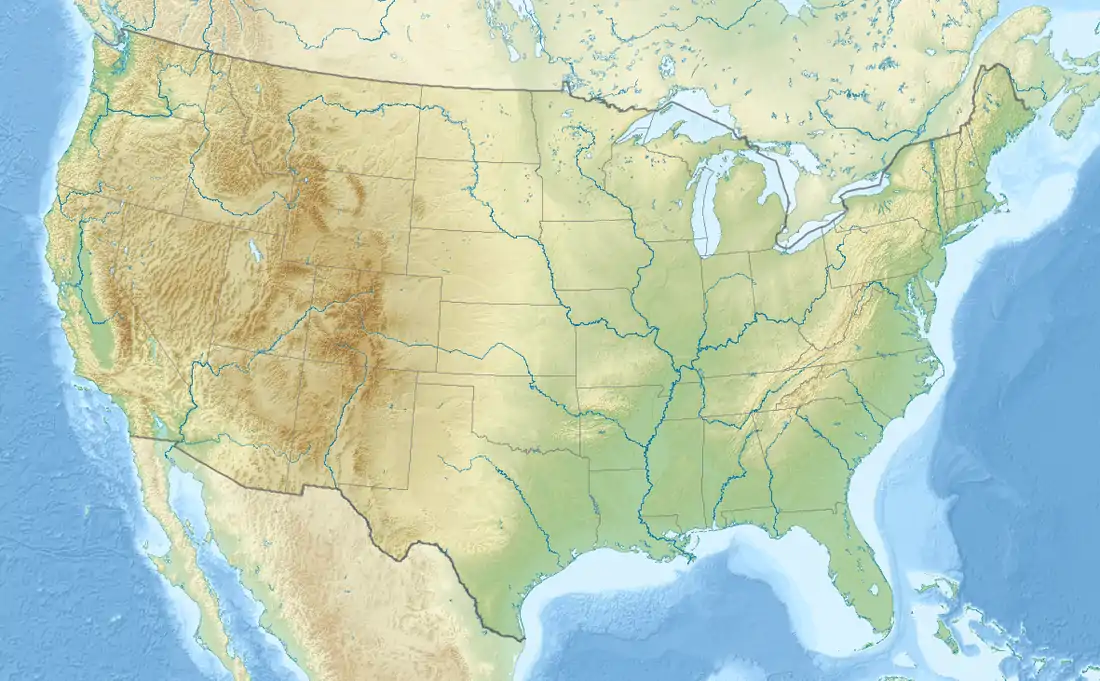
 City of Westmorland Location in the United States | |
| Coordinates: 33°02′14″N 115°37′17″W[1] | |
| Country | |
| State | |
| County | Imperial |
| Incorporated | June 30, 1934[2] |
| Government | |
| • Mayor | Ana Beltran[3] |
| Area | |
| • Total | 0.59 sq mi (1.53 km2) |
| • Land | 0.59 sq mi (1.53 km2) |
| • Water | 0.00 sq mi (0.00 km2) 0% |
| Elevation | −164 ft (−50 m) |
| Population (2010) | |
| • Total | 2,225 |
| • Estimate (2019)[5] | 2,254 |
| • Density | 3,820.34/sq mi (1,474.85/km2) |
| Time zone | UTC-8 (Pacific (PST)) |
| • Summer (DST) | UTC-7 (PDT) |
| ZIP code | 92281 |
| Area codes | 442/760 |
| FIPS code | 06-84606 |
| GNIS feature IDs | 1652812, 2412239 |
| Website | www |
Westmorland is on State Route 86, which was upgraded to a new six-lane highway to reduce its infamous auto accident and fatality risk, while it connects with Brawley, El Centro and Mexicali, Baja California, Mexico.
The post office, originally called Westmoreland, opened in 1909; it closed in 1912 and re-opened in 1919. It was renamed to Westmorland in 1936.[6] Westmorland incorporated in 1934.[6]
From the 1920s through the 1950s Westmorland was the site of illegal gaming establishments and many brothels, but these were later destroyed in an attempt to improve the town's image.
Westmorland has dealt with the image of high poverty rates, and prior to the 1990s North American Free Trade Agreement (NAFTA) economic boom, a nearly dormant farm food shipping industry.
Geography
According to the United States Census Bureau, the city has a total area of 0.4 square miles (1.0 km2), all land.
Westmorland is below sea level and sits behind a number of active faults. Seismic activity has been recorded several times during the 20th century, with tremors occurring in 1907, 1916, 1925, 1940, 1948, 1965, and 1979. The 1987 Superstition Hills event caused serious damage in Westmorland and the Imperial Valley.
Demographics
| Historical population | |||
|---|---|---|---|
| Census | Pop. | %± | |
| 1940 | 1,010 | — | |
| 1950 | 1,213 | 20.1% | |
| 1960 | 1,404 | 15.7% | |
| 1970 | 1,175 | −16.3% | |
| 1980 | 1,590 | 35.3% | |
| 1990 | 1,380 | −13.2% | |
| 2000 | 2,131 | 54.4% | |
| 2010 | 2,225 | 4.4% | |
| 2019 (est.) | 2,254 | [5] | 1.3% |
| U.S. Decennial Census[7] | |||
2010
At the 2010 census Westmorland had a population of 2,225. The population density was 3,769.7 people per square mile (1,455.5/km2). The racial makeup of Westmorland was 1,038 (46.7%) White, 21 (0.9%) African American, 38 (1.7%) Native American, 11 (0.5%) Asian, 0 (0.0%) Pacific Islander, 1,042 (46.8%) from other races, and 75 (3.4%) from two or more races. Hispanic or Latino of any race were 1,938 persons (87.1%).[8]
The whole population lived in households, no one lived in non-institutionalized group quarters and no one was institutionalized.
There were 631 households, 336 (53.2%) had children under the age of 18 living in them, 299 (47.4%) were opposite-sex married couples living together, 174 (27.6%) had a female householder with no husband present, 61 (9.7%) had a male householder with no wife present. There were 61 (9.7%) unmarried opposite-sex partnerships, and 4 (0.6%) same-sex married couples or partnerships. 89 households (14.1%) were one person and 42 (6.7%) had someone living alone who was 65 or older. The average household size was 3.53. There were 534 families (84.6% of households); the average family size was 3.82.
The age distribution was 765 people (34.4%) under the age of 18, 234 people (10.5%) aged 18 to 24, 527 people (23.7%) aged 25 to 44, 449 people (20.2%) aged 45 to 64, and 250 people (11.2%) who were 65 or older. The median age was 29.2 years. For every 100 females, there were 87.8 males. For every 100 females age 18 and over, there were 86.9 males.
There were 678 housing units at an average density of 1,148.7 per square mile (443.5/km2),of which 631 were occupied, 299 (47.4%) by the owners and 332 (52.6%) by renters. The homeowner vacancy rate was 1.6%; the rental vacancy rate was 5.9%. 1,066 people (47.9% of the population) lived in owner-occupied housing units and 1,159 people (52.1%) lived in rental housing units.
2000
At the 2000 census there were 2,131 people in 625 households, including 501 families, in the city. The population density was 5,263.6 people per square mile (2,057.0/km2). There were 667 housing units at an average density of 1,647.5 per square mile (643.8/km2). The racial makeup of the city was 55.8% White, 1.0% Black or African American, 0.7% Native American, 0.3% Asian, 0.1% Pacific Islander, 39.4% from other races, and 2.7% from two or more races. 82.2% of the population were Hispanic or Latino of any race.[9] Of the 625 households 47.7% had children under the age of 18 living with them, 56.0% were married couples living together, 19.0% had a female householder with no husband present, and 19.7% were non-families. 17.0% of households were one person and 8.5% were one person aged 65 or older. The average household size was 3.4 and the average family size was 3.9.
The age distribution was 35.8% under the age of 18, 10.5% from 18 to 24, 26.5% from 25 to 44, 17.7% from 45 to 64, and 9.6% 65 or older. The median age was 29 years. For every 100 females, there were 94.4 males. For every 100 females age 18 and over, there were 92.3 males.
The median income for a household in the city was $23,365, and the median family income was $26,667. Males had a median income of $27,500 versus $19,107 for females. The per capita income for the city was $8,941. About 27.3% of families and 27.2% of the population were below the poverty line, including 37.9% of those under age 18 and 14.6% of those age 65 or over.
Politics
In the state legislature, Westmorland is in the 40th Senate District, represented by Democrat Ben Hueso,[10] and the 56th Assembly District, represented by Democrat Eduardo Garcia.[11]
Federally, Westmorland is in California's 51st congressional district, represented by Democrat Juan Vargas.[12]
Schools
Westmorland children (grades K-8) are part of the Westmorland Elementary School District, while high-school age students are members of the neighboring Brawley Union High School District.
Public safety
Westmorland has one of the smallest police departments in California, with a chief and five full-time officers with only five patrol cars. The Imperial County Fire Department provides fire and paramedic services.
References
- "Westmorland". Geographic Names Information System. United States Geological Survey.
- "California Cities by Incorporation Date" (Word). California Association of Local Agency Formation Commissions. Retrieved April 8, 2013.
- "City of Westmorland - Council". cityofwestmorland.net. Retrieved January 4, 2020.
- "2019 U.S. Gazetteer Files". United States Census Bureau. Retrieved July 1, 2020.
- "Population and Housing Unit Estimates". United States Census Bureau. May 24, 2020. Retrieved May 27, 2020.
- Durham, David L. (1998). California's Geographic Names: A Gazetteer of Historic and Modern Names of the State. Clovis, Calif.: Word Dancer Press. p. 1481. ISBN 1-884995-14-4.
- "Census of Population and Housing". Census.gov. Retrieved June 4, 2015.
- "2010 Census Interactive Population Search: CA - Westmorland city". U.S. Census Bureau. Archived from the original on July 15, 2014. Retrieved July 12, 2014.
- "U.S. Census website". United States Census Bureau. Retrieved 2008-01-31.
- "Senators". State of California. Retrieved April 8, 2013.
- "Members Assembly". State of California. Retrieved April 8, 2013.
- "California's 51st Congressional District - Representatives & District Map". Civic Impulse, LLC. Retrieved April 8, 2013.
