1928 German federal election
Federal elections were held in Germany on 20 May 1928.[1] The Social Democratic Party of Germany (SPD) remained the largest party in the Reichstag after winning 153 of the 491 seats.[2] Voter turnout was 75.6%.[3]
| |||||||||||||||||||||||||||||||||||||||||||||||||||||||||||||||||||||||||||||||||||||
All 491 seats in the Reichstag 246 seats needed for a majority | |||||||||||||||||||||||||||||||||||||||||||||||||||||||||||||||||||||||||||||||||||||
|---|---|---|---|---|---|---|---|---|---|---|---|---|---|---|---|---|---|---|---|---|---|---|---|---|---|---|---|---|---|---|---|---|---|---|---|---|---|---|---|---|---|---|---|---|---|---|---|---|---|---|---|---|---|---|---|---|---|---|---|---|---|---|---|---|---|---|---|---|---|---|---|---|---|---|---|---|---|---|---|---|---|---|---|---|---|
| Registered | 41,224,678 | ||||||||||||||||||||||||||||||||||||||||||||||||||||||||||||||||||||||||||||||||||||
| Turnout | 31,165,789 (75.6%) | ||||||||||||||||||||||||||||||||||||||||||||||||||||||||||||||||||||||||||||||||||||
| |||||||||||||||||||||||||||||||||||||||||||||||||||||||||||||||||||||||||||||||||||||
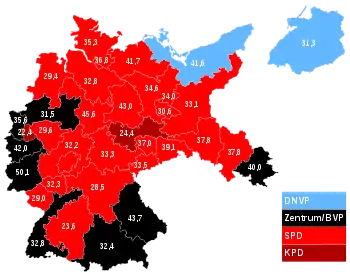 Constituencies coloured according to the party that received the largest share of the vote. | |||||||||||||||||||||||||||||||||||||||||||||||||||||||||||||||||||||||||||||||||||||
| |||||||||||||||||||||||||||||||||||||||||||||||||||||||||||||||||||||||||||||||||||||
.jpg.webp)


The only two parties to gain significantly were the SPD, which received almost a third of the vote, and the Communist Party of Germany (KPD), which completed a thorough victory of the left wing. However, the SPD still failed to win a clear majority, resulting in another coalition government, led by Hermann Müller.[4] Following his appointment as Chancellor, Müller, who had previously held the post for four months in 1920, created a grand coalition of members of the SPD, the German Democratic Party, the Centre Party and the German People's Party. However, the coalition was plagued by internal divisions right from the beginning, with each party more concerned with their own interests than the interests of the government. As a result, Müller asked German President Paul von Hindenburg for emergency powers, but when Hindenburg refused, he resigned, marking the end of the "last genuinely democratic government of the Weimar Republic" on 27 March 1930.[5]
The recently reformed Nazi Party contested the elections after the ban on the party had been lifted in 1925. However, the party received less than 3% of the vote and won only 12 seats in the Reichstag. Adolf Hitler, who had been incarcerated in Landsberg prison for his involvement in the Beer Hall Putsch until Christmas 1924,[6] had concentrated on re-establishing himself as the leader of the Nazi Party after his release rather than on his party's electability.
Results
 | ||||
|---|---|---|---|---|
| Party | Votes | % | Seats | +/– |
| Social Democratic Party | 9,152,979 | 29.8 | 153 | +22 |
| German National People's Party | 4,381,563 | 14.2 | 73 | −30 |
| Centre Party | 3,712,152 | 12.1 | 61 | −8 |
| Communist Party of Germany | 3,264,793 | 10.6 | 54 | +9 |
| German People's Party | 2,679,703 | 8.7 | 45 | −6 |
| German Democratic Party | 1,479,374 | 4.8 | 25 | −7 |
| Reich Party of the German Middle Class | 1,387,602 | 4.5 | 23 | +11 |
| Bavarian People's Party | 945,644 | 3.1 | 17 | −2 |
| National Socialist German Workers' Party | 810,127 | 2.6 | 12 | −2 |
| Christian-National Peasants' and Farmers' Party | 571,891 | 1.9 | 9 | New |
| Reich Party for Civil Rights and Deflation | 509,471 | 1.7 | 2 | New |
| German Farmers' Party | 481,254 | 1.6 | 8 | New |
| Patriotic-National Bloc | 266,370 | 0.9 | 0 | New |
| Agricultural League | 199,548 | 0.7 | 3 | −5 |
| German-Hanoverian Party | 195,555 | 0.6 | 4 | 0 |
| Saxon Peasants | 127,700 | 0.4 | 2 | New |
| Christian Social Reich Party | 110,704 | 0.4 | 0 | New |
| Left Communists | 80,405 | 0.3 | 0 | New |
| Old Social Democratic Party of Germany | 65,775 | 0.2 | 0 | New |
| Polish People's Party | 64,753 | 0.2 | 0 | 0 |
| Evangelical Party of Germany | 52,488 | 0.2 | 0 | New |
| German Social Party | 46,047 | 0.2 | 0 | 0 |
| General People's Party | 37,373 | 0.1 | 0 | New |
| German House and Property Owners' Party | 35,846 | 0.1 | 0 | New |
| Independent Social Democratic Party | 20,815 | 0.1 | 0 | 0 |
| Evangelical Community Spirit | 10,709 | 0.0 | 0 | New |
| Christian National Middle Class Party | 9,957 | 0.0 | 0 | New |
| Pastor Greber Party | 9,527 | 0.0 | 0 | New |
| Revaluation and Construction Party | 8,562 | 0.0 | 0 | New |
| German Reich Bloc of the Injured | 7,437 | 0.0 | 0 | New |
| Reich Party for Crafts, Trade and Business | 6,614 | 0.0 | 0 | New |
| People's Welfare Party | 6,071 | 0.0 | 0 | New |
| Franconian Peasants | 3,417 | 0.0 | 0 | New |
| Wendish People's Party | 3,111 | 0.0 | 0 | 0 |
| Party for Justice and Tenant Protection | 2,831 | 0.0 | 0 | New |
| Schleswig Club | 2,435 | 0.0 | 0 | 0 |
| German Christian Folk Party | 901 | 0.0 | 0 | New |
| Vital Interests of the Unmarried | 873 | 0.0 | 0 | New |
| Masurian People's Party | 295 | 0.0 | 0 | New |
| Lithuanian People's Party | 289 | 0.0 | 0 | New |
| Friesland | 286 | 0.0 | 0 | New |
| Invalid/blank votes | 412,542 | – | – | – |
| Total | 31,165,789 | 100 | 491 | –2 |
| Registered voters/turnout | 41,224,678 | 75.6 | – | – |
| Source: Gonschior.de | ||||
References
- Dieter Nohlen & Philip Stöver (2010) Elections in Europe: A data handbook, p762 ISBN 978-3-8329-5609-7
- Nohlen & Stöver, p790
- Nohlen & Stöver, p777
- Evans, D. & Jenkins, J. (1999), Years of Weimar & the Third Reich, London: Hodder & Stoughton Educational, p. 83, ISBN 0-340-70474-8.
- Evans & Jenkins 1999, p. 88.
- Broszat, M. (1987), Hitler and the Collapse of Weimar Germany, Oxford: Berg Publishers, p. 9, ISBN 0-85496-509-2.
| Parliamentary elections | |
|---|---|
| Presidential elections | |
| European elections | |
| Referendums | |
| |