2014 European Parliament election in Germany
The European Parliament election, 2014 was held on 25 May 2014 in Germany. Under the Lisbon Treaty, Germany lost three seats and elected 96 members of the European Parliament, instead of the previous 99.
| |||||||||||||||||||||||||||||||||||||||||||||||||||||||||||||||||||||||||||||
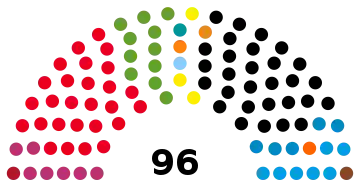
All 96 German seats to the European Parliament | |||||||||||||||||||||||||||||||||||||||||||||||||||||||||||||||||||||||||||||
|---|---|---|---|---|---|---|---|---|---|---|---|---|---|---|---|---|---|---|---|---|---|---|---|---|---|---|---|---|---|---|---|---|---|---|---|---|---|---|---|---|---|---|---|---|---|---|---|---|---|---|---|---|---|---|---|---|---|---|---|---|---|---|---|---|---|---|---|---|---|---|---|---|---|---|---|---|---|
| Turnout | 48.1%[1] | ||||||||||||||||||||||||||||||||||||||||||||||||||||||||||||||||||||||||||||
| |||||||||||||||||||||||||||||||||||||||||||||||||||||||||||||||||||||||||||||


.png.webp)
.jpg.webp)
.jpg.webp)

Electoral threshold
The previous electoral threshold of 5% was ruled unconstitutional in 2011, leading the major parties to implement a 3% threshold instead. However the Constitutional Court ruled on 26 February 2014 that this threshold was illegal as well.[2] Under this circumstances a vote share of 0.6% proved sufficient to win an EP seat (result of Die PARTEI) and seven parties won single seats; the seats were allocated according to the Webster/Sainte-Laguë method.
Opinion polling compared with actual result
| Date | Polling Firm | CDU/CSU | SPD | Green | FDP | Left | AfD | Others | |
|---|---|---|---|---|---|---|---|---|---|
| 22 May 2014 | FGW | 37.5 | 26.5 | 10 | 3.5 | 7.5 | 7 | 8 | |
| 16 May 2014 | FGW | 38 | 27 | 11 | 3 | 8 | 6 | 7 | |
| 14 May 2014 | Infratest dimap | 37 | 27 | 9 | 3 | 9 | 7 | 8 | |
| 13 May 2014 | YouGov | 39 | 25 | 10 | 4 | 9 | 6 | 7 | |
| 9 May 2014 | Forschungsgruppe Wahlen | 38 | 27 | 12 | 3 | 8 | 6 | 6 | |
| 30 April 2014 | infratest dimap | 39 | 27 | 9 | 4 | 8 | 6 | 7 | |
| 25 April 2014 | INSA | 36 | 28 | 11 | 4 | 9 | 7 | 5 | |
| 11 April 2014 | Forschungsgruppe Wahlen | 39 | 27 | 11 | 3 | 8 | 6 | 6 | |
| 3 April 2014 | infratest dimap | 40 | 28 | 9 | 3 | 7 | 6 | 7 | |
| 28 March 2014 | Forschungsgruppe Wahlen | 39 | 26 | 12 | 3 | 8 | 6 | 6 | |
| 14 March 2014 | Forschungsgruppe Wahlen | 38 | 26 | 11 | 4 | 8 | 6 | 7 | |
| 9 March 2014 | INSA | 38 | 26 | 9.5 | 3 | 8.5 | 7.5 | – | |
| 6 March 2014 | Infratest | 40 | 26 | 11 | 4 | 7 | 5 | 7 | |
| 21 February 2014 | Forschungsgruppe Wahlen | 40 | 24 | 12 | 4 | 8 | 6 | 6 | |
| 14 February 2014 | INSA | 39 | 25 | 10 | 3 | 10 | 8 | 5 | |
| 6 February 2014 | Infratest | 38 | 29 | 10 | 4 | 8 | 6 | 5 | |
| 26 January 2014 | Emnid | 42 | 26 | 10 | 3 | 8 | 7 | 4 | |
| 2014 | |||||||||
| 25 May 2014 (prelimitary results 401 of 402 districts) | Election Results | 30.0 + 5.4 | 27.3 | 10.7 | 3.4 | 7.4 | 7.1 | ||
| 2014 | |||||||||
| 7 June 2009 | Election Results | 37.9 | 20.8 | 12.1 | 11.0 | 7.5 | N/A | 9.8 | |
Results
| ← 2009 • 2014 • 2019 → | |||||||||
 | |||||||||
| National party | European party | Main candidate | Votes | % | +/– | Seats | +/– | ||
|---|---|---|---|---|---|---|---|---|---|
| Christian Democratic Union (CDU) + Christian Social Union (CSU) | EPP | 10,374,758 | 35.36 | 34 / 96 |
8 | ||||
| Christian Democratic Union (CDU) | EPP | David McAllister | 8,807,500 | 30.02 | 0.7 |
29 / 96 |
5 | ||
| Social Democratic Party (SPD) | PES | Martin Schulz | 7,999,955 | 27.27 | 6.5 |
27 / 96 |
4 | ||
| Alliance '90/The Greens (B'90/GRÜNEN) | EGP | Rebecca Harms | 3,138,201 | 10.70 | 1.4 |
11 / 96 |
3 | ||
| The Left (LINKE) | PEL | Gabi Zimmer | 2,167,641 | 7.39 | 0.1 |
7 / 96 |
1 | ||
| Alternative for Germany (AfD) | None | Bernd Lucke | 2,065,162 | 7.04 | 7.0 |
7 / 96 |
7 | ||
| Christian Social Union of Bavaria (CSU) | EPP | Markus Ferber | 1,567,258 | 5.34 | 1.9 |
5 / 96 |
3 | ||
| Free Democratic Party (FDP) | ALDE | Alexander Graf Lambsdorff | 986,253 | 3.36 | 7.6 |
3 / 96 |
9 | ||
| Free Voters (Freie Wähler) | EDP* | Ulrike Müller | 428,524 | 1.46 | 0.2 |
1 / 96 |
1 | ||
| Pirate Party (Piraten) | None† | Julia Reda | 424,510 | 1.45 | 0.5 |
1 / 96 |
1 | ||
| Human Environment Animal Protection (Tierschutzpartei) | None | Stefan Eck | 366,303 | 1.25 | 0.1 |
1 / 96 |
1 | ||
| National Democratic Party of Germany (NPD) | ENF | Udo Voigt | 300,815 | 1.03 | 1.0 |
1 / 96 |
1 | ||
| Family Party of Germany (Familie) | None | Arne Gericke | 202,871 | 0.69 | 0.3 |
1 / 96 |
1 | ||
| Ecological Democratic Party (ödp) | None | Klaus Buchner | 185,119 | 0.64 | 0.1 |
1 / 96 |
1 | ||
| Die PARTEI (PARTEI) | None | Martin Sonneborn | 184,525 | 0.63 | 0.6 |
1 / 96 |
1 | ||
| Others (parties and candidates that won less than 0.6% of the vote and no seats) | 516,063 | 1.76 | — | 0 / 96 |
0 | ||||
| Valid votes | 29,340,700 | 98.34 | |||||||
| Blank and invalid votes | 496,216 | 1.66 | |||||||
| Totals | 29,836,916 | 100.00 | — | 96 / 96 |
0 | ||||
| Electorate (eligible voters) and voter turnout | 62,004,092 | 48.12 | 4.85 |
||||||
| Source: German government *individual candidates | |||||||||
References
| Parliamentary elections | |
|---|---|
| Presidential elections | |
| European elections | |
| Referendums | |
| |
This article is issued from Wikipedia. The text is licensed under Creative Commons - Attribution - Sharealike. Additional terms may apply for the media files.