1881 German federal election
Federal elections were held in Germany on 27 October 1881.[1] The Centre Party became the largest party in the Reichstag, with 100 of the 397 seats, whilst the National Liberal Party, which had previously been the largest party, was reduced to 47 seats.[2] Voter turnout was 56.3%.[3]
| |||||||||||||||||||||||||||||||||||||||||||||||||||||||||||||||||||||||||||||||||||||
All 397 seats in the Reichstag 199 seats needed for a majority | |||||||||||||||||||||||||||||||||||||||||||||||||||||||||||||||||||||||||||||||||||||
|---|---|---|---|---|---|---|---|---|---|---|---|---|---|---|---|---|---|---|---|---|---|---|---|---|---|---|---|---|---|---|---|---|---|---|---|---|---|---|---|---|---|---|---|---|---|---|---|---|---|---|---|---|---|---|---|---|---|---|---|---|---|---|---|---|---|---|---|---|---|---|---|---|---|---|---|---|---|---|---|---|---|---|---|---|---|
| Turnout | 56.3% | ||||||||||||||||||||||||||||||||||||||||||||||||||||||||||||||||||||||||||||||||||||
| |||||||||||||||||||||||||||||||||||||||||||||||||||||||||||||||||||||||||||||||||||||
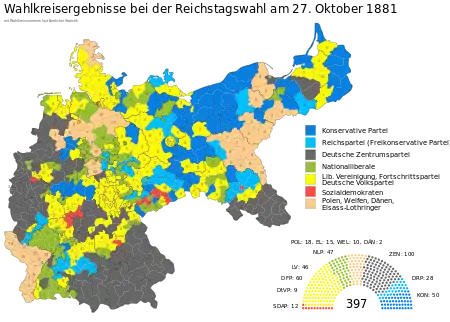 Map of results (by constituencies) | |||||||||||||||||||||||||||||||||||||||||||||||||||||||||||||||||||||||||||||||||||||
| |||||||||||||||||||||||||||||||||||||||||||||||||||||||||||||||||||||||||||||||||||||
.jpg.webp)
_b_093_(cropped).jpg.webp)
_b_132_(cropped).jpg.webp)

 |
|---|
| This article is part of a series on the politics and government of Germany |
|
|
Results
 1874 German Parliament | ||||
| Party | Votes[a] | % | Seats | +/– |
|---|---|---|---|---|
| Centre Party | 1,182,900 | 23.2 | 100 | +6 |
| German Conservative Party | 830,800 | 16.3 | 50 | −9 |
| National Liberal Party | 746,600 | 14.6 | 47 | −52 |
| German Progress Party | 649,300 | 12.7 | 60 | +34 |
| Liberal Union | 429,200 | 8.4 | 46 | +36 |
| German Reich Party | 379,300 | 7.4 | 28 | −29 |
| Socialists | 312,000 | 6.1 | 12 | +3 |
| Polish Party | 194,900 | 3.8 | 18 | +4 |
| Alsace-Lorraine Party | 153,000 | 3.0 | 15 | 0 |
| German People's Party | 103,400 | 2.0 | 9 | +6 |
| German-Hanoverian Party | 86,700 | 1.7 | 10 | 0 |
| Danish Party | 14,000 | 0.3 | 2 | +1 |
| Others | 15,300 | 0.3 | 0 | 0 |
| Invalid/blank votes | 20,600 | – | – | – |
| Total | 5,118,400 | 100 | 397 | 0 |
| Registered voters/turnout | 9,088,800 | 56.3 | – | – |
| Source: Nohlen & Stöver, DGDB | ||||
a Figures for votes are rounded.[1]
References
- Dieter Nohlen & Philip Stöver (2010) Elections in Europe: A data handbook, p762 ISBN 978-3-8329-5609-7
- Nohlen & Stöver, p789
- Nohlen & Stöver, p773
| Parliamentary elections | |
|---|---|
| Presidential elections | |
| European elections | |
| Referendums | |
| |
This article is issued from Wikipedia. The text is licensed under Creative Commons - Attribution - Sharealike. Additional terms may apply for the media files.