1998 Dutch general election
General elections were held in the Netherlands on 6 May 1998.[1]
| |||||||||||||||||||||||||||||||||||||||||||||||||||
All 150 seats in the House of Representatives 76 seats needed for a majority | |||||||||||||||||||||||||||||||||||||||||||||||||||
|---|---|---|---|---|---|---|---|---|---|---|---|---|---|---|---|---|---|---|---|---|---|---|---|---|---|---|---|---|---|---|---|---|---|---|---|---|---|---|---|---|---|---|---|---|---|---|---|---|---|---|---|
| Turnout | 73.4% | ||||||||||||||||||||||||||||||||||||||||||||||||||
This lists parties that won seats. See the complete results below. | |||||||||||||||||||||||||||||||||||||||||||||||||||
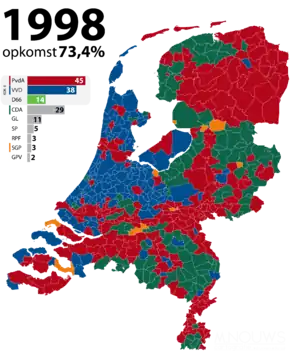 Strongest political party by municipality | |||||||||||||||||||||||||||||||||||||||||||||||||||
| |||||||||||||||||||||||||||||||||||||||||||||||||||

Introduction
During the 1998 election the purple coalition of social-democrats and liberals (left and right) fortified its majority. Both the social-democratic PvdA and the conservative liberal VVD won considerably, much at the cost of their junior partner in cabinet, the progressive liberal D66.
Political observers attributed the win to the economic performance of the coalition, including reduction of unemployment and the budget deficit, steady growth and job creation combined with wage freezes and trimming of the welfare state, together with a policy of fiscal restraint.[2]
The two small left opposition parties, the green GroenLinks, and the socialist SP, were rewarded for their 'quality opposition'. The major opposition party, CDA, uncomfortable in its opposition role, also lost seats. The two parties for the elderly AOV and Unie 55+ and the rightwing populist CD did not return to parliament.
The formation resulted in the continuation of the Kok cabinet, with the second Kok cabinet (PvdA, VVD & D66).
Results
| Party | Votes | % | Seats | +/– | |
|---|---|---|---|---|---|
| Labour Party | 2,494,555 | 28.98 | 45 | +8 | |
| People's Party for Freedom and Democracy | 2,124,971 | 24.69 | 38 | +7 | |
| Christian Democratic Appeal | 1,581,053 | 18.37 | 29 | –5 | |
| Democrats 66 | 773,497 | 8.99 | 14 | –10 | |
| GroenLinks | 625,968 | 7.27 | 11 | +6 | |
| Socialist Party | 303,703 | 3.53 | 5 | +3 | |
| Reformatory Political Federation | 174,593 | 2.03 | 3 | 0 | |
| Reformed Political Party | 153,583 | 1.78 | 3 | +1 | |
| Reformed Political League | 108,724 | 1.26 | 2 | 0 | |
| Centre Democrats | 52,226 | 0.61 | 0 | –3 | |
| General Elderly Alliance–Union 55+ | 45,994 | 0.53 | 0 | –7 | |
| Mobile Netherlands | 45,219 | 0.53 | 0 | New | |
| Seniors 2000 | 36,157 | 0.42 | 0 | New | |
| New Middle Party | 23,512 | 0.27 | 0 | New | |
| The Greens | 16,585 | 0.19 | 0 | 0 | |
| Natural Law Party | 15,746 | 0.18 | 0 | 0 | |
| Catholic Political Party | 8,233 | 0.10 | 0 | New | |
| Progressive Integration Party | 7,225 | 0.08 | 0 | 0 | |
| New Solidarity Elderly Union | 6,455 | 0.07 | 0 | New | |
| New Communist Party of the Netherlands | 5,620 | 0.07 | 0 | 0 | |
| Idealists/Jij | 2,500 | 0.03 | 0 | New | |
| The Voters Collective | 1,668 | 0.02 | 0 | New | |
| Total | 8,607,787 | 100.00 | 150 | 0 | |
| Valid votes | 8,607,787 | 99.83 | |||
| Invalid/blank votes | 14,435 | 0.17 | |||
| Total votes | 8,622,222 | 100.00 | |||
| Registered voters/turnout | 11,755,132 | 73.35 | |||
| Source: Nohlen & Stöver, European Elections Database | |||||
References
- Dieter Nohlen & Philip Stöver (2010) Elections in Europe: A data handbook, p1396 ISBN 978-3-8329-5609-7
- Netherlands: Elections held in 1998 Inter-Parliamentary Union
Further reading
- Aarts, Kees; Semetko, Holli A. (1999). "Representation and responsibility: the 1998 Dutch election in perspective". Acta Politica. Palgrave Macmillan. 34 (2): 111–129.CS1 maint: ref=harv (link)
- Irwin, Galen A. (1999). "The Dutch parliamentary election of 1998". Electoral Studies. 18 (2): 271–276. doi:10.1016/S0261-3794(98)00048-1.CS1 maint: ref=harv (link)
- Irwin, Galen A.; van Holsteyn, Joop J. M. (1999). "Parties and politicians in the parliamentary election of 1998". Acta Politica. Palgrave Macmillan. 34 (2): 130–157.CS1 maint: ref=harv (link)
| General |
|
|---|---|
| Provincial | |
| Municipal | |
| Water board |
|
| Electoral college | |
| Island council | |
| European | |
| Referendums | |
| |