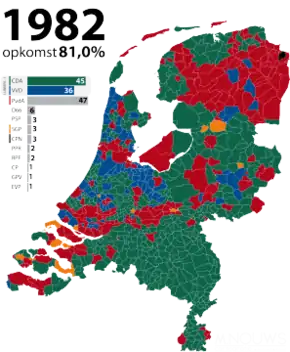
1982 Dutch general election
Early general elections were held in the Netherlands on 8 September 1982.[1] The Labour Party emerged as the largest party, winning 47 of the 150 seats in the House of Representatives;[2] however, this would be the last time it did so until 1994.
| ||||||||||||||||||||||||||||||||||||||||||||||||||||||||||||||||||
| Turnout | 81.0% | |||||||||||||||||||||||||||||||||||||||||||||||||||||||||||||||||
|---|---|---|---|---|---|---|---|---|---|---|---|---|---|---|---|---|---|---|---|---|---|---|---|---|---|---|---|---|---|---|---|---|---|---|---|---|---|---|---|---|---|---|---|---|---|---|---|---|---|---|---|---|---|---|---|---|---|---|---|---|---|---|---|---|---|---|
This lists parties that won seats. See the complete results below. | ||||||||||||||||||||||||||||||||||||||||||||||||||||||||||||||||||
 | ||||||||||||||||||||||||||||||||||||||||||||||||||||||||||||||||||


Following the election the Christian Democratic Appeal (CDA) formed a coalition government with the People's Party for Freedom and Democracy, with the CDA's Ruud Lubbers becoming Prime Minister.
Results
| Party | Votes | % | Seats | +/– | |
|---|---|---|---|---|---|
| Labour Party | 2,503,517 | 30.40 | 47 | +3 | |
| Christian Democratic Appeal | 2,420,441 | 29.39 | 45 | –3 | |
| People's Party for Freedom and Democracy | 1,900,763 | 23.08 | 36 | +10 | |
| Democrats 66 | 351,278 | 4.26 | 6 | –11 | |
| Pacifist Socialist Party | 187,547 | 2.28 | 3 | 0 | |
| Reformed Political Party | 156,636 | 1.90 | 3 | 0 | |
| Communist Party of the Netherlands | 147,753 | 1.79 | 3 | 0 | |
| Political Party of Radicals | 136,446 | 1.66 | 2 | –1 | |
| Reformatory Political Federation | 124,235 | 1.51 | 2 | 0 | |
| Centre Party | 68,423 | 0.83 | 1 | +1 | |
| Reformed Political League | 67,163 | 0.82 | 1 | 0 | |
| Evangelical People's Party | 56,466 | 0.69 | 1 | +1 | |
| Socialist Party | 44,959 | 0.55 | 0 | 0 | |
| Democratic Socialists '70 | 31,047 | 0.38 | 0 | 0 | |
| Right-wing People's Party | 21,987 | 0.27 | 0 | 0 | |
| Roman Catholic Party of the Netherlands | 12,689 | 0.15 | 0 | 0 | |
| God with Us | 3,157 | 0.04 | 0 | 0 | |
| Dutch Peoples-Union | 1,632 | 0.02 | 0 | 0 | |
| Progressive Party for the Preservation of Work, Environment and Society | 250 | 0.00 | 0 | New | |
| Small Party | 127 | 0.00 | 0 | 0 | |
| Total | 8,236,516 | 100.00 | 150 | 0 | |
| Valid votes | 8,236,516 | 99.55 | |||
| Invalid/blank votes | 37,115 | 0.45 | |||
| Total votes | 8,273,631 | 100.00 | |||
| Registered voters/turnout | 10,216,627 | 80.98 | |||
| Source: Kiesraad | |||||
References
- Dieter Nohlen & Philip Stöver (2010) Elections in Europe: A data handbook, p1396 ISBN 978-3-8329-5609-7
- Nohlen & Stöver, p1414
| General |
|
|---|---|
| Provincial | |
| Municipal | |
| Water board |
|
| Electoral college | |
| Island council | |
| European | |
| Referendums | |
| |
This article is issued from Wikipedia. The text is licensed under Creative Commons - Attribution - Sharealike. Additional terms may apply for the media files.