1986 Dutch general election
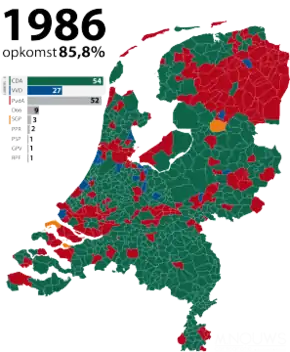
General elections were held in the Netherlands on 21 May 1986.[1] The Christian Democratic Appeal (CDA) emerged as the largest party, winning 54 of the 150 seats in the House of Representatives.[2]
| |||||||||||||||||||||||||||||||||||||||||||||||||||
| Turnout | 85.8% | ||||||||||||||||||||||||||||||||||||||||||||||||||
|---|---|---|---|---|---|---|---|---|---|---|---|---|---|---|---|---|---|---|---|---|---|---|---|---|---|---|---|---|---|---|---|---|---|---|---|---|---|---|---|---|---|---|---|---|---|---|---|---|---|---|---|
This lists parties that won seats. See the complete results below. | |||||||||||||||||||||||||||||||||||||||||||||||||||
 | |||||||||||||||||||||||||||||||||||||||||||||||||||

The incumbent CDA-VVD coalition maintained exactly the same number of seats as they had achieved at the last general election and continued working together in government with the CDA's Ruud Lubbers as Prime Minister.
Results
| Party | Votes | % | Seats | +/– | |
|---|---|---|---|---|---|
| Christian Democratic Appeal | 3,172,918 | 34.59 | 54 | +9 | |
| Labour Party | 3,051,678 | 33.27 | 52 | +5 | |
| People's Party for Freedom and Democracy | 1,596,991 | 17.41 | 27 | –9 | |
| Democrats 66 | 562,466 | 6.13 | 9 | +3 | |
| Reformed Political Party | 159,740 | 1.74 | 3 | 0 | |
| Political Party of Radicals | 115,203 | 1.26 | 2 | 0 | |
| Pacifist Socialist Party | 110,182 | 1.20 | 1 | –2 | |
| Reformed Political League | 88,381 | 0.96 | 1 | 0 | |
| Reformatory Political Federation | 83,582 | 0.91 | 1 | –1 | |
| Communist Party of the Netherlands | 57,847 | 0.63 | 0 | –3 | |
| Centre Party | 36,741 | 0.40 | 0 | –1 | |
| Socialist Party | 32,144 | 0.35 | 0 | 0 | |
| Evangelical People's Party | 21,998 | 0.24 | 0 | –1 | |
| Federation of Greens | 18,641 | 0.20 | 0 | New | |
| Party for the Middle Groups | 15,297 | 0.17 | 0 | New | |
| Loesje | 12,882 | 0.14 | 0 | New | |
| Centre Democrats | 12,277 | 0.13 | 0 | New | |
| League of Communists in the Netherlands | 4,618 | 0.05 | 0 | New | |
| Partij voor Ambtenaren & Trendvolgers | 4,500 | 0.05 | 0 | New | |
| Anti Revolutionaries '85 | 3,664 | 0.04 | 0 | New | |
| Socialist Workers' Party | 3,634 | 0.04 | 0 | New | |
| God with Us | 2,375 | 0.03 | 0 | 0 | |
| General Interest Party | 2,128 | 0.02 | 0 | New | |
| Luck for Everyone Party | 1,184 | 0.01 | 0 | New | |
| Wissink List | 560 | 0.01 | 0 | New | |
| Humanist Party | 463 | 0.01 | 0 | New | |
| Brummer List | 65 | 0.00 | 0 | New | |
| Total | 9,172,159 | 100.00 | 150 | 0 | |
| Valid votes | 9,172,159 | 99.70 | |||
| Invalid/blank votes | 27,462 | 0.30 | |||
| Total votes | 9,199,621 | 100.00 | |||
| Registered voters/turnout | 10,727,701 | 85.76 | |||
| Source: Kiesraad | |||||
References
- Dieter Nohlen & Philip Stöver (2010) Elections in Europe: A data handbook, p1396 ISBN 978-3-8329-5609-7
- Nohlen & Stöver, p1414
Further reading
- Gladdish, Ken. "The Centre Holds: the 1986 Netherlands Election," West European Politics (1987). 10#1 pp. 115–119
| General |
|
|---|---|
| Provincial | |
| Municipal | |
| Water board |
|
| Electoral college | |
| Island council | |
| European | |
| Referendums | |
| |
This article is issued from Wikipedia. The text is licensed under Creative Commons - Attribution - Sharealike. Additional terms may apply for the media files.