1998 Philippine general election
Presidential elections, legislative and local elections were held in the Philippines on May 11, 1998. In the presidential election, Vice President Joseph Estrada won a six-year term as President by a landslide victory. In the vice-presidential race, Senator Gloria Macapagal-Arroyo won a six-year term as Vice President also by a landslide victory. This was the third election where both president and vice president came from different parties.
 |
|---|
| This article is part of a series on the politics and government of the Philippines |
|
|
Results
For president
| Candidate | Party | Votes | % | |
|---|---|---|---|---|
| Joseph Estrada | Laban ng Makabayang Masang Pilipino | 10,722,295 | 39.86 | |
| Jose de Venecia Jr. | Lakas-NUCD-UMDP | 4,268,483 | 15.87 | |
| Raul Roco | Aksyon Demokratiko | 3,720,212 | 13.83 | |
| Emilio Osmeña | Probinsya Muna Development Initiative | 3,347,631 | 12.44 | |
| Alfredo Lim | Liberal Party | 2,344,362 | 8.71 | |
| Renato de Villa | Partido para sa Demokratikong Reporma | 1,308,352 | 4.86 | |
| Miriam Defensor Santiago | People's Reform Party | 797,206 | 2.96 | |
| Juan Ponce Enrile | Independent | 343,139 | 1.28 | |
| Santiago Dumlao | Kilusan para sa Pambansang Pagpapanibago | 32,212 | 0.12 | |
| Manuel Morato | Partido Bansang Marangal | 18,644 | 0.07 | |
| Total | 26,902,536 | 100.00 | ||
| Valid votes | 26,902,536 | 91.86 | ||
| Invalid/blank votes | 2,383,239 | 8.14 | ||
| Total votes | 29,285,775 | 100.00 | ||
| Registered voters/turnout | 33,873,665 | 86.46 | ||
For vice-president
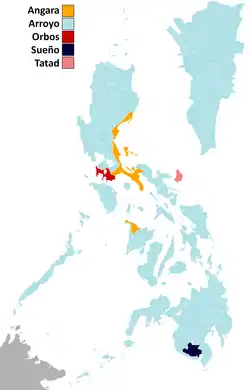
Vice presidential election per province/city.
| Candidate | Party | Votes | % | |
|---|---|---|---|---|
| Gloria Macapagal Arroyo | Lakas-NUCD-UMDP | 12,667,252 | 49.56 | |
| Edgardo Angara | Laban ng Makabayang Masang Pilipino | 5,652,068 | 22.11 | |
| Oscar Orbos | Partido para sa Demokratikong Reporma | 3,321,779 | 13.00 | |
| Serge Osmeña | Liberal Party | 2,351,462 | 9.20 | |
| Francisco Tatad | People's Reform Party | 745,389 | 2.92 | |
| Ismael Sueno | Probinsya Muna Development Initiative | 537,667 | 2.10 | |
| Irene Santiago | Aksyon Demokratiko | 240,210 | 0.94 | |
| Camilo Sabio | Partido Bansang Marangal | 22,010 | 0.09 | |
| Reynaldo Pacheco | Kilusan para sa Pambansang Pagpapanibago | 21,422 | 0.08 | |
| Total | 25,559,259 | 100.00 | ||
| Valid votes | 25,559,259 | 87.28 | ||
| Invalid/blank votes | 3,726,506 | 12.72 | ||
| Total votes | 29,285,765 | 100.00 | ||
| Registered voters/turnout | 33,873,665 | 86.46 | ||
For senator
| Rank | Candidate | Coalition[1] | Party | Votes | % | |
|---|---|---|---|---|---|---|
| 1. | Loren Legarda | Lakas | Lakas | 14,933,965 | 51.0% | |
| 2. | Renato Cayetano | Lakas | Lakas | 13,177,584 | 45.0% | |
| 3. | Tito Sotto | LAMMP | LDP | 11,520,678 | 39.3% | |
| 4. | Aquilino Pimentel Jr. | LAMMP | PDP–Laban | 10,227,765 | 34.9% | |
| 5. | Robert Barbers | Lakas | Lakas | 9,768,045 | 33.4% | |
| 6. | Rodolfo Biazon | LAMMP | LDP | 9,352,964 | 31.9% | |
| 7. | Blas Ople | LAMMP | LDP | 9,278,448 | 31.7% | |
| 8. | John Henry Osmeña | LAMMP | NPC | 9,242,652 | 31.6% | |
| 9. | Robert Jaworski | LAMMP | PMP | 8,968,616 | 30.6% | |
| 10. | Ramon Revilla Sr. | Lakas | Lakas | 8,683,500 | 29.7% | |
| 11. | Teofisto Guingona Jr. | Lakas | Lakas | 7,325,343 | 25.0% | |
| 12. | Teresa Aquino-Oreta | LAMMP | LDP | 7,238,086 | 24.7% | |
| 13. | Roberto Pagdanganan | Lakas | Lakas | 6,938,178 | 23.7% | |
| 14. | Rubén D. Torres | LAMMP | Independent | 6,923,821 | 23.6% | |
| 15. | Edcel Lagman | LAMMP | LDP | 6,831,441 | 23.3% | |
| 16. | Santanina Rasul | Lakas | Lakas | 6,695,955 | 22.9% | |
| 17. | Rolando Andaya | Lakas | Lakas | 5,722,871 | 19.5% | |
| 18. | Roberto F. de Ocampo | Lakas | Lakas | 5,663,401 | 19.3% | |
| 19. | Lisandro Abadia | Lakas | Lakas | 5,426,378 | 18.5% | |
| 20. | Haydee Yorac | Reporma-LM | 4,618,565 | 15.8% | ||
| 21. | Ricardo Gloria | Lakas | Lakas | 4,589,190 | 15.7% | |
| 22. | Ramon Bagatsing Jr. | LAMMP | LDP | 4,540,475 | 15.5% | |
| 23. | Freddie Webb | LAMMP | LDP | 4,514,475 | 15.4% | |
| 24. | Hernando Perez | Lakas | Lakas | 4,336,969 | 14.8% | |
| 25. | Rey Langit | Reporma-LM | 3,930,085 | 13.4% | ||
| 26. | Raul Daza | Liberal | 2,995,851 | 10.2% | ||
| 27. | Miguel Luis Romero | LAMMP | LDP | 2,781,973 | 9.5% | |
| 28. | Charito Plaza | Liberal | 2,433,272 | 8.3% | ||
| 29. | Roy Señeres | Reporma-LM | 1,165,455 | 4.0% | ||
| 30. | Gerry Geronimo | Reporma-LM | 871,518 | 3.0% | ||
| 31. | Hadja Putri Zorayda Tamano | Reporma-LM | 855,738 | 2.9% | ||
| 32. | Roberto Sebastian | Reporma-LM | 721,824 | 2.5% | ||
| 33. | Jose Villegas | Reporma-LM | 608,186 | 2.1% | ||
| 34. | Renato Garcia | Kilusan para sa Pambansang Pagpapanibago | 554,818 | 1.9% | ||
| 35. | David Castro | Kilusan para sa Pambansang Pagpapanibago | 436,779 | 1.5% | ||
| 36. | Ludovico Badoy | Kilusan para sa Pambansang Pagpapanibago | 388,465 | 1.3% | ||
| 37. | Oliver Lozano | Independent | 352,037 | 1.2% | ||
| 38. | Abraham Iribani | Reporma-LM | 319,410 | 1.1% | ||
| 39. | Eduardo Bondoc | Kilusan para sa Pambansang Pagpapanibago | 202,217 | 0.7% | ||
| 40. | Fred Henry Marallag | Kilusan para sa Pambansang Pagpapanibago | 106,496 | 0.4% | ||
| Total turnout | 29,285,775 | 86.5% | ||||
| Total votes | 206,248,556 | N/A | ||||
| Registered voters | 205,243,489 | 100.0% | ||||
| Note: A total of 40 candidates ran for senator. | ||||||
Per party
| Party/coalition | Votes | % | Seats won | % | |
|---|---|---|---|---|---|
| Lakas || 93,261,379 || 45.4% || 5 || 41.7% | |||||
| LDP || 56,058,540 || 27.3% || 4 || 33.3% | |||||
| Reporma-LM || 13,090,781 || 6.4% || 0 || 0.0% | |||||
| PDP–Laban || 10,227,765 || 5.0% || 1 || 8.3% | |||||
| NPC || 9,242,652 || 4.5% || 1 || 8.3% | |||||
| PMP || 8,968,616 || 4.4% || 1 || 8.3% | |||||
| Independents || 7,275,858 || 3.5% || 0 || 0.0% | |||||
| Liberal || 5,429,123 || 2.6% || 0 || 0.0% | |||||
| Kilusan para sa Pambansang Pagpapanibago | 1,688,775 | 0.8% | 0 | 0.0% | |
| Totals | 205,243,489 | 100.0% | 12 | 100.0% | |
District elections
| Party | Popular vote | Seats won | ||||||
|---|---|---|---|---|---|---|---|---|
| Total | % | Swing | Total | % | +/− | |||
| Lakas (People Power–National Union of Christian Democrats–United Muslim Democrats of the Philippines) | 11,981,024 | 49.01% | 111 | 53.88% | ||||
| KAMPI (Partner of the Free Filipino) | 47,273 | 0.19% | 0 | 0.00% | ||||
| Lakas-NUCD-UMDP coalition | 12,028,297 | 49.20% | 111 | 53.88% | ||||
| LAMMPA (Struggle of the Patriotic Filipino Masses) | 6,520,744 | 26.68% | 55 | 26.70% | ||||
| NPC (Nationalist People's Coalition) | 998,239 | 4.08% | 9 | 4.37% | ||||
| PMP (Party of the Filipino Masses) | 2,010 | 0.01% | 0 | 0.00% | ||||
| LAMMP coalition | 7,520,993 | 30.77% | 64 | 31.07% | ||||
| Liberal (Liberal Party) | 1,773,124 | 7.25% | 15 | 7.28% | ||||
| Reporma-LMB (Party for Democratic Reforms–Workers' Party) | 966,653 | 3.95% | 4 | 1.94% | ||||
| Lapiang Manggagawa (Workers' Party) | 8,792 | 0.04% | 0 | 0.00% | ||||
| Reporma-LM coalition | 975,445 | 3.99% | Δ 3.45% | 4 | 1.94% | Δ 4 | ||
| PROMDI (Provinces First Development Initiative) | 586,954 | 2.40% | 4 | 1.94% | ||||
| PDP–Laban (Philippine Democratic Party–People's Power) | 134,331 | 0.55% | 0 | 0.00% | ||||
| Aksyon (Democratic Action) | 106,843 | 0.44% | 1 | 0.49% | ||||
| Ompia (Reform Party) | 46,462 | 0.19% | 1 | 0.49% | ||||
| PRP (People's Reform Party) | 38,640 | 0.16% | 0 | 0.00% | ||||
| KBL (New Society Movement) | 35,522 | 0.15% | 0 | 0.00% | ||||
| PDSP (Philippine Democratic Socialist Party) | 8,850 | 0.04% | 0 | 0.00% | ||||
| Nacionalista (Nationalist Party) | 4,412 | 0.02% | 0 | 0.00% | ||||
| Kilusan para sa Pambansang Pagpapabago (National Renewal Movement) | 1,310 | 0.01% | 0 | 0.00% | ||||
| Unaffiliated | 348,281 | 1.42% | 4 | 1.94% | ||||
| Independent | 834,934 | 3.42% | 2 | 0.97% | ||||
| Total | 24,444,398 | 100% | 206 | 100% | ||||
| Valid votes | 24,444,398 | 83.47% | ||||||
| Invalid votes | 4,841,377 | 16.53% | ||||||
| Total turnout | 29,285,775 | 86.46% | ||||||
| Registered voters | 33,873,665 | 100% | ||||||
| Notes:
A. ^ Laban ng Makabayang Masang Pilipino was the PMP/LDP/NPC coalition. | ||||||||
| Sources: Dieter Nohlen; Florian Grotz; Christof Hartmann; Graham Hassall; Soliman M. Santos. Elections in Asia and the Pacific: A Data Handbook: Volume II: South East Asia, East Asia, and the South Pacific. | ||||||||
Party-list election
| Party | Popular vote | Seats won | |
|---|---|---|---|
| Total | % | ||
| APEC | 503,487 | 5.50% | 2 |
| ABA | 321,646 | 3.51% | 1 |
| Alagad | 312,500 | 3.41% | 1 |
| VFP | 304,902 | 3.33% | 1 |
| PROMDI | 255,184 | 2.79% | 1 |
| AKO | 239,042 | 2.61% | 1 |
| SCFO | 238,303 | 2.60% | 1 |
| Abanse! Pinay | 235,548 | 2.57% | 1 |
| Akbayan | 232,376 | 2.54% | 1 |
| Butil | 215,643 | 2.36% | 1 |
| Sanlakas | 194,617 | 2.13% | 1 |
| Coop-NATCCO | 189,802 | 2.07% | 1 |
| COCOFED | 186,388 | 2.04% | 1 |
| Others | 5,725,871 | 62.54% | 0 |
| Total | 9,155,309 | 100% | 14 |
| Valid votes | 9,155,309 | 31.26% | |
| Invalid votes | 20,130,466 | 68.74% | |
| Total turnout | 29,285,775 | 86.46% | |
| Registered voters | 33,873,665 | 100% | |
| Sources: Supreme Court (October 6, 2000). "G.R. No. 136781". & Nohlen; Grotz; Hartmann; Hassall; Santos. Elections in Asia and the Pacific: Vol II: South East Asia. | |||
See also
External links
- The Philippine Presidency Project
- Official website of the Commission on Elections
- Official website of the House of Representatives
| General elections | |
|---|---|
| Presidential elections | |
| Senate elections | |
| House elections | |
| Local elections | |
| Constitutional Conventions | |
| Referendums | |
See also: Local elections and plebiscites in the Philippines | |
- "Senatorial Race in the Philippines: SWS Feb 98, Mar 98, Apr 98, May 98 National Surveys". Social Weather Station. Retrieved March 26, 2019.
This article is issued from Wikipedia. The text is licensed under Creative Commons - Attribution - Sharealike. Additional terms may apply for the media files.