2001 Atlantic hurricane season
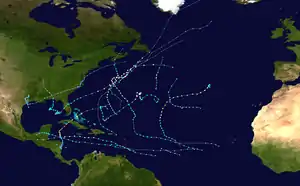
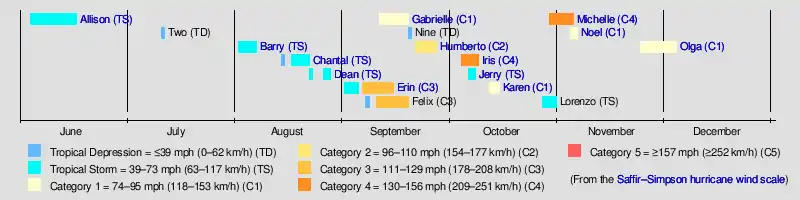
The 2001 Atlantic hurricane season was a fairly active Atlantic hurricane season that produced 17 tropical cyclones, 15 named storms, nine hurricanes, and four major hurricanes. The season officially lasted from June 1, 2001, to November 30, 2001, dates which by convention limit the period of each year when tropical cyclones tend to form in the Atlantic Ocean basin. The season began with Tropical Storm Allison on June 4, and ended with Hurricane Olga, which dissipated on December 6. The most intense storm was Hurricane Iris, which attained Category 4 strength on the Saffir–Simpson Hurricane Scale.
| 2001 Atlantic hurricane season | |
|---|---|
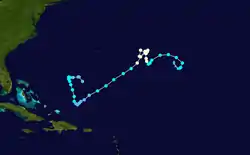
 Season summary map | |
| Seasonal boundaries | |
| First system formed | June 4, 2001 |
| Last system dissipated | December 4, 2001 |
| Strongest storm | |
| Name | Michelle[nb 1] |
| • Maximum winds | 140 mph (220 km/h) (1-minute sustained) |
| • Lowest pressure | 933 mbar (hPa; 27.55 inHg) |
| Seasonal statistics | |
| Total depressions | 17 |
| Total storms | 15 |
| Hurricanes | 9 |
| Major hurricanes (Cat. 3+) | 4 |
| Total fatalities | 153 total |
| Total damage | $11.94 billion (2001 USD) |
| Related articles | |
The most damaging storms of the season were Tropical Storm Allison, which caused extensive flooding in Texas, Hurricane Iris, which struck Belize, and Hurricane Michelle, which affected several countries. Three tropical cyclones made landfall on the United States, three directly affected Canada, and three directly affected Mexico and Central America. Overall, the season caused 153 fatalities, and $11.44 billion (2001 USD) in damage. Due to their severe damage, the names Allison, Iris, and Michelle were retired by the World Meteorological Organization.
Seasonal forecasts
| Source | Date | Named storms |
Hurricanes | Major hurricanes |
| CSU | Average (1950–2000)[1] | 9.6 | 5.9 | 2.3 |
| NOAA | Average (1950–2005)[2] | 11.0 | 6.2 | 2.7 |
| Record high activity | 30 | 15 | 7 | |
| Record low activity | 4 | 2 | 0 | |
| –––––––––––––––––––––––––––––––––––––––––– | ||||
| CSU | December 7, 2000[1] | 9 | 5 | 2 |
| CSU | April 5, 2001[3] | 12 | 7 | 3 |
| NOAA | May 21, 2001[4] | 8–11 | 5–7 | 2–3 |
| CSU | August 7, 2001[5] | 12 | 7 | 3 |
| NOAA | August 8, 2001[6] | 9–12 | 6–8 | 2–4 |
| –––––––––––––––––––––––––––––––––––––––––– | ||||
| Actual activity | 15 | 9 | 4 | |
Forecasts of hurricane activity are issued before each hurricane season by noted hurricane experts Philip J. Klotzbach, William M. Gray, and their associates at Colorado State University; and separately by NOAA forecasters.
Klotzbach's team (formerly led by Gray) defined the average number of storms per season (1950 to 2000) as 9.6 tropical storms, 5.9 hurricanes, 2.3 major hurricanes (storms reaching at least Category 3 strength in the Saffir-Simpson Hurricane Scale) and ACE Index 96.1.[7] NOAA defines a season as above-normal, near-normal or below-normal by a combination of the number of named storms, the number reaching hurricane strength, the number reaching major hurricane strength and ACE Index.[8]
Pre-season forecasts
On December 7, 2000, Gray's team issued its first extended-range forecast for the 2001 season, predicting above-average activity (13 named storms, 8 hurricanes, and about 4 of Category 3 or higher). It listed a 63 percent chance of at least one major hurricane striking the U.S. mainland. This included a 43 percent chance of at least one major hurricane strike on the East Coast, including the Florida peninsula, and a 36 percent chance of at least one such strike on the Gulf Coast from the Florida Panhandle westward. The potential for major hurricane activity in the Caribbean was forecast to near average.[1]
On April 5, 2001, a new forecast was issued, calling for 12 named storms, 7 hurricanes, and 3 major hurricanes. The increase in the forecast was attributed to the warm sea surface temperatures, although the agency noted that the season would likely not be as active as previous ones due to the effect of a weak to moderate El Nino. The estimated potential for at least one major hurricane to affect the U.S. was upped slightly to 65 percent; the East Coast potential also went up slightly, and from the Florida Panhandle westward to Brownsville, Texas, the probability remained nearly the same.[3]
Mid-season forecasts
On August 7, 2001, Gray's team issued their first mid-season forecast for the 2001 season, keeping the forecast number at 12 named storms, with 7 becoming hurricanes and 3 becoming a major hurricane, noting that sea surface temperatures and sea level pressures continued to be favorable for above-average hurricane activity. The estimated potential for at least one major hurricane to affect the U.S. was upped slightly once again to 69 percent; the East Coast potential also went up slightly to 50%, and from the Florida Panhandle westward to Brownsville, Texas, the probability was also upped slightly.[5]
On August 8, 2001, NOAA revised its season estimate slightly upwards to nine to twelve named storms, of which 6 to 8 were to be hurricanes, and 2 to 4 major hurricanes. The agency noted that sea surface temperatures continued to be favorable for above-average hurricane activity, and due to the likelihood that El Nino would not develop during the peak of the season, there was a reduced likelihood of a below-average year.[6]
Season summary
The season's activity was reflected with an accumulated cyclone energy (ACE) rating of 110.[9] ACE is, broadly speaking, a measure of the power of the hurricane multiplied by the length of time it existed, so storms that last a long time, as well as particularly strong hurricanes, have high ACEs. ACE is only calculated for full advisories on tropical systems at or exceeding 34 knots (39 mph, 63 km/h) or tropical storm strength. Subtropical cyclones, including the latter portion of Allison and the initial portions of Karen, Noel, and Olga, are excluded from the total.[10]
Systems
Tropical Storm Allison
| Tropical storm (SSHWS) | |
  | |
| Duration | June 4 – June 17 |
|---|---|
| Peak intensity | 60 mph (95 km/h) (1-min) 1000 mbar (hPa) |
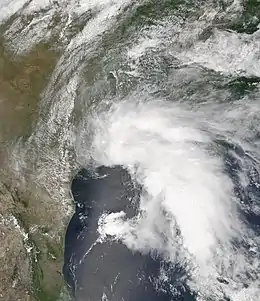
Tropical Storm Allison developed from a tropical wave in the northern Gulf of Mexico on June 4, 2001, and struck the northern Texas coast shortly thereafter. It drifted northward through the state, turned to the south, and re-entered the Gulf of Mexico. The storm continued towards the east-northeast, made landfall on Louisiana and then moved across the southeast United States and Mid-Atlantic.[11] Allison was the first storm since Tropical Storm Frances in 1998 to affect the northern Texas coastline.[12]
The storm was a major flood disaster throughout its path from Texas to the Mid-Atlantic. The worst of the flooding occurred in Houston, Texas, where over 35 in (890 mm) of rain fell when Allison stalled over southeastern Texas. The storm killed 41 people, including 27 who drowned. The storm also caused $8.5 billion in damage (2001 USD), making it the costliest and second-deadliest tropical storm on record in the United States.[11][13] Allison destroyed 2,744 homes, leaving 30,000 homeless, with residential damages totaling to $1.76 billion (2001 USD).[14]
Tropical Depression Two
| Tropical depression (SSHWS) | |
  | |
| Duration | July 11 – July 12 |
|---|---|
| Peak intensity | 30 mph (45 km/h) (1-min) 1010 mbar (hPa) |
A tropical depression formed from a low level circulation on July 11, well to the east of the Windward Islands. It attained a maximum strength of 30 mph (45 km/h), with a pressure of 1,010 mbar (30 inHg), though vertical wind shear from a subtropical ridge to the north caused it to dissipate on July 12.[15]
Tropical Storm Barry
| Tropical storm (SSHWS) | |
.jpg.webp) 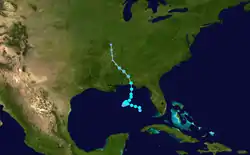 | |
| Duration | August 2 – August 7 |
|---|---|
| Peak intensity | 70 mph (110 km/h) (1-min) 990 mbar (hPa) |
On July 24, a tropical wave moved off the coast of Africa and tracked westward. The wave entered the Caribbean on July 29 and gained in organization and convection, and organized into Tropical Storm Barry on August 3. After fluctuations in intensity, the system attained peak winds of 70 mph (110 km/h) in the Gulf of Mexico, and headed northward before moving ashore along the Gulf Coast.[16]
The storm affected Florida; rainfall peaked at 8.9 in (230 mm) at Tallahassee, and winds gusts topped out at 79 mph (127 km/h).[16] Three people in Florida were killed by the storm, and total damage is estimated at around $30 million (2001 USD).[17]
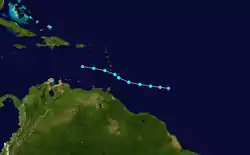
Tropical Storm Chantal
| Tropical storm (SSHWS) | |
  | |
| Duration | August 14 – August 22 |
|---|---|
| Peak intensity | 70 mph (110 km/h) (1-min) 997 mbar (hPa) |
Tropical Storm Chantal developed from a tropical wave on August 14 in the tropical Atlantic Ocean. It tracked rapidly westward for much of its duration, and after degenerating into a tropical wave it passed through the Windward Islands. Chantal reformed and reached a peak intensity of 70 mph (110 km/h) twice in the Caribbean Sea, and each time, wind shear and later land interaction prevented strengthening to hurricane status. On August 21 Chantal moved ashore near the border of Mexico and Belize, and it dissipated the next day.[18]
The storm produced a wind gust of 71 mph (115 km/h) in Caye Caulker, although stronger winds were possible in a convective band to the north.[18] On the Yucatan Peninsula, heavy rainfall led to mudslides across Quintana Roo, leaving some areas isolated.[19]
Tropical Storm Dean
| Tropical storm (SSHWS) | |
  | |
| Duration | August 22 – August 28 |
|---|---|
| Peak intensity | 70 mph (110 km/h) (1-min) 994 mbar (hPa) |
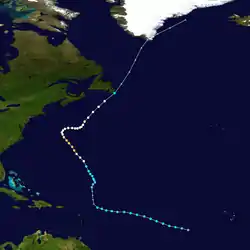
A tropical wave spawned Tropical Storm Dean on August 22 over the Lesser Antilles. Strong wind shear quickly weakened Dean to cause it to dissipate on August 23. The remnants turned northward, and redeveloped on August 26 to the north of Bermuda. Located over warm waters and in an area of favorable conditions, Dean steadily strengthened while moving to the northeast, and peaked just below hurricane status on August 27 southwest of Newfoundland. The storm subsequently weakened over cooler waters, and became extratropical on August 28.[20] Tropical Storm Dean lightly affected Newfoundland, though no damages were reported.[20]
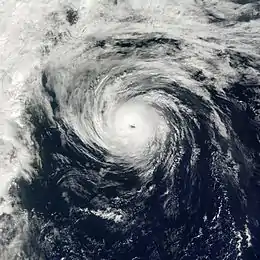
Hurricane Erin
| Category 3 hurricane (SSHWS) | |
  | |
| Duration | September 1 – September 15 |
|---|---|
| Peak intensity | 120 mph (195 km/h) (1-min) 968 mbar (hPa) |
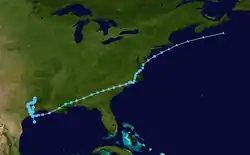
Hurricane Erin developed from a tropical wave on September 1, and strengthened to a 60 mph (95 km/h) tropical storm as it moved to the west-northwest. After weakening due to wind shear, the remnants re-organized into a tropical depression the next day, and Erin strengthened into a hurricane on September 9 while moving northwestward. The hurricane quickly intensified and reached peak winds of 120 mph (195 km/h) later on September 9. A trough turned Erin to the northeast, and after passing just east of Cape Race, Newfoundland it became extratropical on September 15. The extratropical remnant continued northeastward and lost its identity near Greenland on September 17.[21] Hurricane Erin brushed Newfoundland, producing a sustained wind of 53 mph (85 km/h) with a gust of 67 mph (108 km/h) at Cape Race.[21] Along the coast, the passage of the storm led to wave heights of up to 30 ft (9.3 m).[22]
Hurricane Felix
| Category 3 hurricane (SSHWS) | |
  | |
| Duration | September 7 – September 19 |
|---|---|
| Peak intensity | 115 mph (185 km/h) (1-min) 962 mbar (hPa) |
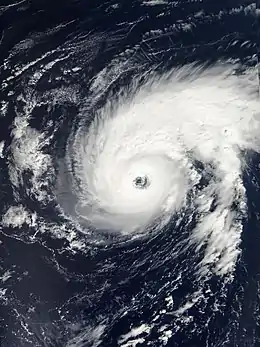
A tropical wave spawned a tropical depression on September 7 near the Cape Verde islands, which degenerated back into a tropical wave the next day due to strong shear. It redeveloped back into a tropical depression on September 10, and intensified into Tropical Storm Felix the next day while tracking generally northward. By September 13, it intensified into a hurricane, and subsequently it underwent rapid deepening, becoming a major hurricane on September 14 with peak winds of 115 mph (185 km/h). By that time, Felix had turned to the northeast, and subsequently entered an area of unfavorable conditions. The hurricane gradually weakened, deteriorating to a tropical storm on September 17. Cool waters and higher wind shear caused additional weakening while Felix nearly stalled to the southwest of the Azores. Late on September 18, the storm weakened to a tropical depression, and early the next day Felix dissipated.[23]
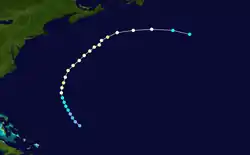
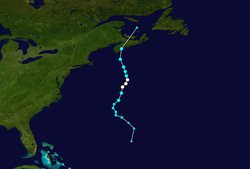
Hurricane Gabrielle
| Category 1 hurricane (SSHWS) | |
  | |
| Duration | September 11 – September 19 |
|---|---|
| Peak intensity | 80 mph (130 km/h) (1-min) 975 mbar (hPa) |
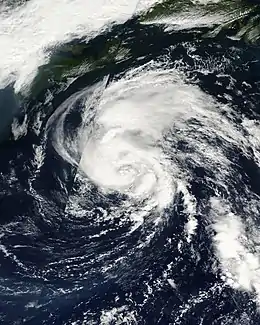
Hurricane Gabrielle originated in a weak low- to mid-level trough that was nearly stationary a short distance off the southeastern coastline of the United States. A cut off low formed over Florida on September 9, and an associated surface low pressure system formed, that was soon designated Tropical Depression Eight. The storm gradually intensified, and made landfall on Florida before emerging into the Atlantic Ocean and accelerating northeastward, as it reached peak intensity as a minimal hurricane.[24]
Hurricane Gabrielle produced moderate winds along coastal areas of western Florida, reaching 58 mph (93 km/h) at Venice.[24] The tide flooded the northern shoreline of Charlotte Harbor and at the entrance to the Peace River, while further to the south a surge of greater than 3 ft (0.91 m) inundated the barrier island at Fort Myers Beach and flooded some cars.[25] Gabrielle brushed the eastern coast of Newfoundland; the rainfall set the all time six-hour precipitation record at St. John's, with a total of 3.54 in (90 mm).[26] Hundreds of homes and buildings were damaged by the passage of Gabrielle, totaling several million Canadian dollars in damage.[27]
Tropical Depression Nine
| Tropical depression (SSHWS) | |
  | |
| Duration | September 19 – September 20 |
|---|---|
| Peak intensity | 35 mph (55 km/h) (1-min) 1005 mbar (hPa) |
A tropical depression formed from a tropical wave in the Caribbean on September 19, north-northwest of San Andres Island. It attained a maximum strength of 35 mph (56 km/h), and made landfall near Puerto Cabezas on September 20. After losing its closed circulation over land, it reformed into Hurricane Juliette in the East Pacific.[28]
In El Salvador, heavy rains from the depression helped alleviate drought conditions; however, flooding also inundated 200 homes in San Salvador along the Acelhuate River.[29] Fifteen farms were inundated by flooding, five of which were destroyed. Seventy people evacuated to shelters set up after the storm by the local Red Cross and armed forces. Military crews were quickly deployed to help clean up the damages on September 22.[30]
Hurricane Humberto
| Category 2 hurricane (SSHWS) | |
  | |
| Duration | September 21 – September 27 |
|---|---|
| Peak intensity | 105 mph (165 km/h) (1-min) 970 mbar (hPa) |
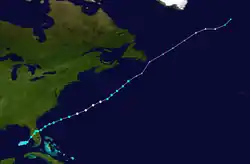
Hurricane Humberto formed from an area of low pressure generated by Hurricane Gabrielle. The low formed into a tropical depression on September 21 while south of Bermuda, tracking northwest, and was named Tropical Storm Humberto the next day. It began moving north, and then northeast as it passed Bermuda and strengthened into a hurricane. Humberto headed over the colder waters of the far north Atlantic Ocean, and dissipated quickly on September 27.[31]
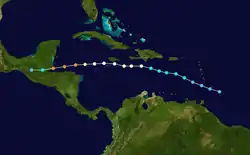
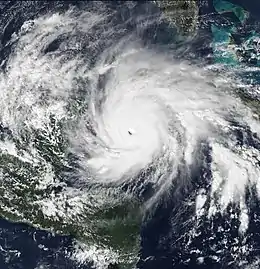
Hurricane Iris
| Category 4 hurricane (SSHWS) | |
  | |
| Duration | October 4 – October 9 |
|---|---|
| Peak intensity | 145 mph (230 km/h) (1-min) 948 mbar (hPa) |
Tropical Depression Eleven formed just southeast of Barbados on October 4. It traveled across the Windward Islands, and was named Tropical Storm Iris while south of Puerto Rico on October 5. Iris continued to the west and intensified. After passing just south of Jamaica, Iris reached Category 4 hurricane strength, and made landfall near Monkey River Town, Belize on October 9 at Category 4 strength, but weakened rapidly. It dissipated later that day.[32]
The storm produced an 8 to 15 ft (2.4 to 4.6 m) storm surge. Numerous homes were destroyed, and the banana crop suffered extensive damage. An exact death toll is unknown, but 31 are confirmed dead, three in the Dominican Republic, eight in Guatemala, and 20 from the M/V Wave Dancer, a ship that capsized off the Belize coast.[32]
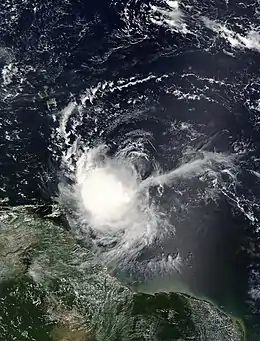
Tropical Storm Jerry
| Tropical storm (SSHWS) | |
  | |
| Duration | October 6 – October 8 |
|---|---|
| Peak intensity | 50 mph (85 km/h) (1-min) 1004 mbar (hPa) |
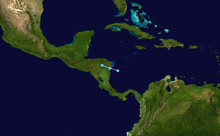
Tropical Storm Jerry formed as a tropical depression from a tropical wave on October 6 near Barbados. The storm intensified into a tropical storm early the following day on October 7 while initially located under an environment of weak vertical wind shear. After reaching its peak of 50 mph (80 km/h), Jerry passed just south of Barbados late on October 7 and through the Windward Islands on October 8. Deterioration in organization occurred, and Jerry dissipated while moving rapidly westward well south of Puerto Rico.[33]
Hurricane Karen
| Category 1 hurricane (SSHWS) | |
  | |
| Duration | October 12 – October 15 |
|---|---|
| Peak intensity | 80 mph (130 km/h) (1-min) 982 mbar (hPa) |
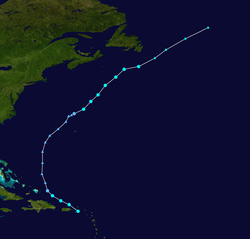
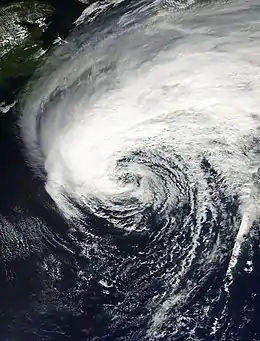
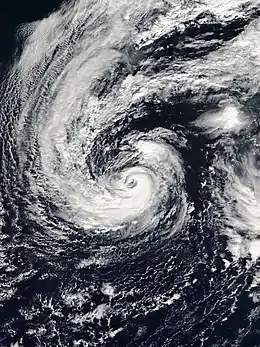
A cold front and an upper level trough interacted on October 10 to the south of Bermuda, and formed an extratropical storm. The storm passed near Bermuda on October 12, producing hurricane-force winds on the island. It then organized, becoming a subtropical cyclone on October 12 and a tropical cyclone on October 13. Karen strengthened to reach 80 mph (130 km/h) winds as a Category 1 hurricane on the Saffir–Simpson Hurricane Scale, and after weakening over cooler waters, it made landfall on Nova Scotia as a tropical storm. It quickly became extratropical.[34]
Tropical Storm Karen produced light to moderate winds across Atlantic Canada, peaking at 47 mph (76 km/h) with a gust of 64 mph (103 km/h) in Cape George in Antigonish County, Nova Scotia, along with a 26 mph (42 km/h) report in Charlottetown, Prince Edward Island.[34] Later, in Newfoundland and Nova Scotia, the storm system that absorbed Hurricane Noel produced strong winds that downed several trees and power lines which resulted in power outages.[35]
Tropical Storm Lorenzo
| Tropical storm (SSHWS) | |
  | |
| Duration | October 27 – October 31 |
|---|---|
| Peak intensity | 40 mph (65 km/h) (1-min) 1007 mbar (hPa) |
An upper-level tropospheric trough persisted in the eastern Atlantic Ocean, developing a circulation by October 26 which quickly organized.[36] On October 27, it developed into Tropical Depression Fourteen about 860 miles (1380 kilometers) south-southwest of the western Azores.[37] Moving westward, the depression was forecast to attain winds of at least 60 mph (95 km/h), although it failed to reach that intensity.[38][39] Banding features developed over the storm, and on October 30 it was upgraded to Tropical Storm Lorenzo.[38] By early on October 31, convection had begun to separate from the circulation,[40][41] and later in the day Lorenzo became extratropical; shortly thereafter, its remnants merged with a frontal system about 690 mi (1,110 km) west of the Azores.[36][42]
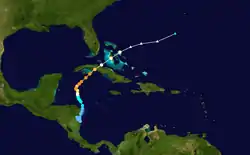
Hurricane Michelle
| Category 4 hurricane (SSHWS) | |
  | |
| Duration | October 29 – November 5 |
|---|---|
| Peak intensity | 140 mph (220 km/h) (1-min) 933 mbar (hPa) |
Hurricane Michelle developed from a tropical wave that moved across the Atlantic, and formed into a tropical depression on October 29. Convection increased, and the system formed into Tropical Storm Michelle on November 1. It strengthened further, reaching its peak strength as a Category 4. One of only four November Category 4 hurricanes, Michelle made landfall on south-central Cuba with winds of 140 mph (225 km/h), the strongest Cuban landfall since Hurricane Fox in the 1952 Atlantic hurricane season.[43]
The system that eventually became Hurricane Michelle dropped torrential rains in several countries, causing six deaths in Honduras and four deaths in Nicaragua, with an extensive yet unknown amount of damage. An additional 26 people were reported missing in Central America.[43] Michelle went on to affect Cuba, where the storm produced 4 to 5 ft (1.2 to 1.5 m) waves, along with a heavy storm surge. Rainfall amounts up to 29.69 in (754 mm) were recorded across the island.[44]
Hurricane Noel
| Category 1 hurricane (SSHWS) | |
  | |
| Duration | November 4 – November 6 |
|---|---|
| Peak intensity | 75 mph (120 km/h) (1-min) 986 mbar (hPa) |
A non-tropical frontal low developed from a cold front on November 1 to the west of the Azores. It intensified while moving west-northwestward and gradually dissipated its frontal structure.[45] It became a subtropical storm on November 4 about 775 nautical miles (1435 km) south of Cape Race, Newfoundland.[46] Operationally, the storm was considered a non-tropical low, and the National Hurricane Center did not begin issuing advisories until it became a tropical cyclone.[46] It moved slowly northward as convection organized into a ring around the center. As a result of a ship reporting hurricane-force winds near the center, and due to the development of a weak mid-level warm core, the subtropical cyclone was reclassified as Hurricane Noel on November 5.[46] Increasing westerly wind shear limited convection near the center, and Noel weakened to a tropical storm early on November 6.[46] Progressively cooler water temperatures contributed to weakening,[47] and Noel became extratropical later on November 6 about 330 mi (530 km) southeast of Newfoundland. The extratropical remnant continued to the northeast and was absorbed by a larger extratropical storm later that day.[46]
Hurricane Olga
| Category 1 hurricane (SSHWS) | |
  | |
| Duration | November 24 – December 4 |
|---|---|
| Peak intensity | 90 mph (150 km/h) (1-min) 973 mbar (hPa) |
Hurricane Olga formed as a subtropical cyclone on November 24 and meandered westward where it reached hurricane status on November 26. The storm attained peak winds of 90 mph (150 km/h) before turning southeastward and weakening back into a tropical storm. Olga dissipated as a tropical cyclone on December 6 east of the Bahamas.[48]
Storm names
The following names were used for named storms that formed in the north Atlantic in 2001. The names not retired from this list were used again in the 2007 season. This is the same list used for the 1995 season except for Lorenzo, Michelle, Olga, and Rebekah, which replaced Luis, Marilyn, Opal, and Roxanne. Storms were named Lorenzo, Michelle, and Olga for the first (and only, in the case of Michelle) time in 2001.[49] Names that were allocated for the 2001 season but were not assigned are marked in gray.
|
Retirement
The World Meteorological Organization retired three names in the spring of 2002: Allison, Iris & Michelle. They were replaced in the 2007 season by Andrea, Ingrid, and Melissa. Allison became the first Atlantic tropical storm to have its name retired.[50]
Season effects
This is a table of all of the storms that have formed in the 2001 Atlantic hurricane season. It includes their duration, names, damages, and death totals. Deaths in parentheses are additional and indirect (an example of an indirect death would be a traffic accident), but were still related to that storm. Damage and deaths include totals while the storm was extratropical, a wave, or a low, and all of the damage figures are in 2001 USD.
| Saffir–Simpson scale | ||||||
| TD | TS | C1 | C2 | C3 | C4 | C5 |
| Storm name |
Dates active | Storm category
at peak intensity |
Max 1-min wind mph (km/h) |
Min. press. (mbar) |
Areas affected | Damage (USD) |
Deaths | Refs | ||
|---|---|---|---|---|---|---|---|---|---|---|
| Allison | June 4 – 18 | Tropical storm | 60 (95) | 1000 | Gulf Coast of the United States, East Coast of the United States, Atlantic Canada | 9 billion | 41 (14) | [13][51] | ||
| Two | July 11 – 12 | Tropical depression | 30 (45) | 1010 | None | None | None | |||
| Barry | August 2 – 7 | Tropical storm | 70 (110) | 990 | Cuba, Florida, Alabama | $30 million | 2 (7) | |||
| Chantal | August 14 – 22 | Tropical storm | 70 (110) | 997 | Windward Islands, Jamaica, Belize, Yucatan Peninsula, Central America | $4 million | 2 | |||
| Dean | August 22 – 28 | Tropical storm | 70 (110) | 994 | Lesser Antilles, Virgin Islands, Puerto Rico, Bahamas, Bermuda, Canada | $7.7 million | None | |||
| Erin | September 1 – 15 | Category 3 hurricane | 115 (185) | 968 | Bermuda, Canada, East Coast of the United States | Minimal | None | |||
| Felix | September 7 – 19 | Category 3 hurricane | 115 (185) | 962 | None | None | None | |||
| Gabrielle | September 11 – 19 | Category 1 hurricane | 80 (130) | 975 | Florida, Newfoundland | > $230 million | 2 (1) | |||
| Nine | September 19 – 20 | Tropical depression | 35 (55) | 1005 | Central America | None | None | |||
| Humberto | September 21 – 27 | Category 2 hurricane | 105 (165) | 970 | Bermuda | None | None | |||
| Iris | October 4 – 9 | Category 4 hurricane | 145 (230) | 948 | Windward Islands, Hispaniola, Jamaica, Honduras, Belize, Guatemala, Eastern Mexico | $250 million | 36 | [51][52] | ||
| Jerry | October 6 – 8 | Tropical storm | 50 (85) | 1004 | Barbados, Windward Islands, Eastern Caribbean Sea | None | None | |||
| Karen | October 12 – 15 | Category 1 hurricane | 80 (130) | 982 | Bermuda, Atlantic Canada | $1.4 million | None | |||
| Lorenzo | October 27 – 31 | Tropical storm | 40 (65) | 1007 | None | None | None | |||
| Michelle | October 29 – November 5 | Category 4 hurricane | 140 (220) | 933 | Jamaica, Costa Rica, Nicaragua, Honduras, Cayman Islands, Cuba, Florida, The Bahamas, Turks and Caicos, Bermuda | $2.43 billion | 48 | [51][53] | ||
| Noel | November 4 – 6 | Category 1 hurricane | 75 (120) | 986 | None | None | None | |||
| Olga | November 24 – December 4 | Category 1 hurricane | 90 (150) | 973 | Bermuda, Bahamas, Cuba, Florida | None | None | |||
| Season aggregates | ||||||||||
| 17 systems | June 4 – December 4 | 145 (230) | 933 | $11.94 billion | 131 (22) | |||||
See also
- Atlantic hurricane season
- List of tropical cyclones
- 2001 Pacific hurricane season
- 2001 Pacific typhoon season
- 2001 North Indian Ocean cyclone season
- South-West Indian Ocean cyclone seasons: 2000–01, 2001–02
- Australian region cyclone seasons: 2000–01, 2001–02
- South Pacific cyclone seasons: 2000–01, 2001–02
Notes
- The "strength" of a tropical cyclone is measured by the minimum barometric pressure, not wind speed. Most meteorological organizations rate the intensity of a storm by this figure, so the lower the minimum pressure of the storm, the more intense or "stronger" it is considered to be. The strongest winds were actually from Iris, at 145 mph (230 km/h).
References
- William M. Gray; et al. (December 7, 2000). "Extended range forecast of Atlantic seasonal hurricane activity and US landfall strike probability for 2001". Colorado State University. Retrieved December 8, 2011.
- Climate Prediction Center (August 8, 2006). "Background Information: The North Atlantic Hurricane Season". National Oceanic and Atmospheric Administration. Archived from the original on August 26, 2010. Retrieved December 8, 2006.
- William M. Gray; et al. (April 6, 2001). "Extended range forecast of Atlantic seasonal hurricane activity and US landfall strike probability for 2001". Colorado State University. Retrieved December 8, 2008.
- "NOAA: 2001 Atlantic Hurricane Season Outlook". National Oceanic and Atmospheric Administration. May 21, 2001. Archived from the original on January 19, 2010. Retrieved December 8, 2001.
- Klotzbach, Philip J.; Gray, William M. (August 7, 2001). "Updated Forecast of Atlantic Seasonal Hurricane Activity and U.S. Landfall Strike Probability for 2001". Colorado State University. Retrieved December 8, 2008.
- "NOAA: 2001 Atlantic Hurricane Season Outlook". National Oceanic and Atmospheric Administration. August 9, 2001. Archived from the original on September 16, 2010. Retrieved December 8, 2008.
- Philip J. Klotzbach; William M. Gray (December 10, 2008). "Extended Range Forecast of Atlantic Seasonal Hurricane Activity and U.S. Landfall Strike Probability for 2009" (PDF). Colorado State University. Archived (PDF) from the original on May 5, 2009. Retrieved January 1, 2009.
- National Hurricane Center (May 22, 2008). "NOAA Atlantic Hurricane Season Classifications". National Oceanic and Atmospheric Administration. Archived from the original on August 15, 2009. Retrieved April 14, 2009.
- Hurricane Research Division (March 2011). "Atlantic basin Comparison of Original and Revised HURDAT". National Oceanic and Atmospheric Administration. Retrieved July 23, 2011.
- David Levinson (August 20, 2008). "2005 Atlantic Ocean Tropical Cyclones". National Climatic Data Center. Retrieved July 23, 2011.
- Stacy R. Stewart (February 8, 2002). "Tropical Storm Allison Tropical Cyclone Report" (PDF). National Hurricane Center. Retrieved September 19, 2008.
- John P. Ivey (2002). "Flood Safety and Tropical Storm Allison" (PDF). Archived (PDF) from the original on May 3, 2006. Retrieved May 15, 2006.
- Costliest U.S. tropical cyclones tables updated (PDF) (Report). Miami, Florida: National Hurricane Center. January 26, 2018. Retrieved February 3, 2018.
- Risk Management Solutions (2001). "Tropical Storm Allison Event Report" (PDF). Archived from the original (PDF) on May 25, 2006. Retrieved May 18, 2006.
- Miles B. Lawrence (July 23, 2001). "Tropical Depression Two Tropical Cyclone Report" (PDF). National Hurricane Center. Retrieved September 19, 2008.
- Jack Beven (April 22, 2002). "Tropical Storm Barry Tropical Cyclone Report" (PDF). National Hurricane Center. Retrieved July 17, 2008.
- National Climatic Data Center. "Tropical Storm Barry Florida Event Report (2)". Archived from the original on May 20, 2011. Retrieved July 18, 2008.
- Franklin, James (September 6, 2001). "Tropical Storm Chantal Tropical Cyclone Report" (PDF). National Hurricane Center. Retrieved May 8, 2008.
- "Rain or Shine...". The London Independent. August 25, 2001.
- Lixion Avila (October 3, 2001). "Tropical Storm Dean Tropical Cyclone Report" (PDF). National Hurricane Center. Retrieved November 7, 2006.
- Richard Pasch; Daniel Brown (January 25, 2002). "Hurricane Erin Tropical Cyclone Report" (PDF). National Hurricane Center. Retrieved November 5, 2006.
- Canadian Hurricane Centre (2001). "2001 Tropical Cyclone Season Summary". Archived from the original on October 2, 2006. Retrieved November 6, 2006.
- Stewart, Stacy (November 30, 2001). "Hurricane Felix Tropical Cyclone Report" (PDF). National Hurricane Center. Retrieved December 18, 2009.
- Miles Lawrence; Eric Blake (April 12, 2002). "Hurricane Gabrielle Tropical Cyclone Report" (PDF). National Hurricane Center. Retrieved February 27, 2007.
- Tampa, Florida National Weather Service (2001). "Report on Tropical Storm Gabrielle". Archived from the original on November 6, 2008. Retrieved March 1, 2007.
- Canadian Hurricane Centre (2001). "Backgrounder: 2001 Canadian Hurricane Season". Archived from the original on February 11, 2007. Retrieved February 27, 2007.
- Staff Writer (September 21, 2001). "Newfoundland seeks federal help for flood damage". CBC News. Retrieved February 27, 2007.
- Jack Beven (October 24, 2001). "Tropical Depression Nine Tropical Cyclone Report" (PDF). National Hurricane Center. Retrieved September 19, 2008.
- "Climate of 2001 - September". National Climatic Data Center. October 17, 2001. Archived from the original on February 24, 2012. Retrieved May 24, 2012.
- Torres, Carlos; Zambrano, Roberto (September 22, 2001). "Inundaciones y derrumbes por clima lluvioso" (in Spanish). El Diario de Hoy. Archived from the original on September 20, 2012. Retrieved May 24, 2012.
- James L. Franklin (October 30, 2001). "Hurricane Humberto Tropical Cyclone Report" (PDF). National Hurricane Center. Retrieved September 19, 2008.
- Lixion A. Avila (October 30, 2001). "Hurricane Iris Tropical Cyclone Report" (PDF). National Hurricane Center. Retrieved September 19, 2008.
- Pasch and Brown (November 30, 2001). "Tropical Storm Jerry Tropical Cyclone Report" (PDF). National Hurricane Center. Retrieved November 18, 2006.
- Stacy R. Stewart (April 17, 2002). "Hurricane Karen Tropical Cyclone Report" (PDF). National Hurricane Center. Retrieved September 27, 2006.
- Canadian Broadcasting Corporation (November 8, 2001). "Thousands without power after storm rips Maritimes". CBC News. Retrieved November 13, 2006.
- Miles B. Lawrence (December 6, 2001). "Tropical Cyclone Report – Tropical Storm Lorenzo" (PDF). National Hurricane Center. Retrieved January 7, 2008.
- Jack Beven (October 27, 2001). "Tropical Depression 14 – Discussion Number 3". National Hurricane Center. Retrieved January 7, 2008.
- Jack Beven (October 30, 2001). "Tropical Storm Lorenzo – Discussion Number 11". National Hurricane Center. Retrieved January 7, 2008.
- Stacy Stewart (October 28, 2001). "Tropical Depression 14 – Discussion Number 5". National Hurricane Center. Retrieved January 8, 2008.
- Jack Beven (October 30, 2001). "Tropical Storm Lorenzo – Discussion Number 13". National Hurricane Center. Retrieved January 8, 2008.
- Jack Beven (October 30, 2001). "Tropical Storm Lorenzo – Discussion Number 14". National Hurricane Center. Retrieved January 7, 2008.
- Richard J. Pasch (October 31, 2001). "Tropical Storm Lorenzo – Discussion Number 16". National Hurricane Center. Retrieved January 8, 2008.
- Jack Beven (January 23, 2002). "Hurricane Michelle Tropical Cyclone Report" (PDF). National Hurricane Center. Retrieved September 19, 2008.
- Instituto Nacional de Recursos Hidráulicos (2003). "Lluvias intensas observadas y grandes inundaciones reportadas" (in Spanish). Archived from the original on March 12, 2007. Retrieved February 10, 2007.
- Padgett, Gary (2001). "November 2001 Tropical Cyclone Summary". Archived from the original on October 26, 2006. Retrieved October 31, 2010.
- Franklin, James (2001). "Hurricane Noel Tropical Cyclone Report" (PDF). National Hurricane Center. Retrieved October 31, 2010.
- Stewart, Stacy (2001). "Hurricane Noel Discussion Four". National Hurricane Center. Retrieved October 31, 2010.
- Lixion A. Avila (December 17, 2001). "Hurricane Olga Tropical Cyclone Report" (PDF). National Hurricane Center. Retrieved September 18, 2008.
- "Worldwide Tropical Cyclone Names". National Hurricane Center. Archived from the original on September 2, 2010. Retrieved September 19, 2008.
- Gary Padgett; Jack Beven; James Lewis Free. "Subject: B3) What names have been retired in the Atlantic and East Pacific basin?". HURDAT. Archived from the original on May 6, 2009. Retrieved September 19, 2008.
- Beven, John L; Stewart, Stacy R; Lawrence, Miles B; Avila, Lixion A; Franklin, James L; Pasch, Richard J (July 1, 2003). "Atlantic Hurricane Season of 2001". Monthly Weather Review. 131 (7): 1454–1484. Bibcode:2003MWRv..131.1454B. CiteSeerX 10.1.1.406.2342. doi:10.1175/1520-0493(2003)131<1454:ASHSO>2.0.CO;2. ISSN 1520-0493.
- "Desastres naturales" (in Spanish). Banco Interamericano de Desarrollo. February 14, 2002. Archived from the original on August 10, 2014. Retrieved December 10, 2012.
- Pielke, Roger A; Rubiera, Jose; Landsea, Christopher W; Fernández, Mario L; Klein, Roberta (August 1, 2003). "Hurricane Vulnerability in Latin America and The Caribbean: Normalized Damage and Loss Potentials" (PDF). Natural Hazards Review. 4 (3): 101–114. doi:10.1061/(ASCE)1527-6988(2003)4:3(101). ISSN 1527-6988. Archived (PDF) from the original on October 21, 2013. Retrieved August 15, 2014.
External links
| Wikimedia Commons has media related to 2001 Atlantic hurricane season. |