Abington Heights School District
The Abington Heights School District is a midsized public school district. It serves the boroughs of Clarks Green and Clarks Summit and the townships of Waverly Township, Glenburn Township, Newton Township, North Abington Township, Ransom Township and South Abington Township in Lackawanna County, Pennsylvania. Abington Heights School District encompasses approximately 69 square miles (180 km2). According to 2000 federal census data, it served a resident population of 29,222 residents. By 2010, the District's population declined to 23,615 people.[10] The educational attainment levels for the School District population (25 years old and over) were 94.7% high school graduates and 47.5% college graduates.[11] The District is one of the 500 public school districts of Pennsylvania and one of twelve public school districts in Lackawanna County.
| Abington Heights School District | |
|---|---|
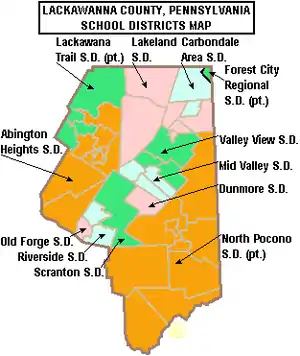 Map of Lackawanna County, Pennsylvania School Districts with Abington Heights School District in orange in eastern Lackawanna County | |
| Address | |
| 200 East Grove Street North-eastern Pennsylvania Clarks Summit , Lackawanna County, Pennsylvania, 18411-1776United States | |
| District information | |
| Type | Public |
| Motto | . |
| Grades | K–12 |
| Superintendent | Dr. Michael Mahon[1] |
| Asst. Superintendent(s) | Grant Mikjinley (2018) |
| Business administrator | Mr James Mirabelli |
| Schools | 6 |
| Budget | 48,998,122 (2017-18)[2] $45.7 million (2014-2015)[3] |
| Students and staff | |
| Enrollment | 3,280 pupils (2016)[5] 3,316 pupils (2013)[6] |
| Teachers | 247 teachers in 2011[8] |
| Staff | 219 non-teaching staff[9] |
| Athletic conference | PIAA District 2 |
| District mascot | Comets |
| Colors | Blue and white |
| Other information | |
| Website | www |
According to the Pennsylvania Budget and Policy Center, 15.5% of the District's pupils lived at 185% or below the Federal Poverty Level[12] as shown by their eligibility for the federal free or reduced price school meal programs in 2012.[13] In 2013, the Pennsylvania Department of Education, reported that fewer than ten students in the Abington Heights School District were homeless.[14]
In 2009, the district residents’ per capita income was $27,768, while the median family income was $64,925.[15] In the Commonwealth, the median family income was $49,501[16] and the United States median family income was $49,445, in 2010.[17] In Lackawanna County, the median household income was $46,044.[18] By 2013, the median household income in the United States rose to $52,100.[19]
Per school district officials, in school year 2007-08 the Abington Heights School District had 3,525 pupils, employing: 265 teachers, 188 full-time and part-time support personnel, and 22 administrators. In 2009–10, the District provided basic educational services to 3,641 pupils. It employed: 271 teachers, 187 full-time and part-time support personnel, and 26 administrators. Abington Heights School District received more than $11.1 million in state funding in school year 2009–10. By 2011, the District enrollment had declined to 3,393 pupils. It employed: 251 teachers, 185 full-time and part-time support personnel, and increased to 24 administrators for the 2011–12 school year. The District received $11.7 million in state funding in the 2011–12 school year.[20]
Abington Heights School District operates: four elementary schools, a middle school, and a high school. The Northeastern Educational Intermediate Unit IU19 provides the District with a wide variety of services like: specialized education for disabled students; state mandated training on recognizing and reporting child abuse; speech and visual disability services; criminal background check processing for prospective employees and professional development for staff and faculty.
The high school was once recognized by Money magazine as one of the top 100 schools in the nation.[21]
Governance
Abington Heights School District is governed by 9 individually elected board members who serve without compensation for a term of four years, the Pennsylvania State Board of Education, the Pennsylvania Department of Education and the Pennsylvania General Assembly.[22] The board members are elected from 3 designated regions in the District. The federal government controls programs it funds like: Title I funding for low income children in the Elementary and Secondary Education Act and the No Child Left Behind Act(renamed Every Student Succeeds Act (ESSA) in December 2015), which mandates the district focus its resources on student success in acquiring reading and math skills.[23] The school board is required by state law to post a financial report on the district, in its website by March of each school year.[24]
The Superintendent and Business Manager are appointed by the school board. The Superintendent is the chief administrative officer with overall responsibility for all aspects of operations, including education and finance. The Business Manager is responsible for budget and financial operations. Neither of these officials are voting members of the School Board. The School Board enters into individual employment contracts for these positions. These contracts must be in writing and are subject to public disclosure under the state's Right to Know Act. In Pennsylvania, public school districts are required to give 150 days notice to the Superintendent and Business Manager regarding renewal of their employment contracts.[25] Pursuant to Act 141 of 2012 which amended the Pennsylvania School Code, all school districts that have hired superintendents on/after the fall of 2012 are required to develop objective performance standards and post them on the district's website.[26]
The Pennsylvania Auditor General audits the district on various issues on a cyclic basis. The reports are posted in the Auditor General Office website.
Schools
- Clarks Summit Elementary School (K-4)
- Newton-Ransom Elementary School (K-4)
- South Abington Elementary School (K-4)
- Waverly Elementary School (K-4)
- Abington Heights Middle School (5-8) *Labeled a Don Eichhorn School to Watch in 2009, 2012, 2015[27]
- Abington Heights High School (9-12)
Clarks Summit Elementary School covers the student population of the Clarks Summit and Clarks Green areas, while South Abington Elementary School covers mostly South Abington Township. Waverly Elementary School, located in the historic village of Waverly, covers the Waverly, Glenburn Township, and Dalton areas of the Abington Heights School District. Newton, the smallest elementary school in the district, covers the rural regions of Newton and Ransom Townships. All middle school students in the district attend Abington Heights Middle School (off Newton-Ransom Blvd. in Newton Township). Abington Heights High School is off Noble Rd. in Clarks Summit.
For the district, the students per FTE teacher ratio is 16:1.[28] During the 2005–2006 school year, the last time data was available, the overall ethnicity was 95% White (non-Hispanic), 2% Asian/Pacific Islander, Black (non-Hispanic) 1%, Hispanic 1%, American Indian/Alaskan Native <1%.[29]
The Abington Heights School District provides half-day kindergarten in 2011.[30]
Academic achievement
Abington Heights School District was ranked 38th out of 498 Pennsylvania School Districts in 2016 by the Pittsburgh Business Times.[31] The ranking is based on the last 3 years of student academic achievement as demonstrated by PSSAs results in: reading, writing, math and science and the three Keystone Exams (literature, Algebra 1, Biology I) in high school.[32] Three school districts were excluded because they do not operate high schools (Saint Clair Area School District, Midland Borough School District, Duquesne City School District). The PSSAs are given to all children in grades 3rd through 8th. Adapted PSSA examinations are given to children in the special education programs. Writing exams were given to children in 5th and 8th grades.[33]
|
|
|
In 2007, Abington Heights School District was noted as an academically high performing school district in a statewide school report called Costing out the Resources need to meet Pennsylvania's Public Education Goals. It was one of 67 Pennsylvania public school districts who were recognized.[41] However the District was not recognized for the efficient use of tax dollars to achieve academic success.
- Overachievers Ranking
In 2013, the Pittsburgh Business Times reported an Overachievers Ranking for 498 Pennsylvania school districts. Abington Heights School District ranked 314th. The paper describes the ranking as: "a ranking answers the question - which school districts do better than expectations based upon economics? This rank takes the Honor Roll rank and adds the percentage of students in the district eligible for free and reduced-price lunch into the formula. A district finishing high on this rank is smashing expectations, and any district above the median point is exceeding expectations."[42]
- 2012 - 183rd
- 2011 - 281st
- 2010 - 233rd[43]
- 2009 - 125th
Abington Heights School District's High School was cited in a state report regarding irregularities in the PSSA testing.[44][45][46] After an investigation, the District was cleared by the Pennsylvania Department of Education.[47] Statewide 48 school districts or charter programs had suspicious results in the exams administered in 2009, 2010, or 2011.[48][49] The scandal called into question much of the student academic growth touted by the Rendell Administration, which conspicuously ignored the Data Recognition Corp. forensic erasure analysis.[50][51]
District AYP status history
In 2012, Abington Heights School District declined to Warning Adequate Yearly Progress (AYP) status.[52] In 2011, Abington Heights School District achieved Adequate Yearly Progress (AYP). In 2011, 94 percent of the 500 Pennsylvania public school districts achieved the No Child Left Behind Act progress level of 72% of students reading on grade level and 67% of students demonstrating on grade level math. In 2011, 46.9 percent of Pennsylvania school districts achieved Adequate Yearly Progress (AYP) based on student performance. An additional 37.8 percent of Pennsylvania public school districts made AYP based on a calculated method called safe harbor, 8.2 percent on the growth model and 0.8 percent on a two-year average performance.[53] Abington Heights School District achieved AYP status each year from 2006 to 2010
Graduation rate
In 2016, the District's graduation rate was 94%.[57]
- 2015, the District's graduation rate was 93.[58] The nationwide graduation rate was 83%.[59]
- 2014 - 93%[60]
- 2013 - 88%[61]
- 2012 - 96%.[62]
- 2011 - 89.58%
- 2010 - 89%, the Pennsylvania Department of Education issued a new, 4-year cohort graduation rate.[63]
- According to traditional graduation rate calculations
High school
Abington Heights High School is located at 222 Noble Road, Clarks Summit. In 2016, enrollment was reported as 1,047 pupils in 9th through 12th grades, with 16% of pupils eligible for a free lunch due to the family meeting the federal poverty level. Additionally, 7.6% of pupils received special education services, while less than 0.1% of pupils were identified as gifted.[68] The school employed 76 teachers.[69] Per the PA Department of Education, 100% of the teachers were rated "Highly Qualified" under the federal No Child Left Behind Act.[70]
In 2013, enrollment was reported as 1,078 pupils in 9th through 12th grades, with 13.8% of pupils eligible for a free lunch due to family poverty.[71] Additionally, 9% of pupils received special education services, while 4.6% of pupils were identified as gifted. The school employed 85 teachers.[72] Per the PA Department of Education 100% of the teachers were rated "Highly Qualified" under the federal No Child Left Behind Act.
According to the National Center for Education Statistics, in 2011, the school reported an enrollment of 1,135 pupils in grades 9th through 12th, with 124 pupils eligible for a federal free or reduced price lunch due to the family meeting the federal poverty level. In 2011, the Abington Heights High School employed 85 teachers yielding a student-teacher ratio of 13:1.[73] According to a report by the Pennsylvania Department of Education, 100% teachers were rated "Highly Qualified" under the federal No Child Left Behind Act.[74]
- 2016 School Performance Profile
SPP 93.7 out of 100 points. Abington Heights High School Keystone Exams mandated testing results were: 93% of students were on grade level in reading-literature and 82% of students demonstrated on grade level in Algebra I. In Biology I, 87% of pupils demonstrated on grade level science understanding at the end of the Biology course.[75] The requirement that pupils pass the Keystone Exams in reading, algebra I and biology I in order to graduate was postponed until 2019 by the Pennsylvania General Assembly because less than 60% of 12 grade pupils statewide would have been eligible for graduation from high school due to failing one or more Keystone Exams.[76] Fifty-four percent of the 2,676 public schools in Pennsylvania achieved a passing score of 70 or better.[77]
- 2015 School Performance Profile
Abington Heights High School achieved 98.1 out of 100. Reflects on grade level reading, mathematics and science achievement. The PDE reported that 95% of the Abington Heights High School's students were on grade level in reading/literature. In Algebra 1, 86% of students showed on grade level skills at the end of the course. In Biology I, 84.6% demonstrated on grade level science understanding at the end of the course.[78][79] Statewide, 53 percent of schools with an eleventh grade achieved an academic score of 70 or better. Five percent of the 2,033 schools with 11th grade were scored at 90 and above; 20 percent were scored between 80 and 89; 28 percent between 70 and 79; 25 percent between 60 and 69 and 22 percent below 60. The Keystone Exam results showed: 73 percent of students statewide scored at grade-level in English, 64 percent in Algebra I and 59 percent in biology.[80][81]
- 2014 School Performance Profile
Abington Heights High School achieved 98.3 out of 100. Reflects on grade level reading, mathematics and science achievement. In reading/literature 94.5% were on grade level. In Algebra 1, 88% showed on grade level skills. In Biology, 86% demonstrated on grade level science understanding at the end of the course.[82] Statewide, the percentage of high school students who scored proficient and advanced in Algebra I increased to 39.7% to 40.1%. The percentage of high school students who scored proficient and advanced in reading/literature declined to 52.5%. The percentage of high school students who scored proficient and advanced in biology improved from 39.7% to 41.4%.[83]
- 2013 School Performance Profile
Abington Heights High School achieved an SPP 95.3 out of 100. Reflects on grade level reading, mathematics and science achievement. In reading/literature - 95.7% were on grade level. In Algebra 1, 84% showed on grade level skills. In Biology, 58.5% showed on grade level science understanding.[84] According to the Pennsylvania Department of Education, 2,181 public schools (less than 73 percent of Pennsylvania public schools), achieved an academic score of 70 or higher. Pennsylvania 11th grade students no longer take the PSSAs. Instead, beginning in 2012, they take the Keystone Exams at the end of the associated course.[85]
- AYP History
In 2012, Abington Heights High School declined to Warning Adequate Yearly Progress (AYP) status, due to missing the mathematics metric.[86] In 2010 and 2011, Abington Heights High School achieved AYP status.[87] In 2009, Abington Heights High School was in Warning AYP status.[88] From 2003 through 2008, the High School achieved Adequate Yearly Progress each school year.
- PSSA Results
Pennsylvania System of School Assessments, commonly called PSSAs are No Child Left Behind Act related examinations which were administered from 2003 through 2012, in all Pennsylvania public high schools. The exams were administered in the Spring of each school year. The goal was for 100% of students to be on grade level or better in reading and mathematics, by the Spring of 2014. The tests focused on the state's Academic Standards for reading, writing, mathematics and science. The Science exam included content in science, technology, ecology and the environmental studies. The mathematics exam included: algebra I, algebra II, geometry and trigonometry. The standards were first published in 1998 and are mandated by the Pennsylvania State Board of Education.[89]
In 2013, the Commonwealth of Pennsylvania changed its high school assessments to the Keystone Exams in Algebra 1, Reading/literature and Biology1. The exams are given at the end of the course, rather than all in the spring of the student's 11th grade year.[90]
- 11th Grade Reading
- 2012 - 79% on grade level, (7% below basic). State - 67% of 11th graders are on grade level.[91]
- 2011 - 84% (7% below basic). State - 69.1%[92]
- 2010 - 82%, (7% below basics). State - 66%
- 2009 - 85%, State - 65%
- 2008 - 68%, State - 65%
- 2007 - 74%. State - 65%[93]
- 11th Grade Math:
- 2012 - 65% on grade level (16% below basic). In Pennsylvania, 59% of 11th graders are on grade level.[94]
- 2011 - 70% (15% below basic). State - 60.3%[95]
- 2010 - 67% (14% below basic). State - 59%
- 2009 - 66%, State - 56%[96]
- 2008 - 55%, State - 56%
- 2007 - 57%, State - 53%
- 11th Grade Science:
- 2012 - 53% on grade level (6% below basic). State - 42% of 11th graders were on grade level.[97]
- 2011 - 47% (12% below basic). State - 40%[98]
- 2010 - 50%, State - 39%
- 2009 - 55%, State - 40%
- 2008 - 35%, State - 39%[99]
- 2007 - students tested. Results withheld from the public by PDE.
Science in Motion Abington Heights High School did not take advantage of a state program called Science in Motion which brought college professors and sophisticated science equipment to the school to raise science awareness and to provide inquiry-based experiences for the students. The Science in Motion program was funded by a state appropriation and cost the school nothing to participate.[100] Wilkes University provided the science enrichment experiences to schools in the region.
College remediation
According to a Pennsylvania Department of Education study released in January 2009, 8% of Abington Heights School District graduates required remediation in mathematics and or reading before they were prepared to take college level courses in the Pennsylvania State System of Higher Education or community colleges.[101][102] Less than 66% of Pennsylvania high school graduates, who enroll in a four-year college in Pennsylvania, earned a bachelor's degree within six years.[103] Among Pennsylvania high school graduates pursuing an associate degree, only one in three graduated in three years.[104] Per the Pennsylvania Department of Education, one in three recent high school graduates who attend Pennsylvania's public universities and community colleges takes at least one remedial course in math, reading or English.
Dual enrollment
Abington Heights High School offers a dual enrollment program. This state program permits high school students to take courses, at local higher education institutions, to earn college credits. Students remain enrolled at their high school. The courses count towards high school graduation requirements and towards earning a college degree. The students continue to have full access to activities and programs at their high school. The college credits are offered at a deeply discounted rate. The state offers a small grant to assist students in costs for tuition, fees and books.[105] Under the Pennsylvania Transfer and Articulation Agreement, many Pennsylvania colleges and universities accept these credits for students who transfer to their institutions.[106] For the 2009-10 funding year, Abington Heights School District received a state grant of $4,165 for the program.
Graduation requirements
Among Pennsylvania's 500 public school districts, graduation requirements widely vary. The local School Board sets the graduation requirements in a graduation policy. By law, all Pennsylvania secondary school students were required to complete a project as a part of their eligibility to graduate from high school. The type of project, its rigor and its expectations are set by the individual school district.[107] Effective with the graduating class of 2017, the Pennsylvania State Board of Education eliminated the state mandate that students complete a culminating project in order to graduate.[108]
By Pennsylvania School Board regulations, beginning with the class of 2020,[109][110] public school students must demonstrate successful completion of secondary level course work in Algebra I, Biology, and English Literature by passing the Keystone Exams.[111] The exam is given at the end of the course. Keystone Exams replace the PSSAs for 11th grade.[112]
Students have several opportunities to pass the exam. Schools are mandated to provide targeted assistance to help the student be successful. Those who do not pass after several attempts can perform a project in order to graduate.[113][114]
Students have several opportunities to pass the exams. Schools are mandated to provide targeted assistance to help the student be successful. Those who do not pass after several attempts can perform a project in order to graduate.[115][116] The original intent was to gradually add seven more exams including civics and geometry. In 2017, the Pennsylvania General Assembly passed legislation that eliminated developing any more Keystone Exams in other subjects.[117] In 2011, Pennsylvania high school students field tested the Algebra 1, Biology and English Lit exams. The statewide results were: Algebra 1 38% on grade level, Biology 35% on grade level and English Lit - 49% on grade level.[118] Individual student, school or district reports were not made public, although they were reported to district officials by the Pennsylvania Department of Education. Students identified as having special needs and qualifying for an Individual Educational Program (IEP) may graduate by meeting the requirements of their IEP.
In 2017, the Pennsylvania General Assembly passed House Bill 202,[119] which makes modifications of the Keystone Exam mandates for students who attend VoTech and Career Tech schools. These pupils will be allowed to use alternate assessments or industry-based certifications.[120][121]
SAT scores
In 2016, 209 Abington Heights School District students took the SAT exams. The District's Verbal Average Score was 534. The Math average score was 547. The Writing average score was 526.[122] The College Board also reported that statewide 92,569 pupils took the exams with average scores declining again in all three measurers to: 494 in reading, 508 in math and 482 in writing.[123] Nationally, 1,681,134 students took the SATs.[124]
In 2015, 224 Abington Heights School District students took the SAT exams. The District's Verbal Average Score was 549. The Math average score was 557. The Writing average score was 534.[125] The College Board also reported that statewide 96,826 pupils took the exams with average scores declining in all three measurers to: 495 in reading, 511 in math and 484 in writing.[126]
In 2014, 243 Abington Heights School District students took the SAT exams. The District's Verbal Average Score was 540. The Math average score was 545. The Writing average score was 537.[127][128] Statewide in Pennsylvania, Verbal Average Score was 497. The Math average score was 504. The Writing average score was 480. The College Board reported that nationwide scores were: 497 in reading, 513 in math and 487 in writing.[129] In 2014, 1,672,395 students took the SATs in the United States.
In 2013, 220 Abington Heights School District students took the SAT exams. The District's Verbal Average Score was 548. The Math average score was 535. The Writing average score was 544. The College Board reported that statewide scores were: 494 in reading, 504 in math and 482 in writing. The nationwide SAT results were the same as in 2012.[130]
In 2012, 255 Abington Heights School District students took the SAT exams. The District's Verbal Average Score was 527. The Math average score was 528. The Writing average score was 514. The statewide Verbal SAT exams results were: Verbal 491, Math 501, Writing 480. In the US, 1.65 million students took the exams achieving scores: Verbal 496, Math 514, Writing 488. According to the College Board the maximum score on each section was 800, and 360 students nationwide scored a perfect 2,400.
In 2011, 249 Abington Heights School District students took the SAT exams. The District's Verbal Average Score was 522. The Math average score was 522. The Writing average score was 512.[131] Pennsylvania ranked 40th among states with SAT scores: Verbal - 493, Math - 501, Writing - 479.[132] In the United States, 1.65 million students took the exam in 2011. They averaged 497 (out of 800) verbal, 514 math and 489 in writing.[133]
AP Courses
In 2013, Abington Heights High School offered 12 Advanced Placement (AP) courses at a higher cost than regular courses. The student pays the fee for the exam which was $89 per test per pupil in 2012. Students have the option of taking College Board approved courses and then taking the College Board's examination in the Spring. Students, who achieve a 3 or better on the exam, may be awarded college credits at US universities and colleges. Each higher education institution sets its own standards about what level of credits are awarded to a student based on their AP exam score. Most higher education institutions give credits for scores of 4 or 5. Some schools also give credits for scores of 3. High schools give credits towards graduation to students who take the school's AP class. At Abington Heights High School 100% of students who took an AP course earned a 3 or better on the exam in 2013.[134]
- 2014 - 13 AP courses with 100% of pupils who took a course earning a 3 or better on the associated AP exam.[135]
- 2015 - 13 AP courses with 92% of pupils who took a course earning a 3 or better on the associated AP exam.[136]
- 2016 - 13 AP courses with 90% of pupils who took a course earning a 3 or better on the associated AP exam.[137]
Middle school
Abington Heights Middle School is located at 1555 Newton Ransom Blvd, Clarks Summit. In 2016, enrollment was 1,046 pupils, in grades 5th through 8th, with 19% of pupils eligible for a free lunch due to family poverty. Additionally, 10.8% of pupils received special education services, while 3.92% of pupils were identified as gifted.[138] According to a 2016 report by the Pennsylvania Department of Education, 100% of its teachers were rated "Highly Qualified" under No Child Left Behind.[139] The school was not a federally designated Title I school.
In 2013, enrollment was 1,047 pupils, in grades 5th through 8th, with 17% of pupils eligible for a free lunch due to family poverty. Additionally, 10% of pupils received special education services, while 4.68% of pupils were identified as gifted.[140] According to a 2013 report by the Pennsylvania Department of Education, 100% of its teachers were rated "Highly Qualified" under No Child Left Behind.[141]
According to the National Center for Education Statistics, in 2011, the school reported an enrollment of 1,056 pupils, in grades 5th through 8th, with 118 pupils receiving a federal free or reduced price lunch due to family poverty. The school employed 71 teachers yielding a student-teacher ratio of 15:1.[142] According to a report by the Pennsylvania Department of Education, 100% of the teachers were rated "Highly Qualified" under No Child Left Behind.[143] The school was a federally designated Title I school.
- 2016 School Performance Profile
SPP 74.6 out of 100 points. Abington Heights Middle School PSSA mandated testing results were: 76% of students in 8th grade were on grade level in reading, while just 39% of students demonstrated on grade level in mathematics. In science 75% of eighth grade pupils demonstrated on grade level science understanding.[144] In 7th grade, 82% of pupils were on grade level in reading, while just 61% demonstrated on grade level math skills. Among 6th graders, 75% were on grade level in reading and only 49% were on grade level in math. In 2016, 74% of 5th grade students were on grade level in reading. In mathematics, just 59% of 5th grade students showed on grade level math skills. No fifth grade writing scores were reported. Statewide just 31% of eighth graders demonstrated on grade level in math and 58% of eighth graders were on grade level in reading. In science, 57.7% of eighth graders showed on grade level proficiency. Among 7th graders, just 37% of students demonstrated on grade evel skills in mathematics. In seventh grade reading, 58% were on grade level. Sixth graders had 61.5% showing on grade level math skills. In reading, 61.5% of sixth graders were on grade level.[145]
- 2015 School Performance Profile
The PDE withheld SPP scores. In April 2015, 80% of 8th grade students at Abington Heights Middle School students were on grade level in reading on the PSSAs. In math/Algebra 1, just 40% of 8th grade students showed on grade level skills. In science, 71% of the school's 8th graders demonstrated on grade level science understanding. No eighth grade writing scores were reported. In 7th grade, 78% were on grade level in reading, while 55% showed on grade level math skills. Among 6th graders, 81% were on grade level in reading and 61% were on grade level in mathematics. Among fifth graders, 67% of 5th grade students were on grade level in reading. In mathematics, just 57% of 5th grade students showed on grade level skills. No fifth grade writing scores were reported.[146] Statewide 58% of eighth (8th) graders were on grade level in reading, while 29% demonstrated on grade level math skills. Pennsylvania 7th graders were 58% on grade level in reading and 33% demonstrated on grade level math skills. Among sixth (6th) graders, 60.7% were reading on grade level, while 39.7% demonstrated on grade level math skills. Statewide 61.9% of fifth (5th) graders were on grade level in reading, while 42.8% demonstrated on grade level math skills.[147]
- 2014 School Performance Profile
Abington Heights Middle School achieved 89.1 out of 100. Reflects on grade level reading, mathematics and science achievement. In reading/literature, 81% of pupils at AHMS were on grade level. In Algebra 1/Math, 86% showed on grade level mathematics skills. In Science, 79% of 8th graders showed on grade level science understanding. In writing, % of the 8th grade students demonstrated on grade level writing skills.[148][149]
- 2013 School Performance Profile
Abington Heights Middle School achieved 87.2 out of 100. Reflects on grade level reading, writing, mathematics and science achievement. In reading, 81% of the students were on grade level. In Mathematics/Algebra 1, 85% of the students showed on grade level skills. In Science, 80% of the 8th graders demonstrated on grade level understanding. In writing, 87% of the 8th grade students demonstrated on grade level writing skills.[150]
- AYP History
In 2012, Abington Heights Middle School declined to School Improvement Level I status due to chronic lagging achievement by special education pupil in both reading and mathematics.[151] Under the federal No Child Left Behind Act, the school administration was required to notify parents of the school's poor achievement outcomes. Additionally, the school administration was required by the Pennsylvania Department of Education, to develop a School Improvement Plan to address the school's low student achievement. Under the Pennsylvania Accountability System, the school district must pay for additional tutoring for struggling students.[152] The School was eligible for special, extra funding under School Improvement Grants, which the school must apply for each year.[153]
- 2011 - declined to Warning AYP status due to lagging student academic achievement.[154]
- 2010 - achieved AYP status[155]
- 2009 - achieved AYP status
- 2008 - declined to Warning AYP status due to lagging student academic achievement.[156]
- 2006 and 2007 - achieved AYP status
- 2005 - Making Progress School Improvement Level I status
- 2004 - declined to School Improvement Level I status due to lagging student achievement[157]
- 2003 - Warning AYP status
- PSSA Results
Pennsylvania System of School Assessments, commonly called PSSAs are NCLB related examination given in the Spring of each school year. Fifth graders are tested in reading, mathematics and writing. Sixth and seventh grades have been tested in reading and mathematics since 2006. Eighth graders are tested in: reading, writing, mathematics and Science. Beginning in the Spring of 2013, eighth graders, who are enrolled in Algebra I take the Keystone Exam for Algebra I at the end of the course. The testing of 8th grade in reading and mathematics began in 1999.[158] Testing in science began in 2007. The goal is for 100% of students to be on grade level or better in reading and mathematics, by the Spring of 2014. The tests focus on the state's Academic Standards for reading, writing, mathematics and science.[159] The standards were published in 1998 and are mandated by the Pennsylvania State Board of Education.[160] In 2014, the Commonwealth adopted the Pennsylvania Core Standards - Mathematics.[161]
- 8th Grade Reading:
- 2012 - 93% on grade level (3% below basic). In Pennsylvania, 79% of 8th graders on grade level.[94]
- 2011 - 98% (1% below basic) State - 81.8%[162]
- 2010 - 92% (3% below basic). State - 82%[163]
- 2009 - 95%, State - 80.9%[164]
- 2008 - 95%, State - 78%
- 8th Grade Math:
- 2012 - 83% on grade level (4% below basic). State - 76%[165]
- 2011 - 93% (2% below basic). State - 76.9%[165]
- 2010 - 95% (1% below basic). State - 75%[166]
- 2009 - 90%, State - 71%[167]
- 2008 - 93%, State -70%[168]
- 8th Grade Science:
- 2012 - 73% on grade level (9% below basic). State - 59%[169]
- 2011 - 76% (11% below basic). State – 58.3%
- 2010 - 77%, State - 57%[170]
- 2009 - 65%, State - 55%[171]
- 2008 - 65%, State - 50%
|
|
|
|
|
|
In 2009, the Abington Heights Middle School was named a School to Watch by the National Forum to Accelerate Middle-Grades Reform. The recognition goes to schools that are: academically excellent by challenging all students, are sensitive to the unique developmental challenges of early adolescence and are democratic and fair, providing every student with high-quality teachers, resources, and supports. Schools must apply for this recognition.[172] Schools apply for this designation.[173]
Clarks Summit Elementary School
Clarks Summit Elementary School is located at 401 W Grove Street, Clarks Summit. In 2016, the School's enrollment was 356 pupils in grades kindergarten through 4th, with 20% of pupils receiving a federal free or reduced price meals due to family poverty. Additionally, 21% of the pupils receive special education services, while less than 1% are identified as gifted.[174] According to a report by the Pennsylvania Department of Education, 100% of the teachers were rated highly qualified under No Child Left Behind. The school provides half day kindergarten.[175] The school is a federally designated Title I school.
In 2013, the School's enrollment was 356 pupils in grades kindergarten through 4th, with 13% of pupils receiving a federal free or reduced price meals due to family poverty. Additionally, 16% of the pupils receive special education services, while 2.5% are identified as gifted.[176] According to a report by the Pennsylvania Department of Education, 100% of the teachers were rated highly qualified under No Child Left Behind. The school provides half day kindergarten.[177] The School is not a federally designated Title I school.
According to the National Center for Education Statistics, in 2011, enrollment was 376 pupils in grades 3rd and 4th, with 47 pupils receiving a free or reduced price lunch. The School employed 28 teachers yielding a student-teacher ratio of 13:1.[178] According to a report by the Pennsylvania Department of Education, 100% of its teachers were rated "Highly Qualified" under the federal No Child Left Behind Act.[179]
- 2016 School Performance Profile
SPP of 75.5 points out of 100. Clarks Summit Elementary School PSSA mandated testing results were: 71% of students in 4th grade were on grade level in reading, while just 56% of students demonstrated on grade level mathematics skills. In science, 89% of fourth grade pupils demonstrated on grade level understanding of science concepts in the state standards. Among the school's third graders, 77% were reading on grade level and 69% showed on grade level mathematics skills.[180][181] In the Commonwealth, just 60% of third graders were reading on grade level. Among Pennsylvania 4th graders 58% were reading on grade level.[182]
- 2015 School Performance Profile
The SPP was withheld by the PDE. According to the Pennsylvania Department of Education, 69% of 4th grade students at Elementary School were on grade level in reading on the PSSAs given in April 2015. In mathematics, just 53% of 4th grade students showed on grade level skills. In science, 91% of fourth graders showed on grade level understanding. Among third (3rd) graders, 74% were on grade level in reading and 59% were on grade level in mathematics.[146] Statewide, Pennsylvania 4th graders were 58.6% on grade level in reading and 44.4% demonstrated on grade level math skills. In science, 77.3% of fourth graders showed on grade level understanding. Among all Pennsylvania public school third (3rd) graders, 62% were reading on grade level, while 48.5% demonstrated on grade level math skills.[183]
- 2014 School Performance Profile
Clarks Summit Elementary School achieved a SPP score of 79.4 out of 100. The score reflects on grade level: reading, science, writing and mathematics achievement. In 2013–14, 78% of the students were reading on grade level in grades 3rd and 4th. In 3rd grade, 78% of the pupils were reading on grade level. In math, 82.39% were on grade level (3rd-4th grades). In 4th grade science, 89% of the pupils demonstrated on grade level understanding.[184]
- 2013 School Performance Profile
Clarks Summit Elementary School achieved a SPP score of 80.4 out of 100. The score reflects on grade level: reading, science, writing and mathematics achievement. In 2012–13, 83% of the students were reading on grade level in grades 3rd and 4th grades. In 3rd grade, 88.9% of the pupils were reading on grade level. In math, 86% were on grade level (3rd and 4th grades). In 4th grade science, just 87% of the pupils demonstrated on grade level understanding.[185]
- AYP History
In 2011 and 2012, Clarks Summit Elementary School achieved AYP status.[186] Clarks Summit Elementary School achieved AYP status each year from 2004 through 2010 inclusive.
- PSSA History
In the Spring of the school year, the 3rd graders take the PSSAs in math and reading. The fourth grade is tested in reading, math and science. Pennsylvania System of School Assessments were administered beginning 2006 to all Pennsylvania public school students in grades 3rd-4th.[187] The goal was for 100% of students to be on grade level or better in reading and mathematics, by the Spring of 2014.[188][189][190] The tests focused on the state's Academic Standards for reading, writing, mathematics and science. The Science exam is given to 4th grades and includes content in science, technology, ecology and the environmental issues studies.[191]
|
|
- 4th Grade Science
- 2012 - 89%, (4% below basic). State - 82%
- 2011 - 93%, (1% below basic). State - 82.9%
- 2010 - 90%, (2% below basic). State - 81%
|
|
Newton-Ransom School
Newton-Ransom School is located at 1549 Newton Ransom Boulevard, Clarks Summit. In 2016, the School's enrollment was 267 pupils in grades kindergarten through 4th, with 35% of pupils receiving a federal free or reduced price meals due to family poverty. Additionally, 15% of the pupils receive special education services, while less than 1% are identified as gifted.[195] According to a report by the Pennsylvania Department of Education, 100% of the teachers were rated highly qualified under No Child Left Behind. The school provides half day kindergarten.[196] The school is a federally designated Title I school.
In 2013, the school's enrollment was 289 pupils in grades kindergarten through 4th, with 29% of pupils receiving a federal free or reduced price meals due to family poverty. Additionally, 16% of the pupils receive special education services, while 2.77% are identified as gifted.[197] According to a report by the Pennsylvania Department of Education, 100% of the teachers were rated highly qualified under No Child Left Behind. The school provided half day kindergarten. It is a federally designated Title I school.[198] According to the National Center for Education Statistics, in 2011, enrollment was 257 pupils in grades kindergarten through 4th, with 56 pupils receiving a free or reduced price lunch. The School employed 21 teachers yielding a student-teacher ratio of 12:1.[199] According to a report by the Pennsylvania Department of Education, 100% of its teachers were rated "Highly Qualified" under the federal No Child Left Behind Act.[200] The School was a Title I school.
- 2016 School Performance Profile
SPP 76.8 out of 100 points. Newton-Ransom School PSSA mandated testing results were: 75% of students in 4th grade were on grade level in reading, while 61% of students demonstrated on grade level mathematics skills. In science, 92% of fourth grade pupils demonstrated on grade level understanding of science concepts in the state standards. Among the school's third graders, just 67% were on grade level in reading and just 56% showed on grade level mathematics skills.[180][181]
- 2015 School Performance Profile
According to the Pennsylvania Department of Education, 58% of 4th grade students at Newton-Ransom School were on grade level in reading on the PSSAs given in April 2015. In mathematics, just 57% of 4th grade students showed on grade level skills. In science, 78% of fourth graders showed on grade level understanding. Among third (3rd) graders, 78% were on grade level in reading and 63% were on grade level in mathematics.[146]
- 2014 School Performance Profile
Newton-Ransom School achieved a score of 77.3 out of 100. The score reflects on grade level: reading, science and mathematics achievement. In 2013–14, only 71% of the students were reading on grade level in grades 3rd and 4th. In 3rd grade, 72% of the pupils were reading on grade level. In math, 85% were on grade level (3rd-4th grades). In 4th grade science, 85% of the pupils demonstrated on grade level understanding.[201]
- 2013 School Performance Profile
Newton-Ransom School achieved a score of 80.4 out of 100. The score reflects on grade level: reading, science, writing and mathematics achievement. In 2012–13, 81% of the students were reading on grade level in grades 3rd and 4th. In 3rd grade, 88% of the pupils were reading on grade level. In math, 84% were on grade level (3rd and 4th grades). In 4th grade science, 90% of the pupils demonstrated on grade level understanding.[202]
- AYP History
In both 2011 and 2012, Newton-Ransom School achieved Adequate Yearly Progress (AYP) status.[203] Newton-Ransom School achieved AYP status each school year from 2004 through 2010.
- PSSA History
|
|
- 4th Grade Science
- 2012 - 94%, 52% advanced (0% below basic). State - 82%
- 2011 - 92%, 47% advanced (2% below basic). State - 82.9%
- 2010 - 92%, 44% advanced (0% below basic). State - 81%
|
|
South Abington School
South Abington School is located at 640 Northern Boulevard, Chinchilla. In 2016, the School's enrollment was 289 pupils in grades th through th, with 17% of pupils receiving a federal free or reduced price meals due to family poverty. Additionally, 11% of the pupils receive special education services, while less than 1% are identified as gifted.[207] According to a report by the Pennsylvania Department of Education, 100% of the teachers were rated highly qualified under No Child Left Behind. The school provided half day kindergarten.[208] The school was not a federally designated Title I school.
In 2013, the South Abington School's enrollment was 258 pupils in kindergarten through 4th grade, with 12% of pupils receiving a federal free or reduced price meals due to family poverty. Additionally, 8% of the pupils receive special education services, while less than 1% are identified as gifted.[209] According to a report by the Pennsylvania Department of Education, 100% of the teachers were rated highly qualified under the federal No Child Left Behind Act. The School provided half day kindergarten.[210] The school is a federally designated Title I school. According to the National Center for Education Statistics, in 2011, enrollment was 268 pupils in kindergarten through 4th, with 37 pupils receiving a free or reduced price lunch. The School employed 17.5 teachers yielding a student-teacher ratio of 15:1.[211] In 2011, according to a report by the Pennsylvania Department of Education, 100% of South Abington's teachers were rated "Highly Qualified" under the federal No Child Left Behind Act.
- 2016 School Performance Profile
SPP 75.9 points out of 100. South Abington School PSSA mandated testing results were: 71% of students in 4th grade were on grade level in reading, while just 57% of students demonstrated on grade level mathematics skills. In science, 87% of fourth grade pupils demonstrated on grade level understanding of science concepts in the state standards. Among the school's third graders, 74% were on grade level in reading and 81% showed on grade level mathematics skills.[180]
- 2015 School Performance Profile
According to the Pennsylvania Department of Education, 75% of 4th grade students at South Abington School were on grade level in reading on the PSSAs given in April 2015. In mathematics, 62% of 4th grade students showed on grade level skills. In science, 92% of fourth graders showed on grade level understanding. Among third (3rd) graders, 68% were on grade level in reading and just 55% were on grade level in mathematics.[146]
- 2014 School Performance Profile
South Abington School achieved a score of 77.4 out of 100. The score reflects on grade level: reading, science, writing and mathematics achievement. In 2013–14, 76% of the students were reading on grade level in grades 3rd-4th. In 3rd grade, 78% of the pupils were reading on grade level. In math, 90% were on grade level (3rd-4th grades). In 4th grade science, 87.9% of the pupils demonstrated on grade level understanding.[212]
- 2013 School Performance Profile
South Abington School achieved a score of 84.6 out of 100. The score reflects on grade level: reading, science, writing and mathematics achievement. In 2012–13, 83% of the students were reading on grade level in grades 3rd and 4th. In 3rd grade, 86% of the pupils were reading on grade level. In math, 91% were on grade level (3rd-5th grades). In 4th grade science, just 88% of the pupils demonstrated on grade level understanding.[213]
- AYP history
In 2011 and 2012, South Abington School achieved AYP status.[214] From 2004 through 2010, South Abington School achieved AYP status each school year.
- PSSA history
|
|
- 4th Grade Science
- 2012 - 95%, 66% advanced (0% below basic). State - 82%
- 2011 - 96%, 61% advanced (0% below basic). State - 82.9%
- 2010 - 91%, 44% advanced (7% below basic). State - 81%
|
|
Waverly School
Waverly School is located at 103 Waverly Road, Waverly. In 2016, the School's enrollment was 275 pupils in grades kindergarten through 4th, with 14% of pupils receiving a federal free or reduced price meals due to family poverty. Additionally, 12.7% of the pupils receive special education services, while 1.8% are identified as gifted.[218] According to a report by the Pennsylvania Department of Education, 100% of the teachers were rated highly qualified under No Child Left Behind. The school provides half day kindergarten.[219] The school is not a federally designated Title I school.
In 2013, the School's enrollment was 288 pupils in kindergarten through 4th grade, with 13.8% of pupils receiving a federal free or reduced price meals due to family poverty. Additionally, 7% of the pupils received special education services, while 2% were identified as gifted.[220] According to a report by the Pennsylvania Department of Education, 100% of the teachers were rated highly qualified under the No Child Left Behind Act. Waverly School provided half day kindergarten.[221] The School was a federally designated Title I school. According to the National Center for Education Statistics, in 2011, enrollment was 301 pupils in kindergarten through 4th grade, with 39 pupils receiving a free or reduced price lunch. The School employed 16 teachers yielding a student-teacher ratio of 18:1.[222] According to a report by the Pennsylvania Department of Education, 100% of its teachers were rated "Highly Qualified" under the federal No Child Left Behind Act.[223] The School provided half day kindergarten to all its pupils.[224]
- 2016 School Performance Profile
SPP 78.4 points out of 100. Waverly School PSSA mandated testing results were: 90% of students in 4th grade were on grade level in reading, while just 67% of students demonstrated on grade level mathematics skills. In science, 98% of fourth grade pupils demonstrated on grade level understanding of science concepts in the state standards. Among the school's third graders, 93% were on grade level in reading and 74% showed on grade level mathematics skills.[180]
- 2015 School Performance Profile
SPP withheld by the PDE. According to the Pennsylvania Department of Education, 92% of 4th grade students at Waverly School were on grade level in reading on the PSSAs given in April 2015. In mathematics, 72% of 4th grade students showed on grade level skills. In science, 98% of fourth graders showed on grade level understanding. Among third (3rd) graders, 93% were on grade level in reading and 73% were on grade level in mathematics.
- 2014 School Performance Profile
Waverly School achieved a score of 93.1 out of 100. The score reflects on grade level: reading, science, writing and mathematics achievement. In 2013–14, 96% of the students were reading on grade level in grades 3rd and 4th. In 3rd grade, 100% of the pupils were reading on grade level. In math, 96% were on grade level (3rd-4th grades). In 4th grade science, 96.8% of the pupils demonstrated on grade level understanding.[225]
- 2013 School Performance Profile
Waverly School achieved a score of 84.7 out of 100. The score reflects on grade level: reading, science, writing and mathematics achievement. In 2012–13, 88% of the students were reading on grade level in grades 3rd and 4th. In 3rd grade, 90% of the pupils were reading on grade level. In math, 90% were on grade level (3rd-4th grades). In 4th grade science, 88% of the pupils demonstrated on grade level understanding.[226]
- AYP History
In 2011 and 2012, Waverly School achieved AYP status.[227] From 2004 through 2010, Waverly School achieved AYP status each school year.
- PSSA History
|
|
- 4th Grade Science
- 2012 - 98%, 55% advanced (0% below basic). State - 82%
- 2011 - 94%, 72% advanced (0% below basic). State - 82.9%
- 2010 - 98%, 71.7% advanced (0% below basic). State - 81%
|
|
Special education
In December 2016, the District administration reported that 416 pupils or 12.5% of the district's pupils received Special Education services, with 51.9% of the identified students having a specific learning disability.[231] In 2014, the District administration reported that 363 pupils or 11% of the district's pupils received Special Education services, with 57.9% of the identified students having a specific learning disability.[232] In 2012, the District administration reported that 367 pupils or 11% of the district's pupils received Special Education services, with % of the identified students having a specific learning disability.[233]
In 2009, the District administration reported that 463 pupils or 13.1% of the district's pupils received Special Education services.[234]
The District engages in identification procedures to ensure that eligible students receive an appropriate educational program consisting of special education and related services, individualized to meet student needs. At no cost to the parents, these services are provided in compliance with state and federal law; and are reasonably calculated to yield meaningful educational benefit and student progress. To identify students who may be eligible for special education, various screening activities are conducted on an ongoing basis. These screening activities include: review of group-based data (cumulative records, enrollment records, health records, report cards, ability and achievement test scores); hearing, vision, motor, and speech/language screening; and review by the Instructional Support Team or Student Assistance Team. When screening results suggest that the student may be eligible, the District seeks parental consent to conduct a multidisciplinary evaluation. Parents who suspect their child is eligible may verbally request a multidisciplinary evaluation from a professional employee of the District or contact the Special Education Department.[235][236] By Pennsylvania law, the District has 60 calendar days, after receiving parental consent, to complete the evaluation.[237][238][239] The IDEA 2004 requires each school entity to publish a notice to parents, in newspapers or other media, including the student handbook and school website regarding the availability of screening and intervention services and how to access them.
Students who have an Individual Education Plan (IEP) may take the PSSA-M an alternative math exam rather than the PSSA.[240] Some special education students may take the PASA (Pennsylvania Alternate System of Assessment), rather than the PSSA.[241] Schools are permitted to provide accommodations to some students.[242]
In 2010, the state of Pennsylvania provided $1,026,815,000 for Special Education services. The funds were distributed to districts based on a state policy which estimates that 16% of the district's pupils are receiving special education services. This funding is in addition to the state's basic education per pupil funding, as well as, all other state and federal funding.[243] The state requires each public school district and charter school to have a three-year special education plan to meet the unique needs of its special education students.[244] In 2012, the Obama Administration's US Department of Education issued a directive requiring schools include students with disabilities in extracurricular activities, including sports.[245]
Abington Heights School District received a $1,632,884 supplement for special education services in 2010.[246]
- 2014–15 school year, AHSD received an increase to $1,609,632 from the Commonwealth for special education funding.[247]
- 2016–17 school year, Abington Heights School District received a 0.7% increase in state special education funding to $1,678,613.[248]
- 2017–18 school year - $1,646,305[249]
Additionally, the state provides supplemental funding for extraordinarily impacted students. The District must apply for this added funding. In 2013, the state's Special Education Funding Reform Commission provided a report on the state of funding for special education in the Commonwealth.[250] Funding for special education programs is borne largely on a local basis at 60%, with the state contributing $1 billion or 30% and the federal government providing 10% of the funding.
Gifted education
The District Administration reported that 148 students or 4.26% of its students were gifted in 2009.[251] By law, the district must provide mentally gifted programs at all grade levels. The primary emphasis is on enrichment and acceleration of the regular education curriculum through a push in model with the gifted instructor in the classroom with the regular instructor. This approach permits such specialized instructional strategies as tiered assignments, curriculum compacting, flexible grouping, learning stations, independent projects and independent contracts. Students identified as gifted attending the High School have access to honors and advanced placement courses, and dual enrollment with local colleges. The referral process for a gifted evaluation can be initiated by teachers or parents by contacting the student's building principal and requesting an evaluation. All requests must be made in writing. To be eligible for mentally gifted programs in Pennsylvania, a student must have a cognitive ability of at least 130 as measured on a standardized ability test by a certified school psychologist. Other factors that indicate giftedness will also be considered for eligibility.[252]
School safety and bullying
The Abington Heights School District administration reported there were zero incidents of bullying in the District in 2012. Additionally, there were three assaults on students and no sexual incidents involving students. The local law enforcement was involved in zero incidents at the schools.[253] [254] Each year the school safety data is reported by the district to the Safe School Center which then publishes the compiled reports online. Nationally, nearly 20% of pupils report being bullied at school.[255]
The Abington Heights School Administration reported two incidents of bullying occurring in the schools in 2009.[256][257]
The school board prohibits bullying by district students and employees. The Board directs that complaints of bullying shall be investigated promptly, and corrective action shall be taken when allegations are verified. No reprisals or retaliation shall occur as a result of good faith reports of bullying.[258] All Pennsylvania schools are required to have an anti-bullying policy incorporated into their Code of Student Conduct. The policy must identify disciplinary actions for bullying and designate a school staff person to receive complaints of bullying. The policy must be available on the school's website and posted in every classroom. All Pennsylvania public schools must provide a copy of its anti-bullying policy to the Office for Safe Schools every year, and shall review their policy every three years. Additionally, the district must conduct an annual review of that policy with students.[259] District administration are required to annually provide the following information with the district's Safe School Report: the board's bullying policy, a report of bullying incidents in the school district, and information on the development and implementation of any bullying prevention, intervention or education programs. The Center for Schools and Communities works in partnership with the Pennsylvania Commission on Crime & Delinquency and the Pennsylvania Department of Education to assist schools and communities as they research, select and implement bullying prevention programs and initiatives.[260]
Education standards relating to student safety and antiharassment programs are described in the 10.3. Safety and Injury Prevention in the Pennsylvania Academic Standards for Health, Safety and Physical Education.[261]
Budget
Pennsylvania public school districts budget and expend funds according to procedures mandated by the General Assembly and the Pennsylvania Department of Education (PDE). An annual operating budget is prepared by school district administrative officials. A uniform form is furnished by the PDE and submitted to the board of school directors for approval prior to the beginning of each fiscal year on July 1.
Under Pennsylvania's Taxpayer Relief Act, Act 1 of the Special Session of 2006, all school districts of the first class A, second class, third class and fourth class must adopt a preliminary budget proposal. The proposal must include estimated revenues and expenditures and the proposed tax rates. This proposed budget must be considered by the Board no later than 90 days prior to the date of the election immediately preceding the fiscal year. The preliminary budget proposal must also be printed and made available for public inspection at least 20 days prior to its adoption. The board of school directors may hold a public hearing on the budget, but are not required to do so. The board must give at least 10 days’ public notice of its intent to adopt the final budget according to Act 1 of 2006.[262]
- Teacher union strikes
In September 2017, Abington Heights Teachers Union went on strike.[263][264] The dispute centered around salary and benefits. The Board offered a 2% annual raise, which the teachers rejected.[265] The teachers paid nothing towards their cadillac health insurance plans. The Board proposes the teachers pay $80 per month. Under the federal Patient Protection Affordable Care Act the District will be required to pay a 40% excise tax on its cadillac health insurance policies for employees.[266] In 2017, multiple northeast Pennsylvania public school districts were hit with teacher union strikes, including: Palmerton Area School District and Stroudsburg Area School District.[267] There were also multiple teacher union strikes in Pennsylvania in 2016, including: Shamokin Area School District, Highlands School District,[268] Ambridge Area School District,[269] Montrose Area School District,[270] Athens Area School District, Warren County School District,[271] Dallas School District.[272] and Sayre Area School District.[273]
In 2016, the average teacher salary in AHSD was $65,196 a year. The District employed 268 teachers with a top salary of $137,990.[274][275] Abington Heights School District teacher and administrator retirement benefits are equal to at least 2.00% x Final Average Salary x Total Credited Service. (Some teachers benefits utilize a 2.50% benefit factor.)[276] After 40 years of service, Pennsylvania public school teachers and administrators can retire with 100% of the average salary of their final 3 years of employment. According to a study conducted at the American Enterprise Institute, in 2011, public school teachers’ total compensation is roughly 50 percent higher than they would likely receive in the private sector. The study found that the most generous benefits that teachers receive are not accounted for in many studies of compensation including: pension, retiree health benefits and job security.[277][278] In 2014–15, the state mandated District contribution to the teacher pension fund rose to 21.40% of employee salaries and in 2015-16 it rose again to 25.84% of total District salaries.[279] In 2017–18, the mandated contribution rate for state and local taxpayers is 32.57% of each teachers salary.[280]
In September 2014, the School Board and teachers reached a contract agreement. Teachers received annual raises of approximately $500 a year.[281]
In July 2014, Abington Heights School District teachers voted to strike regarding contract negotiations. Rather than striking immediately, they waited until school started for pupils in September.[282] The teachers’ union requested state fact-finding reports in 2012-13 and 2013–14. The Abington Heights School Board accepted both fact finding reports. The teachers' union rejected both of the reports.[283][284] Of the nearly 140 teacher strikes that occurred nationally between 2000 and 2007, 60 percent took place in Pennsylvania, according to a report released in August 2012, by the Allegheny Institute for Public Policy.[285] Pennsylvania is one of 13 states in which teacher strikes are legal. Pennsylvania has the highest rate of teacher strikes in the United States. In the Commonwealth of Pennsylvania, there were three teacher union strikes in 2010; one teacher union strike in 2011, one teacher union strike in 2012 and three teacher union strikes in 2013.[286] Crestwood School District teachers, in neighboring Luzerne County, went on strike in 2009. Wyoming Area School District and Danville Area School District both went on strike in the spring of 2014. State law gives the Pennsylvania Department of Education the power to order the teachers to return so that students will complete 180 days of school by June 15.
In 2012, the average teacher salary in Abington Heights School District was $58,560.03 a year, while the cost of the benefits teachers received was $25,636.64 per employee, for a total annual average teacher compensation of $84,196.67.[287] The District employed 277 teachers and administrators, with an average teacher salary of $60,453 and a top salary of $127,685.[288]
In 2009, Abington Heights School District reported employing over 290 teachers with a starting salary of $41,460 for 180 days for pupil instruction. The average teacher salary was $57,046, while the top salary was $121,931.[289] As of 2007, Pennsylvania ranked in the top 10 states in average teacher salaries. When adjusted for cost of living Pennsylvania ranked fourth in the nation for teacher compensation.[290] Additionally, Abington Heights School District teachers receive a defined benefit pension, health insurance, professional development reimbursement, paid personal days, 10 sick days, and many other benefits. Teachers are paid an additional hourly rate, when they are required to work outside of the regular school day.[291] According to State Rep. Glen Grell, a trustee of the Pennsylvania Public School Employees’ Retirement System Board, a 40-year educator can retire with a pension equal to 100 percent of their final salary.[292]
In 2007, Abington Heights School District employed 231 teachers who earned an average teacher salary of $55,080 for 180 days worked.[293]
Per pupil spending The Abington Heights School District administrative costs per pupil in 2008 were $611.74 per pupil. The lowest administrative cost per pupil in Pennsylvania was $398 per pupil.[294] The Pennsylvania School Boards Association collects and maintains statistics on salaries of public school district employees in Pennsylvania. According to the association's report, the average salary for a superintendent, for the 2007–08 school year, was $122,165. Superintendents and administrators receive a benefit package commensurate with that offered to the district's teachers' union.[295]
In 2008, Abington Heights School District reported spending $11,153 per pupil. This ranked 383rd in the commonwealth.[296] In 2010, Abington Heights School District's per pupil spending had increased to $11,871.82.[297] In 2011, the state of Pennsylvania's per pupil spending was $13,467, ranking 6th in the United States.[298] In 2007, the Pennsylvania per pupil total expenditures was reported as $12,759.[299]
- Reserves
In 2009, the District reported $1,371,431 in an unreserved-undesignated fund balance. The designated fund balance was reported as $10,399,284.[300] In 2013, Abington Heights School District Administration reported an increase to $12,752,485 in the reserved fund balances. The District also reported $2,170,247 in its unreserved funds in 2013.[301] In 2014–15, Abington Heights School District reported having $10,307,879 in reserves.[302] The District's reserves are 21% of its budget exceeding state regulation limits of 8%.[303] Pennsylvania public school district reserve funds are divided into two categories – designated and undesignated. The undesignated funds are not committed to any planned project. Designated funds and any other funds, such as capital reserves, are allocated to specific projects. School districts are required by state law to keep 5 percent of their annual spending in the undesignated reserve funds to preserve bond ratings. According to the Pennsylvania Department of Education, from 2003 to 2010, as a whole, Pennsylvania school districts amassed nearly $3 billion in reserved funds.[304] In 2005, the total reserve funds held by Pennsylvania public school districts was $1.9 billion.[305] By 2013, reserves held by Pennsylvania public school districts, as a whole, had increased to over $3.8 billion.[306]
- Audits
In December 2010, the Pennsylvania Auditor General conducted a performance audit of the district. Findings were reported to the administration and school board.[307] In April 2013, the state audited the District again. An issue was reported to the school board and administration.[308]
Tuition Students who live in the District's attendance area may choose to attend one of Pennsylvania's 157 public charter schools. A student living in a neighboring public school district or a foreign exchange student may seek admission to Abington Heights School District. For these cases, the Pennsylvania Department of Education sets an annual tuition rate for each school district. It is the amount the public school district pays to a charter school for each resident student that attends the charter and it is the amount a nonresident student's parents must pay to attend the District's schools. The 2013 tuition rates are Elementary School - $9,244, High School - $9,541[309] In 2015, the tuition rates were Elementary School - $10,165, High School - $10,973.[310] For 2015–16, the tuition rates were Elementary School - $9,414.31, High School - $10,509.21.[311]
The Abington Heights School District is funded by a combination of: a local income tax, a property tax, a real estate transfer tax 0.5%, coupled with substantial funding from the Commonwealth of Pennsylvania and generally 10% of its budget from the federal government.[312] Grants can provide an opportunity to supplement school funding without raising local taxes. Interest earnings on accounts also provide nontax income to the District. In the Commonwealth of Pennsylvania, pension income and Social Security income are exempted from state personal income tax and local school earned income tax, regardless of the level of the individual's personal wealth.[313] The average Pennsylvania public school teacher pension in 2011 exceeds $60,000 a year plus they receive federal Social Security benefits: both are free of Pennsylvania state income tax and local income tax which funds local public schools.[314] Effective 2016, active duty military are also exempted from paying the local earned income tax in Pennsylvania.[315][316]
State basic education funding
According to a report from Representative Todd Stephens office, Abington Heights School District receives 27.9% of its annual revenue from the state.[317] In December 2014, the Pennsylvania Education Funding Reform Commission conducted a hearing. The commission developed a new basic education funding formula which sets a new way to distribute state basic education dollars. It abolished the practice of "hold harmless" funding, which gave districts at least the same as they got the previous school year regardless of declining enrollment. The plan became law in June 2016 (House Bill 1552).[318][319][320]
For the 2017–18 school year, Abington Heights School District received an increase to $6,356,677 in Basic Education Funding from the Commonwealth of Pennsylvania.[321] The greatest increase in funding, in Lackawanna County, was awarded to Mid Valley School District a 2.8% increase.[322] Pennsylvania again increased its public education spending to a record high of $5.995 billion. It was a $100 million increase, 1.7% increase over the 2016-17 state education appropriation.[323] Additionally, the state continued to fund its Ready to Learn grants at $250 million and Special Education funding received a $25 million increase to $1.121 billion.[324] The state also paid $529,5 million to the school employee social security fund and another $2.304 billion to the teacher's pension fund, an increase of 7.6% over the state's 2016-17 payment. The state maintained its $100 million reimbursement to school districts for transportation costs. Governor Wolf had proposed cutting the funding by 50% shifting the costs to local taxpayers.[325][326]
For the 2016–17 school year, Abington Heights School District received $6,273,891 in Basic Education Funding from the Commonwealth of Pennsylvania. This is a 2.5% increase over 2015-16 funding to the District. The highest percentage of BEF increase in Lackawanna County was 5.8% awarded to Scranton School District under the state's Basic Education Funding formula. For the 2016–17 school year, Pennsylvania increased its public education spending to a record high of $5,895 billion. It was a $200 million increase, 3.51% increase over the 2015-16 appropriation.[327] additionally, the state funded Ready to Learn grants at $250 million and Special Education funding received a $20 million increase.[328] The state also paid $492 million to the school employee social security fund and another $2.064 billion to the teacher's pension fund.[329] Statewide Conestoga Valley School District received a 13.3% increase in state BEF funding. Five PA public school districts received an increase of 10% or greater in Basic Education funding over their 2015-16 funding.
For the 2015–16 school year, Governor Tom Wolf released a partial Basic Education Funding of $2,972,568 to Abington Heights School District, in January 2016.[330] This was part of $10.3 billion in school funding withheld from the public schools, by the Governor since the summer of 2015.[331] The dispersement did not follow the new Basic Education Fair Funding formula which had been established by the Pennsylvania General Assembly in June 2015.[332] Ten (10) Pennsylvania school districts received no increase in Basic Education funding under Governor Wolf.[333][334] In April 2016, Governor Wolf announced his finalized dispersement of 2015-16 state Basic Education Funding. Abington Heights School District received a 1.43% increase for a total funding of $6,069,729.[335] This is $53,656 less than the District was to receive by law under the state's Fair Funding Formula approved in 2015.[336][337] Wolf also altered the Ready to Learn Grant distribution. The District received another $255,367 in Ready To Learn grant which was $39,445 less than it would have received under the approved state formula for distribution.
The highest increase in funding statewide was awarded by Governor Wolf to Wilkinsburg Borough School District which got a 44.1% increase in state Basic Education Funding. The average BEF increase among the Commonwealth's 500 public school districts for 2015-16 was 2.21%. In Lackawanna County, the highest percentage increase in state funding was awarded to Old Forge School District - 3.51%. The Pennsylvania education budget is $5.93 billion for basic education, a $200 million or 3.5 percent increase over 2014-15 allocation. Another $1.08 billion was allotted for special education funding, a $30 million or 2.9 percent increase over 2014–15. Additionally, the state paid over $500 million towards school employee social security payments and over $1 billion to the teacher's pension fund (PSERS).[338]
In compliance with a legislative mandate that was passed with veto proof majorities in the PA House and Senate,[339] the final BEF funding was determined for 2015–16, in April 2016. Abington Heights School District received $6,123,561 in Basic Education Funds for the 2015–16 school year. This was a 1.43% increase yielding a $88,996 increase over the previous school year funding. Additionally, the District received $294,812 in Ready to Learn funding from the state, along with Special Education funding, transportation funding and training funding.[340]
For the 2014–15 school year, Abington Heights School District received $6,008,715 in State Basic Education funding. The District also received $103,120 in Accountability Block Grant funding and $124,194 in new Ready To Learn Block grant. The State's enacted Education Budget included $5,526,129,000 for the 2014-2015 Basic Education Funding.[341] The Education budget also includes Accountability Block Grant funding at $100 million and $241 million in new Ready to Learn funding for public schools that focus on student achievement and academic success. The State is paying $500.8 million to Social Security on the school employees behalf and another $1.16 billion to the state teachers pension system (PSERS). In total, Pennsylvania's Education budget for K-12 public schools is $10 billion. This was a $305 million increase over 2013-2014 state spending and the greatest amount ever allotted by the Commonwealth for its public schools.[342]
In the 2013–14 school year, the Abington Heights School District received a 2.3% increase or $6,007,631 in Pennsylvania Basic Education Funding. This is $132,255 more than its 2012-13 state BEF to the District. Additionally, Abington Heights School District received $103,120 in Accountability Block Grant funding to focus on academic achievement and level funding for special education services. Among the public school districts in Lackawanna County, Mid Valley School District received the highest percentage increase in BEF at 2.5%. The District has the option of applying for several other state and federal grants to increase revenues. The Commonwealth's budget increased Basic Education Funding statewide by $123 million to over $5.5 billion. Most of Pennsylvania's 500 public school districts received an increase of Basic Education Funding in a range of 0.9% to 4%. Eight public school districts received exceptionally high funding increases of 10% to 16%. The highest increase in state funding was awarded to Austin Area School District which received a 22.5% increase in Basic Education Funding.[343] The highest percent of state spending per student is in the Chester-Upland district, where roughly 78 percent comes from state coffers. In Philadelphia, it is nearly 49 percent.[344] As a part of the education budget, the state provided the PSERS (Pennsylvania school employee pension fund) with $1,017,000,000 and Social Security payments for school employees of $495 million.[345]
For the 2012–13 school year, Abington Heights School District received $5,875,376.[346][347] The Governor's Executive Budget for 2012-2013 included $9.34 billion for kindergarten through 12th grade public education, including $5.4 billion in basic education funding, which was an increase of $49 million over the 2011-2012 budget. In addition, the Commonwealth provided $100 million for the Accountability Block Grant (ABG) program. Abington Heights School District received $103,120 in Accountability Block Grant funding. The state also provided a $544.4 million payment for School Employees’ Social Security and $856 million for School Employees’ Retirement fund called PSERS.[348] This amount was a $21,823,000 increase (0.34%) over the 2011-2012 appropriations for Basic Education Funding, School Employees' Social Security, Pupil Transportation, Nonpublic and Charter School Pupil Transportation. Since taking office, Corbett's first two budgets have restored more than $918 million in support of public schools, compensating for the $1 billion in federal stimulus dollars lost at the end of the 2010–11 school year.
In the 2011-12 budget year, Abington Heights School District received a $5,875,375.72 allocation, of state Basic Education Funding.[349][350] Additionally, the Abington Heights School District received $103,120 in Accountability Block Grant funding. The enacted Pennsylvania state Education budget included $5,354,629,000 for the 2011-2012 Basic Education Funding appropriation. This amount was a $233,290,000 increase (4.6%) over the enacted State appropriation for 2010–2011.[351] The highest increase in state basic education funding was awarded to Duquesne City School District of Allegheny County, which got a 49% increase in state funding for 2011–12.[352] In 2010, the district reported that 477 students received free or reduced price lunches, due to the family meeting the federal poverty level.[353] Some public school Districts experienced a reduction in funding due to the loss of federal stimulus funding which ended in 2011.
For 2010–11 school year, the Abington Heights School District received a 3.42% increase in state Basic Education Funding resulting in a $6,242,839 payment.[354] Dunmore School District received an 11.88% increase, which was the highest increase in BEF in Lackawanna County. Kennett Consolidated School District in Chester County received the highest increase in the state at 23.65% increase in funding for the 2010–11 school year. One hundred fifty public school districts received the base 2% increase in 2010–2011. The amount of increase each school district received was determined by then Governor Edward G Rendell and the Secretary of Education Gerald Zahorchak, through the allocation set in the state budget proposal made in February each year.[355]
In the 2009-2010 budget year, the Commonwealth of Pennsylvania provided a 2.75% increase in Basic Education funding for a total of $6,036,630 to Abington Heights School District. This was the second lowest percentage point increase, in Basic Education Funding, for the public school districts in Lackawanna County. Two county school districts received increases of over 9% in Basic Education Funding. In Pennsylvania ninety school district received a base 2% increase in state funding. Among the 500 school districts in Pennsylvania, Muhlenberg School District in Berks County received the highest with a 22.31% increase in funding.[356]
The state Basic Education funding to the District in 2008-09 was $5,875,312.13. According to the Pennsylvania Department of Education, 348 students received free or reduced-price lunches due to low family income in the 2007–2008 school year.[357]
Accountability Block Grants
Beginning in 2004–2005, the state launched the Accountability Block Grant school funding. This program has provided $1.5 billion to Pennsylvania's school districts. The Accountability Block Grant program requires that its taxpayer dollars are focused on specific interventions that are most likely to increase student academic achievement. These interventions include: teacher training, all-day kindergarten, lower class size K-3rd grade, literacy and math coaching programs that provide teachers with individualized job-embedded professional development to improve their instruction, before or after school tutoring assistance to struggling students. For 2010-11 the Abington Heights School District applied for and received $279,892 in addition to all other state and federal funding. The district used the funding to reduce class sizes K-3rd grade, to provide teacher training and to develop better curriculum.[358][359]
Ready to Learn grant
Beginning in the 2014-2015 budget, the state funded a new Ready to Learn Grant for public schools. A total of $100 million is allocated through a formula to districts based on the number of students, level of poverty of community as calculated by its market value/personal income aid ratio (MV/PI AR) and the number of English language learners. Ready to Learn Block Grant funds may be used by the Districts for: school safety; Ready by 3 early childhood intervention programs; individualized learning programs; and science, technology, engineering and math (STEM) programs.[360]
Classrooms for the Future grant
The Classroom for the Future state program provided districts with hundreds of thousands of extra state funding to buy laptop computers for each core curriculum high school class (English, Science, History, Math) and paid for teacher training to optimize the computers use. The program was funded from 2006–2009. Abington Heights School District did not apply for funding in 2006–07. In 2007-08 the district received $405,107. For the 2008–09, school year the district received $73,625 for a total of $478,732. Of the 501 public school districts in Pennsylvania, 447 of them received Classrooms for the Future grant awards.[364]
Other grants
The District did not participate in: Pennsylvania Department of Environmental Protection's Environmental Education annual grants;[365][366] PA Science Its Elementary grants (discontinued effective with 2009-10 budget by Governor Rendell);[367] Education Assistance Grants; 2012 Striving Readers Comprehensive Literacy grant;[368] 2013 Safe Schools and Resource Officer grants; 2012 and 2013 Pennsylvania Hybrid Learning Grants;[369] Project 720 High School Reform grants[370] (discontinued effective with 2011-12 budget); nor the federal 21st Century Learning grants.
Federal grants
The district received an extra $1,458,913 in ARRA - Federal Stimulus money to be used in specific programs like special education and meeting the academic needs of low-income students.[371][372] The funding was limited to the 2009-2010 and 2010-2011 school years.[373] Due to the temporary nature of the funding, schools were repeatedly advised by the Pennsylvania Department of Education, the Pennsylvania Senate Education Committee, Governor Edward Rendell and the Pennsylvania School Board Association, to use the funds for one-time expenditures like acquiring equipment, making repairs to buildings, training teachers to provide more effective instruction or purchasing books and software.
Race to the Top grant
Abington Heights School District officials did not apply for the Race to the Top federal grant. When approved for the grant, the district would have received hundreds of thousands of additional federal dollars for improving student academic achievement.[374] Participation required the administration, the school board and the local teachers' union to sign an agreement to prioritize improving student academic success. In Pennsylvania, 120 public school districts and 56 charter schools agreed to participate.[375][376] Pennsylvania was not approved in the first round of the grant. The failure of districts to agree to participate was cited as one reason that Pennsylvania was not approved. A second round of state RTTT application judging will occur in June 2010.[375][376][377]
Title II grants
The Federal government provides annual grants to schools to be used to improve the quality of teacher instructions to pupils. The goal is to provide each child in public schools with “High Quality” teachers and principals as defined by the state.[378] The funds are sent to the state Department of Education which distributes them to each school district and charter school.[379] Beginning in 2002, the federal funding committed to Title II was $3,175,000,000.
Public school district administrations must apply to the state annually for the Title II funds. In 2012–13, Abington Heights School District received $74,145 in federal Title II funding.[380] In 2014–15, Abington Heights School District applied for and received $69,497.[381]
English language learners grant
The Federal government provides annual grants to schools to assist in educating immigrant children and children who are identified as limited English proficient.[382] Upon registering for school a language survey is done for all new enrollment pupils, typically in kindergarten or preschool. They identify the primary language spoken at home. This data is collected and submitted to the Pennsylvania Department of Education, which in turn notifies the federal government.[383][384]
In 2012-13 - Abington Heights School District received $3,259 in Title III funding for English language learners.[385] For 2014–15, Abington Heights School District received $7,984 in Title III funding.[386]
Common Cents state initiative
The Abington Heights School Board chose to not participate in the Pennsylvania Department of Education Common Cents program. The program called for the state to audit the district, at no cost to local taxpayers, to identify ways the district could save tax dollars.[387] After the review of the information, the district was not required to implement any of the recommended cost savings changes.
Real estate taxes
The Abington Heights School Board set property tax rates in 2017–18 at 121.16 mills.[388] A mill is $1 of tax for every $1,000 of a property's assessed value. Irregular property reassessments have become a serious issue in the commonwealth as it creates a significant disparity in taxation within a community and across a region.[389] Property taxes, in the Commonwealth of Pennsylvania, apply only to real estate - land and buildings. The property tax is not levied on cars, business inventory, or other personal property. Certain types of property are exempt from property taxes, including: places of worship, places of burial, private social clubs, charitable and educational institutions and all government property (local, state and federal). Additionally, service related, disabled US military veterans may seek an exemption from paying property taxes. Unlike other states, under Pennsylvania state tax policy, natural gas and oil pipelines are exempted from property taxes.[390]
Pennsylvania school district revenues are dominated by two main sources: 1) Property tax collections, which account for the vast majority (between 75-85%) of local revenues; and 2) Act 511 tax collections (Local Tax Enabling Act), which are around 15% of revenues for school districts.[391]
|
|
The average yearly property tax paid by Lackawanna County residents amounts to about 3.4% of their yearly income. Lackawanna County ranked 413th out of the 3143 United States counties for property taxes as a percentage of median income.[404] According to a report prepared by the Pennsylvania Department of Education, the total real estate taxes collected by all school districts in Pennsylvania rose from $6,474,133,936 in 1999–00 to $10,438,463,356 in 2008-09 and to $11,153,412,490 in 2011.[405] Property taxes in Pennsylvania are relatively high on a national scale. According to the Tax Foundation, Pennsylvania ranked 11th in the U.S. in 2008 in terms of property taxes paid as a percentage of home value (1.34%) and 12th in the country in terms of property taxes as a percentage of income (3.55%).[406]
Act 1 Adjusted index
The Act 1 of 2006 Index regulates the rates at which each school district sex official process. Districts are not authorized to raise taxes above that index unless they allow voters to vote by referendum, or they seek an exception from the state Department of Education. The base index for the 2011–2012 school year was 1.4 percent, but the Act 1 Index could be adjusted higher, depending on a number of factors, such as property values and the personal income of district residents. Act 1 included 10 exceptions, including: increasing pension costs, increases in special education costs, a catastrophe like a fire or flood, increase in health insurance costs for contracts in effect in 2006 or dwindling tax bases. The base index is the average of the percentage increase in the statewide average weekly wage, as determined by the PA Department of Labor and Industry, for the preceding calendar year and the percentage increase in the Employment Cost Index for Elementary and Secondary Schools, as determined by the Bureau of Labor Statistics in the U.S. Department of Labor, for the previous 12-month period ending June 30. For a school district with a market value/personal income aid ratio (MV/PI AR) greater than 0.4000, its index equals the base index multiplied by the sum of .75 and its MV/PI AR for the current year.[407]
In June 2011, the Pennsylvania General Assembly passed legislation eliminating six of the exceptions to the Act 1 Index.[408] Several exceptions were maintained: 1) costs to pay interest and principal on indebtedness incurred prior to September 4, 2004 for Act 72 schools and prior to June 27, 2006 for non-Act 72 schools; 2) costs to pay interest and principal on electoral debt; 3) costs incurred in providing special education programs and services (beyond what is already paid by the State); and 4) costs due to increases of more than the Index in the school's share of payments to PSERS (PA school employees pension fund) taking into account the state mandated PSERS contribution rate.[409][410] The legislature also froze the payroll amount public school districts use to calculate the pension-plan exception at the 2012 payroll levels. Further increases in payroll cannot be used to raise the district's exception for pension payments.
A specific timeline for Act I Index decisions is published annually, by the Pennsylvania Department of Education.[411]
The School District Adjusted Index for the Abington Heights School District 2006-2007 through 2010–2011.[412]
|
|
For the 2017-18 budget year, Abington Heights School Board once again did not apply for exceptions to exceed the District's Act 1 Index limit.[423] Statewide 356 school districts adopted a resolution to not exceed their Act I index in 2017–18. In 2017–18, all Pennsylvania public school districts were required to make a 32.85% of payroll payment to the teacher's pension fund (PSERS).[424] This was in addition to the 6.2% social security employer match payment and the Medicare match of 1.45%.[425][426]
For the 2016-17 budget year, Abington Heights School Board did not apply for any exceptions to exceed the District's Act 1 Index limit.[423] Statewide 299 school districts adopted a resolution to not exceed their Act I index in 2016–17. In 2016–17, all Pennsylvania public school districts were required to make a 30.03% of payroll payment to the teacher's pension fund (PSERS).[424] This was in addition to the 6.02% social security employer match payment.[425]
For the 2015-16 budget year, Abington Heights School Board did not apply for exceptions to exceed their Act 1 Index limit. For the school budget 2015–16, 310 Pennsylvania public school districts adopted a resolution certifying that tax rates would not be increased above its Act 1 Index limit. Another 187 school districts adopted a preliminary budget leaving open the option of exceeding the Index limit. Regarding the pension costs exception, 172 school districts received approval to exceed the Index limit in full, while others received a partial approval of their request. For special education costs, 119 districts received approval to exceed their tax limit. No Pennsylvania public school districts received an approval for the grandfathered construction debts exception.[427]
For the 2014-15 budget year, Abington Heights School Board did not apply for exceptions to exceed their Act 1 Index limit. In 2014–15, all Pennsylvania school districts were required to make a 21.4% of payroll payment to the teacher's pension fund (PSERS).[428] For the school budget 2014–15, 316 Pennsylvania public school districts adopted a resolution certifying that tax rates would not be increased above its Act 1 Index limit. Another 181 school districts adopted a preliminary budget leaving open the option of exceeding the Index limit. Districts may apply for multiple exceptions each year. For the pension costs exception, 163 school districts received approval to exceed the Index in full, while others received a partial approval of their request. For special education costs, 104 districts received approval to exceed their tax limit. Seven Pennsylvania public school districts received an approval for the grandfathered construction debts exception.[429]
For the 2013-14 budget year, Abington Heights School Board did not apply for exceptions to exceed their Act 1 Index limit. In 2013–14, all Pennsylvania school districts were required to make a 16.93% of payroll payment to the teacher's pension fund (PSERS). For the school budget year 2013–14, 311 Pennsylvania public school districts adopted a resolution certifying that tax rates would not be increased above their index. Another 171 school districts adopted a preliminary budget leaving open the option of exceeded the Index limit. For the pension costs exception, 169 school districts received approval to exceed the Index. For special education costs, 75 districts received approval to exceed their tax limit. Eleven Pennsylvania public school districts received an approval for grandfathered construction debts.[430]
For the 2012-13 budget year, Abington Heights School Board did not apply for exceptions to exceed the Act 1 Index. In 2012–13, all Pennsylvania school districts were required to make a 12.36% of payroll payment to the teacher's pension fund (PSERS). For 2012-2013 budget year, 274 school districts adopted a resolution certifying that tax rates would not be increased above their index; while 223 school districts adopted a preliminary budget leaving open the option of exceeded the Index limit. For the exception for pension costs, 194 school districts received approval to exceed the Index. For special education costs, 129 districts received approval to exceed the tax limit.[431]
For the 2011–12 school year, Abington Heights School Board did not apply for an exception to exceed the Act 1 Index. In 2011–12, all Pennsylvania school districts were required to make an 8.65% of payroll payment to the teacher's pension fund. Each year, the School Board has the option of adopting either: 1) a resolution in January certifying they will not increase taxes above their index or 2) a preliminary budget in February. A school district adopting the resolution may not apply for referendum exceptions or ask voters for a tax increase above the inflation index.
According to a state report, for the 2011–2012 school year budgets, 247 school districts adopted a resolution certifying that tax rates would not be increased above their index; 250 school districts adopted a preliminary budget. Of the 250 school districts that adopted a preliminary budget, 231 adopted real estate tax rates that exceeded their index. Tax rate increases in the other 19 school districts that adopted a preliminary budget did not exceed the school district's index. Of the districts who sought exceptions: 221 used the pension costs exemption and 171 sought a Special Education costs exemption. Only 1 school district sought an exemption for Nonacademic School Construction Project, while 1 sought an exception for Electoral debt for school construction.[432]
Abington Heights School Board did not apply for exceptions to exceed the Act 1 index for the budgets in 2009-10 or in 2010–11.[433][434] In the Spring of 2010, 135 Pennsylvania school boards asked to exceed their adjusted index. Approval was granted to 133 of them and 128 sought an exception for pension costs increases.[435]
Property tax relief
In 2016, Abington Heights School District approved 6,602 homestead properties received $123 each.[436] Among Lackawanna County public school districts, Scranton School District property owners were awarded the highest property tax relief - $337 per homestead. The tax relief was subtracted from the total annual school property on the individual's tax bill. Property owners apply for the relief through the county Treasurer's office. Farmers can qualify for a farmstead exemption on building used for agricultural purposes. The farm must be at least 10 contiguous acres (40,000 m2) and must be the primary residence of the owner. Farmers can qualify for both the homestead exemption and the farmstead exemption. Pennsylvania again awarded the highest property tax relief statewide to the residents of the Chester-Upland School District at $653 per homestead and farmstead in 2010.
In 2009, the Homestead/Farmstead Property Tax Relief from gambling for the Abington Heights School District was $128 per approved permanent primary residence. In the district, 6,419 property owners applied for the tax relief.[437] In Lackawanna County, the highest property tax relief in 2009 was awarded to the approved property owners in Scranton School District who received $334. Pennsylvania awarded the highest property tax relief statewide to the residents of the Chester-Upland School District in Delaware County at $632 per homestead and farmstead in 2010.[438] This was the second year Chester Upland School District was the top recipient.
History
The origins of the Abington Heights School District date to the founding of Clarks Summit (and later Clarks Green), the two largest boroughs in the district. Both were founded during the early 20th century and attribute their name to Captain William Clark, a revolutionary war veteran from Rhode Island. Col. Ebbings from Connecticut founded the Abington Area in the late 18th century. It was originally called "Ebbington" and later changed to "Abington." Waverly was one of the earliest villages of the Abingtons and later came the establishment of Bailey Hollow (presently called Dalton) in the 19th century and Clarks Summit and Clarks Green in the early 20th century.
The first high school in the Abingtons was built in 1875, and was called "Abington High School." In 1883, it was struck by lightning and burned to the ground. Another high school in the Abingtons, the Dalton High School, was completed in 1887 and closed down in 1930. The Abington Heights School District was formed in the early 1950s from four former school districts: Clarks Summit-Abington, Glenburn, South Abington, and Newton-Ransom. Abington Heights High School was completed in 1966. Over the next several decades, renovations and changes were made. Today there are six schools in the district along with one administration building.
The mascot for Abington Heights is Comet, while the colors are blue and white. The Comet comes from the original Clarks Summit High School Comets, prior to the establishment of Abington Heights.
Extracurriculars
Abington Heights School District offers a variety of clubs, activities and sports. Eligibility to participate is set by school board policies.[439]
By Pennsylvania law, all K-12 students in the district, including those who attend a private nonpublic school, cyber charter school, charter school and those homeschooled, are eligible to participate in the extracurricular programs, including all athletics. They must meet the same eligibility rules as the students enrolled in the district's schools.[440]
Abington Heights School District has been identified two separate times as one of the top 100 places to live in America for quality music education according to a nationwide survey of public and private school programs. The High School Orchestra and Chorus enjoy a strong regional and state reputation and a strong student interest.
Athletics
Abington Heights is a PIAA District 2 school district which actively participates in the following sports:
| Boys' Athletics | Girls' Athletics |
| Baseball | Softball |
| Basketball | Basketball |
| Cross Country | Cross Country |
| Football | Field Hockey |
| Golf | Golf |
| Powerlifting | |
| Soccer | Soccer |
| Tennis | Tennis |
| Winter Track and Field | Winter Track and Field |
| Spring Track and Field | Spring Track and Field |
| Unified Outdoor Track | Unified Outdoor Track |
| Volleyball | Volleyball |
| Wrestling | |
| Cheerleading | |
| Swimming and Diving | Swimming and Diving |
| Lacrosse | Lacrosse |
Regions and constituent municipalities
The district is divided into three regions, which include the following municipalities:[441] Three school board directors are elected from each region.
- Region I
- Clarks Green Borough
- Clarks Summit Borough (partially in Region II)
- Glenburn Township
- North Abington Township
- Waverly Township
- Region II
- Clarks Summit Borough (partially in Region I)
- Newton Township
- Ransom Township
- South Abington Township (partially in Region III)
- Region III
- South Abington Township (partially in Region II)
References
- PDE, ED Names and Addresses, 2017
- Abington Journal (July 3, 2017). "Abington Heights School Board approves 2017-18 budget with tax increase".
- MICHAEL IORFINO (June 26, 2014). "Abington Heights adopts budget without tax increase". The Times-Tribune.
- The Times Tribune, Abington heights school district passes $42.45 million budget, June 28, 2012
- PDE (2016). "Abington Heights School District Fast Facts".
- Pennsylvania Department of Education (October 4, 2013). "Abington Heights School District Fast Fats 2013".
- Pennsylvania Department of Education School District Enrollment and projections, January 2009
- National Center for Education Statistics, Common Core of Data - Abington Heights School District, 2012
- National Center for Education Statistics, Common Core of Data - Abington Heights School District 2011-2012, July 2014
- US Census Bureau, 2010 Census Poverty Data by Local Educational Agency, 2011
- proximityone (2014). "School District Comparative Analysis Profiles".
- "Poverty Guidelines | ASPE". Aspe.hhs.gov. 2018-01-13. Retrieved 2018-04-03.
- Pennsylvania Budget and Policy Center, Education Facts Student Poverty Concentration by LEA, 2012
- Collin Deppen (January 2015). "How many children are homeless in your school district?" (PDF). Pennsylvania Department of Education.
- US Census Bureau, American Fact Finder, 2009
- US Census Bureau (2010). "American Fact Finder, State and County quick facts". Archived from the original on 2014-10-06. Retrieved 2017-09-14.
- US Census Bureau (September 2011). "Income, Poverty, and Health Insurance Coverage in the United States: 2010" (PDF).
- US Census Bureau (2014). "Pennsylvania Median household income, 2006-2010 by County".
- Michael Sauter & Alexander E.M. Hess (August 31, 2013). "America's most popular six-figure jobs". USA Today.
- Pennsylvania Auditor General (2015). "Abington Heights School District Performance Audit" (PDF).
- "News - Community Websites". The Times-Tribune. Retrieved 2018-04-03.
- Pennsylvania Public School Code Governance 2010
- US Department of Education (2015). "Every Student Succeeds Act".
- Pennsylvania General Assembly (2012). "Act of Jul. 12, 2012, P.L. 1142, No. 141 Section 921-A".
- Pennsylvania General Assembly, Pennsylvania School Code, 2013
- Pennsylvania General Assembly (2012). "Act of Jul. 12, 2012, P.L. 1142, No. 141".
- PAMLE (2017). "Schools To Watch".
- "Teachers". Abington Heights School District. GreatSchools Inc. 2008. Archived from the original on 26 May 2008. Retrieved 2008-06-09.
- "Students". Abington Heights School District. GreatSchools Inc. 2008. Archived from the original on 26 May 2008. Retrieved 2008-06-09.
- Pat Farnelli (March 23, 2011). "Crowd pleads for all-day kindergarten". The Times-Shamrock. Archived from the original on April 27, 2011.
- Pittsburgh Business Times (April 12, 2016). "Chester County district leads statewide Honor Roll 2016".
- Pittsburgh Business Times (April 11, 2014). "What makes up a district's School Performance Profile score?".
- Paul Jablow (November 18, 2015). "Understanding the PSSA exams". The Notebook.
- Pittsburgh Business Times (April 10, 2015). "Guide to Pennsylvania Schools Statewide School District Ranking 2015".
- Pittsburgh Business Times (April 11, 2014). "Western Pennsylvania School Guide 2014".
- Pittsburgh Business Times (April 5, 2013). "Guide to Pennsylvania Schools Statewide ranking 2013".
- Pittsburgh Business Times, Statewide Honor Roll Rankings 2012, April 4, 2012
- Pittsburgh Business Times, Statewide Honor Roll Rankings 2011, April 2, 2011
- Pittsburgh Business Times, Pennsylvania School District Rankings 2010, May 1, 2010
- "Three of top school districts in state hail from Allegheny County". Pittsburgh Business Times. May 23, 2007.
- Augenblick, Palaich and Associates, Inc. (December 2007). "Costing out the Resources need to meet Pennsylvania's Public Education Goals" (PDF).
- Pittsburgh Business Times, Overachiever statewide ranking, April 11, 2011
- Pittsburgh Business Times. (May 6, 2010). "Overachiever statewide ranking".
- Liz Hayes and Jody Weigand (July 13, 2011). "New Kensington-Arnold 'flagged' for test scores". TribLIVE.
- Notebook.com (July 15, 2011). "List of 89 Pa. schools to be investigated".
- Christopher Paslay (March 3, 2012). "State Has Double Standard When It Comes to Cheating on PSSA". Chalk and Talk.
- SARAH HOFIUS HALL (September 12, 2012). "Scranton under investigation for possibly cheating on state tests". The Times Tribune.
- Karen Graham and Dylan Purcell., PSSA-cheating reforms yield lower scores across Pa., Philadelphia inquirer, July 30, 2012
- Eleanor Chute and Mary Niederberger (September 9, 2012). "Inquiry continues into cheating on PSSA tests". Pittsburgh Post Gazette.
- USA Today (July 13, 2011). "Pa. looking into possible cheating on state tests".
- Data Recognition Corporation (July 2009). "Data Forensics Technical Report" (PDF). Archived from the original (PDF) on 2016-03-05. Retrieved 2017-09-14.
- Pennsylvania Department of Education, Abington Heights School District AYP Overview 2012, September 21, 2012
- Pennsylvania Department of Education, Pennsylvania Public School District AYP History, 2011
- Pennsylvania Department of Education, Abington Heights School District AYP Overview 2005, 2005
- Pennsylvania Department of Education, Abington Heights School District AYP Overview 2004, 2004
- Pennsylvania Department of Education, Pennsylvania District AYP History 2003-2010, 2011
- PDE, Graduation rate by LEA, 2016
- PDE, Graduation rate by LEA, 2015
- Emma Brown (October 16, 2016). "Nation's high school graduation rate reaches new record high". Washington Post.
- PDE, Graduation rate by LEA, 2014
- PDE, Graduation rate by LEA, 2013
- Pennsylvania Department of Education (September 21, 2012). "Abington Heights School District AYP Data Table 2012". Archived from the original on October 8, 2012.
- Pennsylvania Department of Education (March 15, 2011). "New 4-year Cohort Graduation Rate Calculation Now Being Implemented".
- Pennsylvania Department of Education, Abington Heights High School School AYP Data Table 2010, October 20, 2010
- The Times-Tribune (June 27, 2010). "PA School District Statistical Snapshot Database 2008-09".
- The Times tribune (June 25, 2009). "Grading our Schools".
- Pennsylvania Partnerships for Children (2008). "High School Graduation rate 2007" (PDF). Archived from the original (PDF) on 2012-05-07. Retrieved 2013-04-21.
- Pennsylvania Department of Education (November 14, 2016). "Abington Heights High School Fast Facts 2016".
- US News and World Report, Best High Schools, 2016
- Pennsylvania Department of Education (2015). "Highly Qualified Teacher Guidelines". Archived from the original on 2016-06-24.
- Pennsylvania Department of Education (October 4, 2013). "Abington Heights High School Fast Facts 2013".
- US News and World Report, Best High Schools, 2013
- National Center for Education Statistics, Common Core Data - Abington Heights High School, 2011-2012
- Pennsylvania Department of Education, Professional Qualifications of Teachers Abington Heights High School 2012, September 21, 2012
- Pennsylvania Department of Education (September 29, 2016). "2016 PSSA AND KEYSTONE Results".
- Pennsylvania Department of Education (August 2016). "Findings and Recommendations Pursuant to Act 1 of 2016" (PDF).
- Jan Murphy (October 16, 2016). "How District schools fared overall".
- Pennsylvania Department of Education (November 4, 2015). "Abington Heights High School School Performance Profile 2015 Historical information".
- MARK GILGER JR (July 6, 2016). "Grading Our Schools: Some districts struggle with standardized tests". The Republican Herald.
- Jan Murphy (November 4, 2015). "Report card for state's high schools show overall decline". Pennlive.com.
- Pennsylvania Department of Education (November 4, 2015). "2015 Keystone Exam School Level Data".
- Pennsylvania Department of Education (November 6, 2014). "Abington Heights High School Academic Performance Data 2014".
- Eleanor Chute (November 21, 2014). "Pennsylvania student scores declined with reduced funding, test results show". Pittsburgh Post-Gazette.
- Pennsylvania Department of Education (October 4, 2013). "Abington Heights High School Academic Performance Data 2013".
- Eleanor Chute; Mary Niederberger (December 11, 2013). "New assessment shows fuller picture of Pa. schools". Pittsburgh Post-Gazette.
- PDE, Abington Heights High School AYP Overview 2012, September 21, 2012
- Pennsylvania Department of Education, Abington Heights High School Academic Report Card 2011, September 29, 2011
- Pennsylvania Department of Education, Abington Heights High School AYP Overview 2009, September 14, 2009
- Pennsylvania Department of Education (2014). "State Academic Standards".
- Pennsylvania Department of Education (2014). "State Assessment System".
- Pennsylvania Department of Education (September 29, 2012). "2011-2012 PSSA and AYP Results".
- Pennsylvania Department of Education (September 29, 2011). "2010-2011 PSSA and AYP Results".
- Pennsylvania Department of Education. "Report on Math and Reading PSSA results by school and grade 2007".
- "How is your school doing?". Pittsburgh Post-Gazette. October 15, 2012.
- Pennsylvania Department of Education, Abington Heights High School Academic Achievement Report Card 2011, September 29, 2011
- Pennsylvania Department of Education (September 29, 2009). "2009 PSSAs: Reading, Math, Writing and Science Results 2009".
- Pennsylvania Department of Education, Abington Heights High School Academic Achievement Report Card 2012, September 21, 2012
- Pennsylvania Department of Education (September 29, 2011). "2010-2011 PSSA results in Science".
- Pennsylvania Department of Education (2008). "Report on PSSA Science results by school and grade 2008".
- The Pennsylvania Basic Education/Higher Education Science and Technology Partnership, Science in Motion annual report, 2012
- Jan Murphy (January 30, 2009). "Report: One-third of local high schoolers unprepared for college". Pennlive.com.
- Pennsylvania Department of Education (January 20, 2009). "Pennsylvania College Remediation Report 2009".
- Achieve.org (2014). "THE VALUE OF THE COLLEGE- AND CAREER-READY AGENDA IN PENNSYLVANIA" (PDF).
- National Center for Education Statistics
- Pennsylvania Department of Education. "Dual Enrollment Guidelines". Archived from the original on 2014-10-17.
- "Pennsylvania Transfer and Articulation Agreement". March 2010.
- Pennsylvania State Board of Education. "Pennsylvania Code §4.24 (a) High school graduation requirements".
- Pennsylvania State Board of Education, Proposed changes to Chapter 4, May 10, 2012
- Jan Murphy (February 3, 2016). "Wolf signs bill to suspend use of Keystone Exams as a graduation requirement". Pennlive.com.
- Pennlive.com (July 12, 2017). "School code bill awaiting action".
- Pennsylvania Department of Education (2010). "Keystone Exam Overview" (PDF).
- Megan Harris (September 12, 2013). "Pennsylvania changing high school graduation requirements". Tribune Live.
- Pennsylvania Department of Education (2010). "Keystone Exam Overview" (PDF).
- "State moves ahead with plan to delay Keystone Exams as graduation requirement". Associated Press. January 20, 2016.
- Pennsylvania Department of Education (September 2011). "Pennsylvania Keystone Exams Overview".
- Pennsylvania State Board of Education (2010). "Rules and Regulation Title 22 PA School Code CH. 4".
- PA General Assembly, Act 6 of 2017, June 21, 2017
- Pennsylvania Department of Education (2011). "Keystone Exams".
- Representative Mike Turzai (2017). "House Bill 202 of 2017".
- Natosha Lindstrom (June 13, 2017). "Wolf to sign law granting career-track students alternatives to Keystone exit exams". TribLive.
- Karen Langley (June 22, 2017). "New law would allow some Pennsylvania students to finish high school without Keystone exams". Pittsburgh Post-Gazette.
- Pennsylvania Department of Education (2016). "SAT and AP Scores 2016".
- College Board (2017). "SAT 2016 Total Group report Pennsylvania". Archived from the original on 2017-08-02.
- College Board, Class of 2016 SAT Participation and Performance Data, 2017
- Pennsylvania Department of Education (2015). "SAT and AP Scores 2015".
- College Board, SAT 2015 Total Group report Pennsylvania, 2016
- PDE, School Performance profile, November 6, 2014
- Pennsylvania Department of Education (2014). "SAT and ACT Scores".
- College Board (2014). "2014 College-Bound Seniors State Profile Report" (PDF).
- College Board (2013). "The 2013 SAT Report on College & Career Readiness".
- Pennsylvania Department of Education (2011). "Public School SAT Scores 2011".
- College Board, SAT Scores State By State - Pennsylvania, September 15, 2011
- "While U.S. SAT scores dip across the board, N.J. test-takers hold steady". NJ.com. September 15, 2011.
- PDE, School Performance Profile 2013 - Academic Performance Data - Abington Heights High School, December 2013
- PDE, School Performance Profile 2014 - Academic Performance Data - Abington Heights High School, 2014
- PDE, School Performance Profile 2015 - Academic Performance Data - Abington Heights High School, November 2015
- PDE, School Performance Profile 2016 - Academic Performance Data - Abington Heights High School, November 2016
- Pennsylvania Department of Education (October 14, 2016). "Abington Heights Middle School Fast Facts 2016".
- Pennsylvania Department of Education, Professional Qualifications of Teachers Abington Heights Middle School, November 15, 2016
- Pennsylvania Department of Education (October 4, 2013). "Abington Heights Middle School School Fast Facts 2013".
- Pennsylvania Department of Education, Professional Qualifications of Teachers Abington Heights Middle School, October 4, 2013
- National Center for Education Statistics, Common Core Data – Abington Heights Middle School, 2011
- Pennsylvania Department of Education, Professional Qualifications of Teachers Abington Heights Middle School, September 21, 2012
- Pennsylvania Department of Education (September 29, 2016). "2016 PSSA AND KEYSTONE Results".
- PR Newswire (2016). "Department of Education Releases Statewide Results on the 2016 Pennsylvania System Of School Assessment (PSSA)".
- Pennsylvania Department of Education (October 1, 2015). "2015 PSSA School Level Data".
- Pennsylvania Department of Education (October 1, 2015). "2015 PSSA State Level Data".
- Pennsylvania Department of Education (November 6, 2014). "Middle School Academic Performance Data 2014".
- Pennsylvania Department of Education (2016). "SPP historical data 2013-2016".
- Pennsylvania Department of Education (October 4, 2013). "Abington Heights Middle School Academic Performance Data 2013".
- Pennsylvania Department of Education, Abington Heights Middle School AYP Overview 2012, September 21, 2012
- US Department of Education (2003). "NCLB Parental Notices".
- Pennsylvania Department of Education (September 21, 2012). "School Improvement Grant".
- Pennsylvania Department of Education, Abington Heights Middle School AYP Overview 2011, September 29, 2011
- Pennsylvania Department of Education, Abington Heights Middle School AYP Overview 2010, October 20, 2010
- Pennsylvania Department of Education, Abington Heights Middle School AYP Overview 2008, August 15, 2008
- Pennsylvania Department of Education, Abington Heights Middle School AYP Overview 2003-2012, 2013
- Pennsylvania Department of Education (May 11, 2014). "PSSA 95-96 Results by School".
- Pennsylvania Department of Education (2014). "Standards Aligned Systems".
- Pennsylvania Department of Education (2014). "State Academic Standards".
- Pennsylvania Department of Education (2014). "State Academic Standards Mathematics".
- The Times-Tribune (2011). "Grading Our Schools database, 2010-11 Reading PSSA results".
- Pennsylvania Department of Education, Abington Heights Middle School Report Card 2010, March 2011
- Pennsylvania Department of Education, Pennsylvania Reading, Math, Science and Writing PSSA Results 2009, September 2009
- Pennsylvania Department of Education, Abington Heights Middle School Academic Achievement Report Card 2012, September 21, 2012
- Pennsylvania Department of Education, Abington Heights Middle School Academic Achievement Report Card 2010, October 20, 2010
- Pennsylvania Department of Education, Abington Heights Middle School Academic Achievement Report Card 2009, September 15, 2009
- Pennsylvania Department of Education, Abington Heights Middle School Academic Achievement Report Card 2008, August 15, 2008
- The Times-Tribune (2012). "Grading Our Schools database, 2011-12 Science PSSA results".
- Pennsylvania Department of Education Report (August 2010). "Science PSSA 2010 by Schools".
- Pennsylvania Department of Education Report (August 2009). "Science PSSA 2009 by Schools".
- National Forum to Accelerate Middle Grades Reform (June 7, 2010). "Schools to Watch".
- Middle Grades forum (2014). "The Schools To Watch Criteria" (PDF).
- Pennsylvania Department of Education (October 14, 2016). "Clarks Summit Elementary School Fast Facts 2016".
- Pennsylvania Department of Education, School Performance Profile, Clarks Summit Elementary School Fast Facts, 2016
- Pennsylvania Department of Education (October 4, 2013). "Clarks Summit Elementary School Fast Facts".
- Pennsylvania Department of Education, School Performance Profile, Clarks Summit Elementary School Fast Facts 2013, October 4, 2013
- National Center for Education Statistics, Common Core Data – Clarks Summit Elementary School, 2011
- Pennsylvania Department of Education, Professional Qualifications of Teachers Clarks Summit Elementary School, September 21, 2012
- Pennsylvania Department of Education, 2016 PSSA AND KEYSTONE Results, September 29, 2016
- Jan Murphy (September 29, 2016). "Standardized test scores show Pa. schools have more work to do". Pennlive.com.
- Penasylvania Department of Education (2016). "2016 PSSA AND KEYSTONE RESULTS".
- Pennsylvania Department of Education, 2015 PSSA State Level Data, October 1, 2015
- Pennsylvania Department of Education (November 6, 2014). "Clarks Summit Elementary School Academic Performance Data 2014".
- Pennsylvania Department of Education (October 4, 2013). "Clarks Summit Elementary School Academic Performance Data 2013".
- Pennsylvania Department of Education, Clarks Summit Elementary School AYP Overview 2012, September 21, 2012
- Pennsylvania State Board of Education (2003). "PSSA results 2003".
- New America Foundation (2003). "No Child Left Behind Overview".
- Education.com (Jul 20, 2010). "The Goals of No Child Left Behind". Archived from the original on 2014-05-19. Retrieved 2014-07-26.
- Learning Point Associates (220). "Understanding the No Child Left Behind Act" (PDF).
- Pennsylvania State Board of Education (January 11, 2003). "Pennsylvania Academic Standards Science and Technology, Ecology and Environment". Archived from the original on November 27, 2015.
- Pennsylvania Department of Education, Clarks Summit Elementary School Report Card 2012, September 21, 2012
- Pennsylvania Department of Education, Clarks Summit Elementary School Report Card 2011, September 15, 2011
- Pennsylvania Department of Education, Clarks Summit Elementary School Report Card 2010, October 20, 2010
- Pennsylvania Department of Education (October 14, 2016). "Newton-Ransom School Fast Facts 2016".
- Pennsylvania Department of Education, School Performance Profile, Newton-Ransom School Fast Facts, 2016
- Pennsylvania Department of Education (October 4, 2013). "Newton-Ransom Elementary School Fast Facts".
- Pennsylvania Department of Education, School Performance Profile, Newton-Ransom School Fast Facts 2013, October 4, 2013
- National Center for Education Statistics, Common Core Data – Newton-Ransom School, 2011
- Pennsylvania Department of Education, Professional Qualifications of Teachers Newton-Ransom School, September 21, 2012
- Pennsylvania Department of Education (November 6, 2014). "Newton-Ransom School Academic Performance Data 2014".
- Pennsylvania Department of Education (October 4, 2013). "Newton-Ransom School Academic Performance Data 2013".
- Pennsylvania Department of Education, Newton-Ransom School AYP Overview, September 21, 2012
- Pennsylvania Department of Education, Newton-Ransom School Academic report Card 2012, September 21, 2012
- Pennsylvania Department of Education, Newton-Ransom School Academic Report Card 2011, September 29, 2011
- Pennsylvania Department of Education, Newton-Ransom School Academic Report Card 2010, October 20, 2010
- Pennsylvania Department of Education (October 14, 2016). "South Abington School Fast Facts 2016".
- Pennsylvania Department of Education, School Performance Profile South Abington School Fast Facts, 2016
- Pennsylvania Department of Education (October 4, 2013). "South Abington School Fast Facts".
- Pennsylvania Department of Education, South Abington School Performance Profile, South Abington School Fast Facts, 2013
- National Center for Education Statistics, Common Core Data – South Abington School, 2011
- Pennsylvania Department of Education (November 6, 2014). "South Abington School Academic Performance Data 2014".
- Pennsylvania Department of Education (October 4, 2013). "South Abington School Academic Performance Data 2013".
- Pennsylvania Department of Education, South Abington School AYP Overview, September 21, 2012
- Pennsylvania Department of Education, South Abington School Academic Achievement Report Card 2012, September 21, 2012
- Pennsylvania Department of Education, South Abington School Academic Achievement Report Card 2011, September 29, 2011
- Pennsylvania Department of Education, South Abington School Academic Achievement Report Card 2010, October 20, 2010
- Pennsylvania Department of Education (October 14, 2016). "Waverly School Fast Facts 2016".
- Pennsylvania Department of Education, School Performance Profile, Elementary School Fast Facts, 2016
- Pennsylvania Department of Education (October 4, 2013). "Waverly School Fast Facts 2013".
- Pennsylvania Department of Education, School Performance Profile, Waverly School Fast Facts 2013, October 2013
- National Center for Education Statistics, Common Core Data – Waverly School, 2011
- Pennsylvania Department of Education, Professional Qualifications of Teachers Waverly School, September 21, 2012
- Pennsylvania Partnership for Children, Full-Day Kindergarten Enrollment, 2010
- Pennsylvania Department of Education (November 6, 2014). "Waverly School Academic Performance Data 2014".
- Pennsylvania Department of Education (October 4, 2013). "Waverly School Academic Performance Data 2013".
- Pennsylvania Department of Education, Waverly School AYP Overview 2012, September 21, 2012
- Pennsylvania Department of Education, Waverly School Academic Report Card 2012, September 21, 2012
- Pennsylvania Department of Education, Waverly School Academic Report Card 2011, September 29, 2011
- Pennsylvania Department of Education, Waverly School Academic Report Card 2010, October 20, 2010
- Pennsylvania Bureau of Special Education Services (2017). "Abington Heights School District Special Education Data Report LEA Performance on State Performance Plan (SPP) Targets".
- Pennsylvania Bureau of Special Education Services (2016). "Abington Heights School District Special Education Data Report LEA Performance on State Performance Plan (SPP) Targets".
- Pennsylvania Bureau of Special Education Services (2013). "Abington Heights School District Special Education Data Report LEA Performance on State Performance Plan (SPP) Targets".
- Pennsylvania Bureau of Special Education (January 31, 2011). "Abington Heights School District Special Education Data Report LEA Performance on State Performance Plan (SPP) Targets School Year 2008-2009" (PDF).
- NEIU (2010–2011). "Abington Heights School District Annual Public Notice of Special Education Services". Archived from the original on 2011-10-03.
- "Special Education Report - Abington Heights Strategic Plan" (PDF). July 8, 2009. Archived from the original (PDF) on October 3, 2011.
- Education Law Center (2012). "Key Timelines in the School-Age Special Education System" (PDF). Archived from the original (PDF) on 2016-08-20.
- Pennsylvania Department of Education - School District Administration (January 6, 2011). "Procedural Safeguards Notice". Archived from the original on October 18, 2014. Retrieved September 17, 2017.
- Pennsylvania Department of Education, Bureau of Special Education (September 2005). "Gaskin Settlement Agreement Overview Facts Sheet" (PDF).
- Eleanor Chute., Modified PSSA test in math offered for 1st time, Pittsburgh Post-Gazette, April 18, 2010
- "PSSA and Keystone Exam Accommodation Guidelines for Students with IEPs and 504 Plans". 2015. Archived from the original on 2015-10-25. Retrieved 2017-09-17.
- Pennsylvania Department of Education (December 12, 2014). "PSSA/ Keystone Accommodations Guidelines (PDE) 2015".
- Pennsylvania Department of Education. "Pennsylvania Special Education Funding".
- Amy Morton, Executive Deputy Secretary, Public Hearing: Special Education Funding & Accountability Testimony, Pennsylvania Department of Education, November 11, 2011
- US Department of Education (January 25, 2013). "U.S. Department of Education Clarifies Schools' Obligation to Provide Equal Opportunity to Students with Disabilities to Participate in Extracurricular Athletics".
- Pennsylvania Department of Education (July 2010). "Special Education Funding from Pennsylvania State_2010-2011".
- Pennsylvania Department of Education, Special Education funding report by LEA, July 2014
- Pennsylvania Department of Education, BEF, Special Education Funding, RTL Grants 2016-17, July 2016
- Pennsylvania Department of Education, BEF, Special Education Funding, RTL Grants 2017-18, July 2018
- Special Education Funding Reform Commission (December 11, 2015). "Special Education Funding Reform Commission Report" (PDF).
- Pennsylvania Department of Education Bureau of Special Education, Gifted Students as Percentage of Total Enrollment by School District/Charter School, Revised December 1, 2009 Child Count, July 2010
- Pennsylvania Department of Education; Pennsylvania School Board. "CHAPTER 16. Special Education For Gifted Students". Retrieved February 4, 2011.
- Center for Safe Schools (2013). "School Safety Report 2013 Abington Heights School District" (PDF). Archived from the original (PDF) on 2014-07-29.
- Commonwealth of Pennsylvania Safe School Center (2012). "Pennsylvania Safe Schools Online Reports".
- Safe & Responsive Schools Project (June 20, 2011). "Area high school students create anti-bullying mural". Williamsport Sun Gazette.
- Pennsylvania Center for Safe Schools. "Abington Heights School District Safety Reports 2009" (PDF). Archived from the original (PDF) on 2012-05-01.
- "Pennsylvania Safe Schools Online Reports".
- "Abington Heights School Board Bullying Policy" (PDF). Archived from the original (PDF) on 2011-10-03.
- Pennsylvania General Assembly. "Regular Session 2007-2008 House Bill 1067, Act 61 Section 6 page 8".
- Center for Safe Schools of Pennsylvania. "Bullying Prevention advisory". Archived from the original on 2011-01-21. Retrieved 2011-04-22.
- Pennsylvania State Board of Education. "Pennsylvania Academic Standards".
- Pennsylvania General Assembly, Taxpayer Relief Act, Act 1 of the Special Session of 2006, June 27, 2006
- WNEP.com TV16 (September 12, 2017). "Abington Heights Teachers on Strike".
- The Times Tribune (September 2017). "YOur Guide to the Abington Heights teacher strike".
- WNEPTV (September 8, 2017). "Abington Heights Teachers and District At Odds Over Contracts".
- CNN, Why everyone wants to kill Obamacare's Cadillac tax, December 18, 2015
- Dan Sheehan (January 5, 2017). "Strike looms in Palmerton Area School District". The Morning Call.
- "Teachers strike in Pennsylvania's Highlands School District". KSL.com. April 13, 2016.
- CBSPittsburgh, Teachers On Strike In Ambridge, Schools Closed, December 13, 2016
- Sarah buynovsky (March 28, 2016). "Teachers to Strike in Montrose Area". WNEP.com 16.
- YourErie.com (October 6, 2016). "Strike: Warren County teachers hit the picket line".
- WNEP.com TV16 (December 18, 2016). "Teachers Strike Ends in Dallas School District".
- StarGazette (April 12, 2016). "Sayre schools closed, teachers on strike".
- "Abington Heights School District Payroll report 2016". OpenPA Gov.org. 2016. Archived from the original on 2010-11-19. Retrieved 2011-04-22.
- Times Tribune (June 16, 2013). "PA Teacher Profile Database 2011-12".
- Pennsylvania School Employees Retirement System (2014). "Your PSERS Benefits & Leaving Employment".
- American Enterprise Institute (November 1, 2011). "Assessing the Compensation of Public School Teachers".
- Andrew G. Biggs (October 6, 2016). "Debunking the myth of the 'teacher pay gap,' again". Education Next.
- PSERS Board of Trustees (2015). "Fiscal Year 2015/2016 Employer Contribution Rate" (PDF).
- PSERS Board of Trustees (2017). "Fiscal Year 2017/2018 Employer Contribution Rate" (PDF). Archived from the original (PDF) on 2017-03-21.
- WNEPTV16, Abington Heights Teachers, Board Reach Deal, September 19, 2014
- Brittany Lovette (July 18, 2014). "Teachers Picketing for Health Care in Lackawanna County". WNEP.com.
- MICHAEL IORFINO (May 31, 2014). "Abington Heights union rejects fact-finding report". The Times Tribune.
- Pennsylvania Labor Relations Board (2014). "2014 Fact Finding Reports".
- Allegheny Institute for Public Policy (May 2012). "Teacher Strikes".
- Mary Niederberger., Laws, tax limits hinder negotiations, Pittsburgh Post-Gazette, September 5, 2013
- Pennsylvania Department of Education, Investing in Pennsylvania Students 2014, July 2014
- "Abington Heights School District Payroll report 2012". OpenPA Gov.org. 2013. Archived from the original on 2010-11-19. Retrieved 2011-04-22.
- "Abington Heights School Payroll report". Asbury Park Press. Retrieved April 21, 2011.
- Teachers need to know enough is enough, PaDelcoTimes, April 20, 2010.
- "Abington Heights School District Teachers Union Employment Contract 2011". Archived from the original on 2010-11-19. Retrieved 2011-04-22.
- "Legislature must act on educators' pension hole". The Patriot News. February 21, 2010.
- Fenton, Jacob. "Average classroom teacher salary in Lackawanna County, 2006-07". The Morning Call. Archived from the original on 14 July 2011. Retrieved September 29, 2016.
- Fenton, Jacob. Pennsylvania School District Data: Will School Consolidation Save Money?, The Morning Call, Feb 2009.
- Pennsylvania School Board Association (October 2009). "Public School Salaries 11th Annual".
- "Per Pupil Spending in Pennsylvania Public Schools in 2008 Sort by Administrative Spending". Archived from the original on 2014-10-07.
- Pennsylvania Department of Education (2010). "2009-10 Selected Data - 2009-10 Total Expenditures per ADM".
- US Census Bureau, States Ranked According to Per Pupil Public Elementary-Secondary School System Finance Amounts: Fiscal Year 2011, May 2013
- US Census Bureau (2009). "Total and current expenditures per pupil in fall enrollment in public elementary and secondary education, by function and state or jurisdiction: 2006-07".
- Pennsylvania Department of Education. "Fund Balances by Local Education Agency 1997 to 2008". Archived from the original on 2014-10-21.
- PDE, Investing in Pennsylvania Students 2014, July 2014
- Jan Murphy (June 15, 2016). "Search the database: How much is in your school district's fund balance?".
- James Paul (June 15, 2016). "School Districts Amass Record Reserve Funds". Commonwealth Foundation.
- Murphy, Jan., Pennsylvania's public schools boost reserves, CentreDaily Times, September 22, 2010
- John Baer (December 9, 2013). "Pa. schools and $$ behind the curtain". Philadelphia Daily News.
- Melissa Daniels (June 1, 2013). "PA school districts look to cash stash to balance budgets". PA Independent. Archived from the original on August 26, 2013.
- "Abington Heights School District LACKAWANNA COUNTY, PENNSYLVANIA PERFORMANCE AUDIT REPORT". December 2010.
- "Abington Heights School District Lackawanna County, PENNSYLVANIA PERFORMANCE AUDIT REPORT". April 2013.
- Pennsylvania Department of Education (May 2013). "Pennsylvania Public School District Tuition Rates".
- Pennsylvania Department of Education (May 2015). "Pennsylvania Public School District Tuition Rates For Use During the 2014-2015 Fiscal Year".
- Pennsylvania Department of Education (May 2015). "Pennsylvania Public School District Tuition Rates 2015-16".
- Penn State Cooperative Extension (2010). "What are the Local Taxes in Pennsylvania?, Local Tax Reform Education Project" (PDF).
- Pennsylvania Department of Revenue (April 2010). "Personal Income Taxation Guidelines".
- John Finnerty (2013). "PA teachers pensions". CNHI Harrisburg Bureau.
- Herald-Mail Media (February 24, 2016). "Kauffman law exempts military pay from Pa. earned-income taxes".
- Myle Snyder (February 23, 2016). "Gov. Wolf signs bill to exempt active duty military pay from local tax". ABC27 News.
- Pennsylvania Representative Todd Stephens (January 23, 2014). "LEEF Funding Chart 2014".
- Basic Education Funding Commission, Commission minutes, 2016
- York Dispatch, Governor Wolf Signs Fair Funding Formula, June 2016
- Pennsylvania General Assembly (June 2016). "House Bill 1552, Act 35 of 2016".
- Finnerty, John (July 1, 2017). "Spending plan heads to Wolf, but fight over funding remains". The Daily Item.
- PDE, 2017-18 Education Distributions: Basic, Special, RTL by LEA, August 2017
- Pennsylvania Department of Education, Education Budget 2017-18, July 2017
- PDE, Special Education Funding fiscal year 2017-18, July 2017
- PA Office of Budget (July 2016). "Commonwealth 2016-17 Enacted Budget Line-Item Appropriations" (PDF).
- Charles Thompson (June 30, 2017). "Pennsylvania state lawmakers start chewing into $32 billion, agreed-to budget proposal". Pennlive.com.
- Pennsylvania Department of Education, Education Budget 2016-17, July 2016
- PDE, Special Education Funding fiscal year 2016-17, July 2017
- PA Office of Budget, Commonwealth 2016-17 Enacted Budget Line-Item Appropriations, July 2016
- Jan Murphey (January 4, 2016). "Here's the payout your school district gets from the partial 2015-16 state budget". Pennlive.com.
- Jennifer Wakeman (January 4, 2016). "Harrisburg releases $3.3 billion in delayed funds".
- Pennsylvania General Assembly (June 26, 2015). "Basic Education Funding Commission".
- Jan Murphy (January 6, 2016). "School funding distribution gives rise to new battle between Wolf, GOP lawmakers". PennLive.com.
- Pennsylvania Department of Education (January 2016). "Summary of State Appropriations for Education 2015-2016 Fiscal Year Education Budget".
- Pennsylvania Department of Education, EdBudget 2015-16 BEF, April 6, 2016
- Jan Murphy (April 6, 2016). "Governor's 2015-16 Basic Education Funding & Ready to Learn Block Grant Distributions Compared to HB1801 Distributions" (PDF). Pennlive.com.
- Jan Murphy (April 6, 2016). "Here's what the difference between school funding formulas means to your district".
- Office of the Budget, Pennsylvania Total Operating Budget, March 2016
- Jan Murphy (April 15, 2016). "House, Senate cast veto-proof majority votes on school funding bill". Pennlive.com.
- PDE, Ed Budget 2015-16 , May 2016
- PDE, Enacted Education Budget 2014-2015, July 7, 2014
- Pennsylvania Department of Education, 2014-15 Enacted Education Budget Fast Facts, July 14, 2014
- Democrat Appropriations Committee, Report on Education funding by LEA, July 2, 2013
- Sam Wood; Brian X. McCrone (January 29, 2014). "Montgomery County lawmaker proposes using Pa. horse racing funds for education". The Philadelphia Inquirer.
- Pennsylvania Office of the Budget, 2013-14 State Budget Highlights, 2013
- Senator Jake Corman Appropriations Committee chairman, Pennsylvania Education funding by Local School District, June 28, 2012
- Pennsylvania Department of Education (2012). "Pennsylvania Basic Ed Funding 2012-13".
- Pennsylvania General Assembly Sen Jake Corman (June 29, 2012). "SB1466 of 2012 General Fund Appropriation".
- Jake Corman PA Senate Appropriations Committee, School District 2011-12 Funding Report, June 28, 2011
- Pennsylvania Department of Education (July 2011). "Basic Education Funding".
- Pennsylvania Department of Education (June 30, 2011). "Basic Education Funding".
- Pennsylvania Department of Education (June 30, 2011). "Basic Education Funding 2011-2012 Fiscal Year".
- Pennsylvania Department of Education, District Allocations Report 2009, 2009-10
- Pennsylvania House Appropriations Committee (August 2010). "PA House Appropriations Committee Basic Education Funding-Printout2 2010-2011". Archived from the original on 2014-10-08.
- Office of Budget (February 2010). "Pennsylvania Budget Proposal".
- "Pennsylvania Department of Education Report on Funding by school district". October 2009. Archived from the original on 2013-10-15.
- Pennsylvania Department of Education Funding Report by LEA 2009.
- Pennsylvania Department of Education. "Accountability Block Grant report 2010, Grantee list 2010".
- Pennsylvania Department of Education. "Accountability Block Grant Mid Year report". Archived from the original on 2013-10-15.
- Pennsylvania Department of Education (2013). "Passport for Learning Block Grant".
- PDE, Ready To Learn Grants, 2013
- PDE, Ready To Learn Grants, 2016
- PDE, Ready To Learn Grants, 2017
- Pennsylvania Auditor General (2008-12-22). "Special Performance Audit Classrooms For the Future grants" (PDF).
- Department of Environmental Protection, Environmental Education Grants, 2014
- Pennsylvania Department of Environmental Protection, Governor Corbett Awards 92 Grants for Environmental Education and Stewardship, April 22, 2013
- Pennsylvania Department of Education, Science: It’s Elementary Grantees Students in 143 Schools Benefit from Intensive Science Curriculum, July 22, 2008
- Pennsylvania Department of Education, Pennsylvania Awards $36.1 Million to Strengthen Literacy Programs, May 23, 2012
- Pennsylvania Department of Education Press Office (October 17, 2013). "Acting Secretary of Education Says Hybrid Learning Benefits Students; Highlights Success of First-Year Pilot Program".
- PSEA (2006). "Project 720 PDE Education Improvement Initiative Series" (PDF). Archived from the original (PDF) on 2016-03-04.
- Commonwealth of Pennsylvania, County ARRA FUNDING Report, 2009
- ProPublica (2009). "Recovery Tracker Eye on the stimulus". Archived from the original on 2017-01-20.
- "School stimulus money". Pittsburgh Post-Gazette. March 12, 2009.
- Governor's Press Office release (January 20, 2010). "Pennsylvania's 'Race to the Top' Fueled by Effective Reforms, Strong Local Support".
- Race to the Top Fund, U.S. Department of Education, March 29, 2010.
- Dr. Gerald Zahorchak (December 2008). "Pennsylvania Race to the Top Letter to Superintendents" (PDF).
- Pennsylvania Department of Education, Pennsylvania Race to the Top - School Districts Title I Allocations 2009-10, January 19, 2009
- PDE (2015). "TITLE II, PART A - TEACHER AND PRINCIAL TRAINING & RECRUITING".
- PDE (2015). "Federal Programs".
- PDE, Title IIA egrants 2012-13, 2012
- PDE, Title IIA egrants 2014-15, 2014
- US Department of Education (September 15, 2004). "Title III — Language Instruction for Limited English Proficient and Immigrant Students".
- PDE, English As A Second Language (ESL), 2015
- Pennsylvania Department of Education (July 1, 2009). "Educating Students with Limited English Proficiency" (PDF).
- PDE (2015). "Title III Supplemental Program".
- PDE, Title III Grant Allocations 2014-15, 2014
- Pennsylvania Department of Education. "Common Cents program - Making Every Dollar Count". Retrieved February 1, 2011.
- Robert Tomkavage (July 3, 2017). "Abington Heights School Board approves 2017-18 budget with tax increase". Abington Journal.
- Pennsylvania Department of Education (2012). "Real Estate Tax Rates by School District 2012-13 Real Estate Mills".
- Katie Colaneri (June 11, 2015). "New pipeline could mean tax bonanza for NJ towns, but for Pa.? Not so much". State Impact NPR.org.
- Pennsylvania Department of Education. "Act 511 Tax Report, 2004".
- Pennsylvania Department of Education (2017). "Real Estate Tax Rates by School District 2016-17 Real Estate Mills".
- Robert Tomkavage (June 28, 2016). "Abington Heights School Board approves 2016-17 budget with tax increase". Abington Journal.
- Pennsylvania Department of Education (2014). "Real Estate Tax Rates by School District 2014-15 Real Estate Mills".
- Pennsylvania Department of Education, Finances_Real Estate Tax Rates 2013-14, 2013
- Pennsylvania Department of Education, Finances_Real Estate Tax Rates 2012-13, 2012
- Pennsylvania Department of Education (2011). "Real Estate Tax Millage by School District".
- Pennsylvania Department of Education. "Finances_Real Estate Tax Rates 2010-11".
- Pennsylvania Department of Education. "Finances_Real Estate Tax Rates 2009-10".
- Pennsylvania Department of Education, Financial Elements Reports 2008-09 Real Estate Mills, 2009
- Pennsylvania Department of Education, Real Estate Tax Millage by School District, 2008
- Pennsylvania Department of Education, Real Estate Tax Millage by School District, 2006
- Pennsylvania Department of Education, Real Estate Tax Millage by School District, 2005
- Tax-rates.org. (2014). "The 2013 Tax Resource County Property Taxes 2013".
- Pennsylvania Department of Education, Pennsylvania School Finances - Summaries of Annual Financial Report Data 2010-11, 2011
- New Census Data on Property Taxes on Homeowners, Tax Foundation, September 22, 2009.
- Pennsylvania Department of Education (2010). "2010-11 Act 1 of 2006 Referendum Exception Guidelines".
- Kaitlynn Riely (August 4, 2011). "Law could restrict school construction projects". Pittsburgh Post-Gazette.
- Pennsylvania General Assembly (June 29, 2011). "SB330 of 2011".
- Eric Boehm (July 1, 2011). "Property tax reform final piece of state budget". PA Independent. Archived from the original on July 4, 2011.
- Pennsylvania Department of Education (2011). "Special Session Act 1 of 2006 the Taxpayer Relief Act information".
- Pennsylvania Department of Education (May 2010). "Special Session Act 1 of 2006 School District Adjusted Index for 2006-2007 through 2011-2012".
- Pennsylvania Department of Education (May 2011). "Special Session Act 1 of 2006 School District Adjusted Index for 2006-2007 through 2011-2012".
- Pennsylvania Department of Education, 2011-2012 School District Adjusted Index, September 2010
- Pennsylvania Department of Education, 2012-2013 School District Adjusted Index, September 2011
- Pennsylvania Department of Education, 2013-2014 School District Adjusted Index, September 2012
- Pennsylvania Department of Education, 2014-2015 School District Adjusted Index, September 2013
- Pennsylvania Department of Education, 2015-2016 School District Adjusted Index, September 2014
- Pennsylvania Department of Education (September 5, 2015). "2016-2017 School District Adjusted Index".
- Pennsylvania Department of Education (2015). "Property Tax Relief".
- PA Department of Education (September 10, 2016). "Index Calculation Required by Special Session Act 1 of 2006".
- Pennsylvania Department of Education (2016). "2017-18 School District Adjusted Index Listing".
- Pennsylvania Department of Education (April 2016). "Report on Referendum Exceptions For School Year 2016-2017".
- PSERS (December 10, 2015). "Fiscal Year 2016/2017 Employer Contribution Rate" (PDF).
- USA IRS (December 14, 2016). "Understanding Employment Taxes".
- Pennsylvania School Employee Retirement System (2017). "PSERS Budget Report 2017-18" (PDF).
- "Referendum Exceptions". 2014-10-06. Archived from the original on 2014-10-06.
- Pennsylvania School Employees, Retirement System, PSERS Chart showing payment mandates 2007-2020, 2014
- Pennsylvania Department of Education (April 30, 2014). "Report on Referendum Exceptions For School Year 2014-2015".
- Pennsylvania Department of Education, Report on Referendum Exceptions For School Year 2013-2014, April 2013
- Pennsylvania Department of Education, Report on Referendum Exceptions For School Year 2012-2013, March 30, 2012
- Pennsylvania Department of Education (April 2011). "Report on Exceptions".
- Pennsylvania Department of Education (April 2010). "Pennsylvania SSAct1_Act1 Exceptions Report 2010-2011 April 2010". Archived from the original on 8 October 2014.
- Pennsylvania Department of Education (April 2010). "Pennsylvania SSAct1_Act1 Exceptions Report 2009-2010 May 2009". Archived from the original on 15 October 2013.
- Scarcella, Frank; Pursell, Tricia (May 25, 2010). "Local school tax assessments exceed state averages". The Daily Item.
- Pennsylvania Department of Education (May 1, 2016). "2016-17 Estimated State Property Tax Relief per Homestead".
- Pennsylvania Department of Education, Estimated Tax Relief Per Homestead and Farmstead 2009, May 1, 2009
- Pennsylvania Department of Education, Tax Relief per Homestead 5-1-10. Report, May 2010
- Abington Heights School Board (May 17, 2006). "Abington Heights School District Interscholastic Athletics Policy 123" (PDF). Archived from the original (PDF) on October 3, 2011.
- Pennsylvania Office of the Governor Press Release (November 10, 2005). "Home-Schooled, Charter School Children Can Participate in School District Extracurricular Activities". Archived from the original on October 23, 2014.
- "School Board". Abington Heights School District. Abington Heights School District. 2014. Archived from the original on 13 July 2015. Retrieved 11 July 2015.
External links
Lackawanna County, Pennsylvania schools | |||||||||||||||||||||||
|---|---|---|---|---|---|---|---|---|---|---|---|---|---|---|---|---|---|---|---|---|---|---|---|
| |||||||||||||||||||||||
| |||||||||||||||||||||||