Arthur-Virden
Arthur-Virden is a provincial electoral division in the Canadian province of Manitoba. It was created by redistribution in 1989, combining the former constituencies of Arthur and Virden.
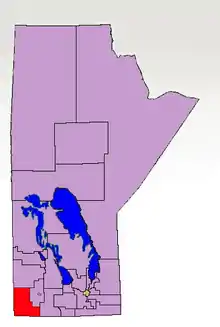
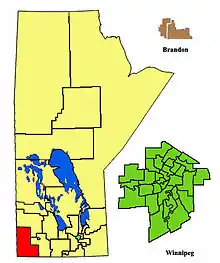 The 2011- boundaries for Arthur-Virden highlighted in red. | |
| Defunct provincial electoral district | |
| Legislature | Legislative Assembly of Manitoba |
| District created | 1989 |
| First contested | 1990 |
| Last contested | 2016 |
| Demographics | |
| Population (2011) | 21,182 |
| Electors (2014) | 13,739 |
| Area (km²)Canada 2011 Census | 12,200.5 |
| Census division(s) | Division No. 5, Division No. 6, Division No. 15, |
| Census subdivision(s) | Albert, Archie, Arthur, Birdtail Creek 57, Boissevain, Brenda, Cameron, Canupawakpa Dakota First Nation, Deloraine, Edward, Elkhorn, Hamiota (RM), Hamiota (town), Hartney, Melita, Miniota, Morton, Oak Lake, Pipestone, Sifton, Sioux Valley Dakota Nation, Virden, Wallace, Waskada, Whitewater, Winchester, Woodworth |
Arthur-Virden is located in the southwestern corner of the province. It is bordered to the north by Riding Mountain, to the east by Spruce Woods, to the west by the province of Saskatchewan and to the south by the American state of North Dakota.
Communities in the riding include Virden, Elkhorn, Oak Lake, Hartney, Deloraine, Melita, Reston and Boissevain.
In 1999, the average family income was $41,338, and the unemployment rate was 4.80%. The riding is primarily agrarian, with agriculture accounting for 32% of its industry.
Ten per cent of the Arthur-Virden's residents list German as their ethnic background. The riding has one of the highest rates of senior citizens in the province, at 19.7% of the total.
Arthur-Virden, and the two ridings from which it was formed, have been Progressive Conservative seats since 1953.
List of provincial representatives
| Assembly | Years | Member | Party | |
|---|---|---|---|---|
| 35th | 1990-1995 | Jim Downey | Progressive Conservative | |
| 36th | 1995-1999 | |||
| 37th | 1999-2003 | Larry Maguire | ||
| 38th | 2003-2007 | |||
| 39th | 2007-2011 | |||
| 40th | 2011-2013 | |||
| 2014-2016 | Doyle Piwniuk | |||
| 41st | 2016-2019 | |||
Election results
| 2016 Manitoba general election | ||||||||
|---|---|---|---|---|---|---|---|---|
| Party | Candidate | Votes | % | ±% | Expenditures | |||
| Progressive Conservative | Doyle Piwniuk | 6,006 | 80.59 | +12.39 | $20,684.63 | |||
| Manitoba | Frank Godon | 846 | 11.35 | +11.35 | $4,340.23 | |||
| New Democratic | Lorne M. Topolniski | 600 | 8.05 | -2.38 | $146.90 | |||
| Total valid votes/Expense limit | 7,452 | 100.0 | $ | |||||
| Eligible voters | – | |||||||
| Source: Elections Manitoba[1][2][3] | ||||||||
| Manitoba provincial by-election, January 28, 2014 | ||||||||
|---|---|---|---|---|---|---|---|---|
| Party | Candidate | Votes | % | ±% | Expenditures | |||
| Progressive Conservative | Doyle Piwniuk | 3,137 | 68.20 | +2.23 | 15,355.65 | |||
| Liberal | Floyd Buhler | 738 | 16.04 | +12.23 | 6,463.77 | |||
| New Democratic | Bob Senff | 480 | 10.43 | -19.78 | 6,318.45 | |||
| Green | Kate Storey | 245 | 5.33 | 0.00 | ||||
| Total valid votes | 4,600 | 100.00 | ||||||
| Rejected and declined votes | 10 | |||||||
| Turnout | 4,610 | 33.55 | ||||||
| Electors on the lists | 13,739 | |||||||
| Progressive Conservative hold | Swing | -5.00 | ||||||
| 2011 Manitoba general election | ||||||||
|---|---|---|---|---|---|---|---|---|
| Party | Candidate | Votes | % | ±% | Expenditures | |||
| Progressive Conservative | Larry Maguire | 4,983 | 65.97 | +1.92 | $29,215.58 | |||
| New Democratic | Garry Draper | 2,282 | 30.21 | −0.60 | $14,391.55 | |||
| Liberal | Murray Cliff | 288 | 3.81 | −1.32 | $0.00 | |||
| Total valid votes | 7,553 | |||||||
| Rejected and declined ballots | 32 | |||||||
| Turnout | 7,585 | 51.91 | ||||||
| Electors on the lists | 14,613 | |||||||
| Progressive Conservative hold | Swing | +1.26 | ||||||
| Source: Elections Manitoba[4] | ||||||||
^ Change not based on redistributed results
| 2007 Manitoba general election | ||||||||
|---|---|---|---|---|---|---|---|---|
| Party | Candidate | Votes | % | ±% | Expenditures | |||
| Progressive Conservative | Larry Maguire | 4,451 | 64.05 | +10.24 | $21,019.29 | |||
| New Democratic | Bob Senff | 2,141 | 30.81 | −11.08 | $8,729.19 | |||
| Liberal | Fred Curry | 357 | 5.14 | +0.83 | $0.00 | |||
| Total valid votes | 6,949 | 100.00 | ||||||
| Rejected and declined ballots | 28 | |||||||
| Turnout | 6,977 | 56.79 | −3.61 | |||||
| Electors on the lists | 12,285 | |||||||
| 2003 Manitoba general election | ||||||||
|---|---|---|---|---|---|---|---|---|
| Party | Candidate | Votes | % | ±% | Expenditures | |||
| Progressive Conservative | Larry Maguire | 4,135 | 53.81 | +4.56 | $16,859.29 | |||
| New Democratic | Perry Kalynuk | 3,219 | 41.89 | +6.10 | $12,413.35 | |||
| Liberal | Vaughn Ramsay | 331 | 4.31 | −10.66 | $1,630.42 | |||
| Total valid votes | 7,685 | 100.00 | ||||||
| Rejected and declined ballots | 25 | |||||||
| Turnout | 7,710 | 60.40 | −4.17 | |||||
| Electors on the lists | 12,765 | |||||||
| Source: http://www.elections.mb.ca/en/Results/38_division_results/38_arthur-virden_summary_results.html | ||||||||
| 1999 Manitoba general election | ||||||||
|---|---|---|---|---|---|---|---|---|
| Party | Candidate | Votes | % | Expenditures | ||||
| Progressive Conservative | Larry Maguire | 4,215 | 49.25 | $21,631.54 | ||||
| New Democratic | Perry Kalynuk | 3,063 | 35.79 | $6,262.00 | ||||
| Liberal | Bob Brigden | 1,281 | 14.97 | $9,722.15 | ||||
| Total valid votes | 8,559 | 100.00 | ||||||
| Rejected and declined ballots | 66 | |||||||
| Turnout | 8,625 | 64.57 | ||||||
| Electors on the lists | 13,358 | |||||||
| 1995 Manitoba general election | ||||||||
|---|---|---|---|---|---|---|---|---|
| Party | Candidate | Votes | % | |||||
| Progressive Conservative | Jim Downey | 5015 | 64.36 | |||||
| New Democratic | Ray Cantelo | 1519 | 19.49 | |||||
| Liberal | Murray Lee | 1258 | 16.14 | |||||
| 1990 Manitoba general election | ||||||||
|---|---|---|---|---|---|---|---|---|
| Party | Candidate | Votes | % | |||||
| Progressive Conservative | (x) Jim Downey | 4773 | 59.25 | |||||
| Liberal | Glen McKinnon | 2085 | 25.88 | |||||
| New Democratic | Goldwyn Jones | 1197 | 14.86 | |||||
Previous boundaries
References
- "Candidates: 41st General Election". Elections Manitoba. 29 March 2016. Retrieved 31 March 2016.
- "41ST GENERAL ELECTION, APRIL 19, 2016 - OFFICIAL RESULTS". Elections Manitoba. 19 April 2016. Retrieved 18 November 2016.
- "Election Returns: 41st General Election". Elections Manitoba. 2016. Retrieved 10 September 2018.
- "Election Returns: 40th General Election". Elections Manitoba. 2011. Retrieved 10 September 2018.