Keewatinook
Keewatinook is a provincial electoral division in the Canadian province of Manitoba. The riding existed previously under the name Rupertsland. Starting with the 2011 election, the riding was renamed Kewatinook which means "from the north" in Cree. Effective with the 2019 Manitoba general election, the spelling was corrected to Keewatinook. [1]
 | |||
| Provincial electoral district | |||
| Legislature | Legislative Assembly of Manitoba | ||
| MLA |
New Democratic | ||
| District created | 1916 | ||
| First contested | 1916 | ||
| Last contested | 2016 | ||
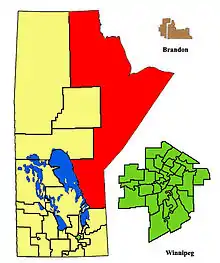
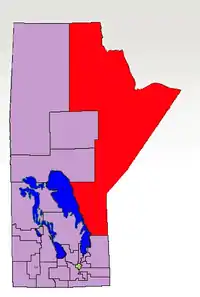
It was created in 1916 from territories that were added to the province four years earlier, and has existed continuously since that time. The area had been part of the Grand Rapids and Churchill and Nelson electoral districts for the 1914 Manitoba general election. Originally named Rupertsland, its name was changed as part of the 2008 riding redistribution by the Manitoba Boundaries Commission. Kewatinook is currently the largest riding in the province, a sprawling northern constituency which occupies a large portion of the eastern half of Manitoba. It was a smaller constituency until 1989, when it gained a significant amount of territory from the former riding of Churchill.
The current Kewatinook riding stretches from the Ontario border in the southeast to the Nunavut border in the north; it is also bordered by Lac Du Bonnet to the south and Flin Flon, The Pas and Thompson to the west. Churchill, Manitoba is the most significant community in this wide region.
Elections in Kewatinook before 1966 were usually deferred until a later date than the rest of the province, due to the increased time it took to run elections in the region.
Kewatinook's population in 2006 was 15,560.[2] In 1999, the average family income was $33,787 (the fourth-lowest in Manitoba), and the unemployment rate was 25%. Over 34% of the riding's population have less than a Grade 9 education, the highest such rate in the province. Government services account for 21% of the riding's industry, followed by education services at 17%.
Eighty-seven per cent of Kewatinook's residents are aboriginal, the highest percentage in the province. Over half the population list Cree as their mother tongue. In 1999, there was only a 1% immigrant population.
Prior to the 2016 election, the New Democratic Party represented the riding from 1969 to 2016, when Judy Klassen of the Liberal Party defeated longtime MLA Eric Robinson. The current MLA is Ian Bushie of the New Democratic Party. Bushie defeated Jason Harper of the Liberal Party to take the seat in 2019.
List of provincial representatives
| Name | Party | Took Office | Left Office |
|---|---|---|---|
| John Morrison | Independent | 1916 | 1920 |
| Lib | 1920 | 1922 | |
| Francis Black | Prog | 1922 | 1927 |
| Herbert Beresford | Independent Progressive | 1927 | 1932 |
| Ewan McPherson | Lib-Prog | 1932 | 1936 |
| Michael Rojeski | Lib/Non-Coalition | 1936 | 1941 |
| Daniel Hamilton | Lib-Prog | 1941 | 1953 |
| Roy Brown | Lib-Prog | 1953 | 1958 |
| Joseph Jeannotte | PC | 1958 | 1969 |
| Jean Allard | NDP | 1969 | 1972 |
| Independent | 1972 | 1973 | |
| Harvey Bostrom | NDP | 1973 | 1981 |
| Elijah Harper | NDP | 1981 | 1992 |
| Eric Robinson | NDP | 1993 | 2016 |
| Judy Klassen | Lib | 2016 | 2019 |
| Ian Bushie | NDP | 2019 | present |
Electoral results
2019 Manitoba general election
| 2019 Manitoba general election | ||||||||
|---|---|---|---|---|---|---|---|---|
| Party | Candidate | Votes | % | ±% | Expenditures | |||
| New Democratic | Ian Bushie | 1,632 | 65.59 | +24.9 | $6,214.15 | |||
| Liberal | Jason Harper | 506 | 20.34 | -21.7 | $4,369.37 | |||
| Progressive Conservative | Arnold Flett | 350 | 14.07 | -3.1 | none listed | |||
| Total valid votes | 2,488 | 100.0 | ||||||
| Total rejected ballots | ||||||||
| Turnout | 17.6 | |||||||
| Eligible voters | ||||||||
| New Democratic gain from Liberal | Swing | +23.3 | ||||||
2016 Manitoba general election
| 2016 provincial election redistributed results[3] | |||
|---|---|---|---|
| Party | % | ||
| Liberal | 42.0 | ||
| New Democratic | 40.7 | ||
| Progressive Conservative | 17.2 | ||
| 2016 Manitoba general election: Kewatinook | ||||||||
|---|---|---|---|---|---|---|---|---|
| Party | Candidate | Votes | % | ±% | Expenditures | |||
| Liberal | Judy Klassen | 1,565 | 49.73 | +48.37 | $30,958.72 | |||
| New Democratic | Eric Robinson | 1,207 | 38.35 | –18.46 | $34,619.23 | |||
| Progressive Conservative | Edna Nabess | 375 | 11.92 | –26.70 | $24,449.08 | |||
| Total valid votes | 3,147 | 100.0 | ||||||
| Total rejected and declined ballots | 135 | 4.11 | ||||||
| Turnout | 3,282 | 24.31 | ||||||
| Eligible voters | 13,500 | |||||||
| Liberal gain from New Democratic | Swing | +33.42 | ||||||
| Source: Elections Manitoba[4][5] | ||||||||
2011 Manitoba general election
| 2011 Manitoba general election: Kewatinook | ||||||||
|---|---|---|---|---|---|---|---|---|
| Party | Candidate | Votes | % | ±% | Expenditures | |||
| New Democratic | Eric Robinson | 2,043 | 56.81 | −1.40 | $39,824.28 | |||
| Progressive Conservative | Michael Birch | 1,389 | 38.62 | +2.87 | $35,204.76 | |||
| Green | Philip Green | 94 | 2.61 | – | $1,571.33 | |||
| Liberal | Orville Woodford | 49 | 1.36 | −4.26 | $0 | |||
| Total valid votes | 3,574 | 99.39 | ||||||
| Rejected and declined ballots | 22 | |||||||
| Turnout | 3,596 | 35.68 | ||||||
| Electors on the lists | 10,081 | |||||||
| New Democratic hold | Swing | - | ||||||
| Source: Elections Manitoba[6] | ||||||||
2007 Manitoba general election
| 2007 Manitoba general election: Rupertsland | ||||||||
|---|---|---|---|---|---|---|---|---|
| Party | Candidate | Votes | % | ±% | Expenditures | |||
| New Democratic | Eric Robinson | 2,092 | 58.21 | $23,296.64 | ||||
| Progressive Conservative | David Harper | 1,285 | 35.75 | $8,233.12 | ||||
| Liberal | Earl Fontaine | 202 | 5.62 | – | $3,911.36 | |||
| Total valid votes | 3,579 | 99.58 | ||||||
| Rejected and declined ballots | 15 | |||||||
| Turnout | 3,594 | 33.34 | ||||||
| Electors on the lists | 10,780 | |||||||
| New Democratic hold | Swing | - | ||||||
Source:Elections Manitoba[7]
2003 Manitoba general election
| 2003 Manitoba general election: Rupertsland | ||||||||
|---|---|---|---|---|---|---|---|---|
| Party | Candidate | Votes | % | ±% | Expenditures | |||
| New Democratic | Eric Robinson | 2,203 | 87.52 | +28.23 | $17,690.80 | |||
| Liberal | Orville Woodford | 162 | 6.43 | -14.36 | $2,564.46 | |||
| Progressive Conservative | Cory Phillips | 152 | 6.04 | -13.87 | $450.94 | |||
| New Democratic hold | Swing | - | ||||||
| Source: Elections Manitoba[8] | ||||||||
1990s Manitoba general election
| 1999 Manitoba general election: Rupertsland | ||||||||
|---|---|---|---|---|---|---|---|---|
| Party | Candidate | Votes | % | ±% | Expenditures | |||
| New Democratic | Eric Robinson | 2,007 | 58.94 | $25,058.00 | ||||
| Liberal | Darcy Wood | 708 | 20.79 | – | $28,387.14 | |||
| Progressive Conservative | Fred Harper | 678 | 19.91 | $31,774.52 | ||||
| Total valid votes | 3,392 | 99.62 | ||||||
| Rejected and declined ballots | 12 | |||||||
| Turnout | 3,405 | 38.72 | ||||||
| Electors on the lists | 8,793 | |||||||
| 1995 Manitoba general election: Rupertsland | ||||||||
|---|---|---|---|---|---|---|---|---|
| Party | Candidate | Votes | % | Expenditures | ||||
| New Democratic | Eric Robinson | 2,249 | 50.80 | $22,077.00 | ||||
| Liberal | Harry Wood | 1,018 | 23.00 | $25,182.52 | ||||
| Progressive Conservative | Eric Kennedy | 619 | 13.98 | $8,427.91 | ||||
| Ind. (First Peoples Party) | Jerry Fontaine | 541 | 12.22 | $14,852.48 | ||||
| Total valid votes | 4,427 | 100.00 | ||||||
| Rejected and discarded ballots | 22 | |||||||
| Turnout | 4,449 | 44.83 | ||||||
| Electors on the lists | 9,924 | |||||||
Previous boundaries

References
- "Manitoba Electoral Divisions Boundaries Commission Final Report 2018" (PDF). Retrieved 11 July 2019.
- "Kewatinook Electoral District". Boundaries Commission of Manitoba. Retrieved 2010-11-22.
- Marcoux, Jacques (2019-08-27). "New Manitoba election boundaries give upper hand to Progressive Conservatives, CBC News analysis finds". CBC. Retrieved 2019-09-14.
- "Candidates: 41st General Election". Elections Manitoba. 29 March 2016. Retrieved 31 March 2016.
- "41st General Election Official Results" (PDF). Elections Manitoba. 2016. Retrieved 16 September 2016.
- "Candidates: 41st General Election". Elections Manitoba. 2011. Retrieved 22 August 2018.
- http://www.electionsmanitoba.ca/en/Results/39_division_results/39_rupertsland_summary_results.html - 2007 results
- "Candidates: 41st General Election". Elections Manitoba. 2011. Retrieved 22 August 2018.