Swan River (electoral district)
Swan River is a provincial electoral division in the Canadian province of Manitoba. It was created in 1903, in what was then the northwestern corner of the province. Manitoba's borders expanded significantly in 1912, and Swan River is now located in the centre of the province, close to its western border with Saskatchewan. The division has seen several redistributions.
 | |||
| Provincial electoral district | |||
| Legislature | Legislative Assembly of Manitoba | ||
| MLA |
Progressive Conservative | ||
| District created | 1903 | ||
| First contested | 1903 | ||
| Last contested | 2019 | ||
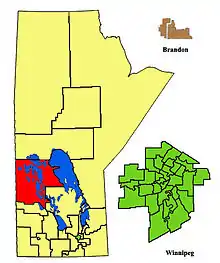
The riding is bordered to the north by The Pas, to the south by Dauphin-Roblin, to the east by Lake Winnipeg and to the west by the province of Saskatchewan. Lake Winnipegosis runs through the riding.
The community of Swan River is located in the riding's southwest corner. Other communities in the riding include Birch River, Ethelbert, Minitonas, Camperville and Winnipegosis.
The riding's population in 1996 was 19,639. In 1999, the average family income was $35,209, and the unemployment rate was 10.70%. Twenty-eight per cent of the riding's residents are listed as low income, and over 25% of the population has less than a Grade Nine education (the third-highest rate in the province).
Thirty-six per cent of the riding's residents are aboriginal, and 10% are Ukrainian. Agriculture accounts for 22% of Swan River's economy, followed by the health and service sector at 12%.
Swan River's political identity has undergone a significant change in recent years. It was represented by the Progressive Conservative Party of Manitoba continuously for all but one term from 1932 to 1988, and was generally regarded as safe for the party during this period. The current MLA is Rick Wowchuk, who was elected in 2016, returning the seat to the Tories for the first time since 1990.
List of provincial representatives
This riding has elected the following MLAs:
| Parliament | Years | Member | Party | |
|---|---|---|---|---|
| 8th | 1903–1907 | James Robson | Conservative | |
| 9th | 1907–1910 | |||
| 10th | 1910–1914 | Daniel D. McDonald | Liberal | |
| 11th | 1914–1915 | William Sims | Liberal | |
| 12th | 1915–1920 | |||
| 13th | 1920–1922 | Robert Emmond | Farmer | |
| 14th | 1922–1927 | Progressive | ||
| 15th | 1927–1932 | Andrew McCleary | Progressive | |
| 16th | 1932–1936 | George Renouf | Progressive Conservative | |
| 17th | 1936–1941 | |||
| 18th | 1941–1945 | |||
| 19th | 1945–1949 | |||
| 20th | 1949–1953 | |||
| 21st | 1953–1958 | |||
| 22nd | 1958–1959 | Albert Corbett | Progressive Conservative | |
| 23rd | 1959–1962 | |||
| 24th | 1962–1966 | James Bilton | Progressive Conservative | |
| 25th | 1966–1969 | |||
| 26th | 1969–1973 | |||
| 27th | 1973–1977 | |||
| 28th | 1977–1981 | Douglas Gourlay | Progressive Conservative | |
| 29th | 1981–1986 | |||
| 30th | 1986–1988 | Len Harapiak | New Democratic Party | |
| 31st | 1988–1990 | Parker Burrell | Progressive Conservative | |
| 32nd | 1990–1993 | Rosann Wowchuk | New Democratic Party | |
| 33rd | 1995–1999 | |||
| 34th | 1999–2003 | |||
| 35th | 2003–2007 | |||
| 36th | 2007-2011 | |||
| 37th | 2011–2016 | Ron Kostyshyn | New Democratic Party | |
| 38th | 2016–2019 | Rick Wowchuk | Progressive Conservative | |
| 39th | 2019- | |||
Electoral results
| 2019 Manitoba general election | ||||||||
|---|---|---|---|---|---|---|---|---|
| Party | Candidate | Votes | % | ±% | Expenditures | |||
| Progressive Conservative | Rick Wowchuk | 5,529 | 69.0% | +12.8 | $9,962.06 | |||
| New Democratic | Shelley Wiggins | 2,064 | 25.8% | -7.3 | $6,225.59 | |||
| Liberal | David Teffaine | 417 | 5.2% | -1.4 | $0.00 | |||
| Total valid votes | 8,010 | 100.0 | ||||||
| Total rejected ballots | ||||||||
| Turnout | ||||||||
| Eligible voters | ||||||||
| 2016 Manitoba general election | ||||||||
|---|---|---|---|---|---|---|---|---|
| Party | Candidate | Votes | % | ±% | Expenditures | |||
| Progressive Conservative | Rick Wowchuk | 4,081 | 56.2 | +15.82 | $27,515.00 | |||
| New Democratic | Ron Kostyshyn | 2,408 | 33.1 | -23.05 | $32,595.02 | |||
| Liberal | Shayne Lynxleg | 483 | 6.6 | +3.14 | $131.25 | |||
| Green | Dan Soprovich | 296 | 4.1 | $2,061.05 | ||||
| Total valid votes/Expense limit | 7,268 | 100.0 | $39,956.00 | |||||
| Eligible voters | – | |||||||
| Source: Elections Manitoba[1][2] | ||||||||
| 2011 Manitoba general election | ||||||||
|---|---|---|---|---|---|---|---|---|
| Party | Candidate | Votes | % | Expenditures | ||||
| New Democratic | Ron Kostyshyn | 4,280 | 56.15 | $34,323.01 | ||||
| Progressive Conservative | Dave Powell | 3,078 | 40.38 | $21,167.11 | ||||
| Liberal | Reynold Cook | 264 | 3.46 | $284.81 | ||||
| Total valid votes | 7,622 | 100.00 | ||||||
| Rejected and declined ballots | 46 | 0.60 | ||||||
| Turnout | 7,668 | 59.66 | ||||||
| Electors on the lists | 12,853 | |||||||
| 2007 Manitoba general election | ||||||||
|---|---|---|---|---|---|---|---|---|
| Party | Candidate | Votes | % | ±% | Expenditures | |||
| New Democratic | Rosann Wowchuk | 4,522 | 58.18 | -4.82 | $32,305.27 | |||
| Progressive Conservative | Maxine Plesiuk | 2,915 | 37.51 | +7.72 | $25,705.00 | |||
| Liberal | Niomi Spence-Pranteau | 306 | 3.93 | -3.28 | $340.30 | |||
| Total valid votes | 7,743 | 99.63 | ||||||
| Rejected and declined ballots | 29 | |||||||
| Turnout | 7,772 | 65.12 | ||||||
| Electors on the lists | 11,919 | |||||||
| Source: Elections Manitoba[3] | ||||||||
| 2003 Manitoba general election | ||||||||
|---|---|---|---|---|---|---|---|---|
| Party | Candidate | Votes | % | ±% | Expenditures | |||
| New Democratic | Rosann Wowchuk | 4,701 | 63.00 | $31,387.05 | ||||
| Progressive Conservative | Jason Shaw | 2,223 | 29.79 | $9,138.20 | ||||
| Liberal | Russell McKay | 538 | 7.21 | $4,967.04 | ||||
| Total valid votes/Expense limit | 100.0 | $ | ||||||
| Eligible voters | – | |||||||
| Source: Elections Manitoba[5][6] | ||||||||
| 1999 Manitoba general election | ||||||||
|---|---|---|---|---|---|---|---|---|
| Party | Candidate | Votes | % | ±% | Expenditures | |||
| New Democratic | Rosann Wowchuk | 4,931 | 54.84 | $28,531.00 | ||||
| Progressive Conservative | Maxine Plesiuk | 3,482 | 38.72 | $28,983.00 | ||||
| Manitoba | Wayne Klekta | 558 | 6.21 | $1,723.80 | ||||
| Total valid votes | 8,971 | 99.77 | ||||||
| Rejected and declined ballots | 21 | |||||||
| Turnout | 8,992 | 70.94 | ||||||
| Electors on the lists | 12,676 | |||||||
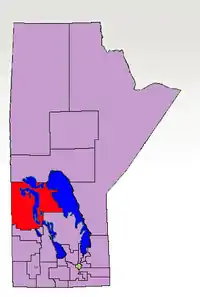
Previous boundaries
References
- "Candidates: 41st General Election". Elections Manitoba. 29 March 2016. Retrieved 31 March 2016.
- "Election Returns: 41st General Election". Elections Manitoba. 2016. Retrieved 10 September 2018.
- "Election Returns: 39th General Election". Elections Manitoba. 2007. Retrieved 10 September 2018.
- http://www.electionsmanitoba.ca/en/Results/39_division_results/39_swan-river_summary_results.html - 2007 results
- "Election Returns: 38th General Election". Elections Manitoba. 2003. Retrieved 16 September 2018.
- http://www.elections.mb.ca/en/Results/38_division_results/38_swan-river_summary_results.html
- http://www.electionsmanitoba.ca/apps/results/37gen/pbp.asp?ED=49 - 1999 Results