Point Douglas
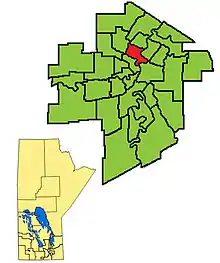
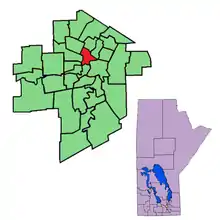
Point Douglas is a provincial electoral district in Winnipeg, Manitoba, Canada. It is named for a part of the city that is surrounded by a bend in the Red River. The riding covers the neighbourhoods of William Whyte, Dufferin Industrial, North Point Douglas, Lord Selkirk Park and South Point Douglas plus parts of St. John's Park, St. John's, Inkster-Faraday, Burrows Central, Robertson, Dufferin, Logan C.P.R., Civic Centre and the Exchange District.
 | |||
| Provincial electoral district | |||
| Legislature | Legislative Assembly of Manitoba | ||
| MLA |
New Democratic | ||
| District created | 1968 | ||
| First contested | 1968 | ||
| Last contested | 2019 | ||
| Demographics | |||
| Population (2016) | 21,606 | ||
| Electors (2017) | 10,761 | ||
| Census division(s) | Division No. 11 | ||
| Census subdivision(s) | Winnipeg | ||
History
The division was created by redistribution for the 1969 provincial election, eliminated in 1978 into Burrows, Logan and St. Johns. It was re-established in 1989 from parts of Burrows, Logan, St. Johns and a small part of Sevenoaks. It is located in north-central Winnipeg, and includes the Point Douglas neighbourhood.
Point Douglas is bordered to the east by St. Boniface and Elmwood, to the south by Logan, to the north by St. Johns, and to the west by Burrows, Wellington and Minto. Different parts of the division are included in the federal ridings of Winnipeg Centre and Winnipeg North.
Point Douglas is named after Thomas Douglas, the 5th Earl of Selkirk, who established the Red River Colony in 1812. His namesake, twentieth-century politician Tommy Douglas, also lived in the Point Douglas neighbourhood in the early 1910s.[1]
The Manitoba New Democratic Party has won every election in the constituency.
Demographics
| Population | 19,941 (1996) |
| Average family income | $24,715 (1999) |
| Unemployment | 25% (1999) |
| Industries | Manufacturing (25%), Other services (22%) (1999) |
| Other | Point Douglas has the lowest average family income of any electoral division in the province. Three-quarters of the riding's residences are rented, and 37% of families are single-parent households. The division is ethnically diverse, with significant aboriginal (33%), Filipino (10%) and Ukrainian populations (6%). |
Source: 2003 CBC Profile
List of provincial representatives
| Assembly | Years | Member | Party | |
|---|---|---|---|---|
| Riding created from Burrows, St. Johns, Elmwood, Logan and Winnipeg Centre | ||||
| 29th | 1969-1973 | Donald Malinowski | New Democratic | |
| 30th | 1973-1977 | |||
| 31st | 1977-1981 | |||
| Riding abolished from 1981-1990 | ||||
| 35th | 1990-1995 | George Hickes | New Democratic | |
| 36th | 1995-1999 | |||
| 37th | 1999-2003 | |||
| 38th | 2003-2007 | |||
| 39th | 2007-2011 | |||
| 40th | 2011-2016 | Kevin Chief | ||
| 41st | 2016-2017 | |||
| 2017–present | Bernadette Smith | |||
| 42nd | 2019–present | |||
Electoral history
1990 to present
| 2019 Manitoba general election | ||||||||
|---|---|---|---|---|---|---|---|---|
| Party | Candidate | Votes | % | ±% | Expenditures | |||
| New Democratic | Bernadette Smith | 3,002 | 62.13 | +17.78 | $19,767.20 | |||
| Progressive Conservative | Michelle Redmond | 757 | 15.67 | -0.58 | $521.28 | |||
| Liberal | Richard Sanderson | 565 | 11.69 | -17.39 | $0.00 | |||
| Green | Jenn Kess | 398 | 8.24 | 3.99 | $0.00 | |||
| Manitoba | Michael Wenuik | 66 | 1.37 | -3.86 | $0.00 | |||
| Communist | Fagie Fainman | 44 | 0.91 | +0.07 | $310.80 | |||
| Total valid votes | 100.0 | |||||||
| Total rejected ballots | ||||||||
| Turnout | ||||||||
| Eligible voters | ||||||||
| Manitoba provincial by-election, 13 June 2017 Resignation of Kevin Chief | ||||||||
|---|---|---|---|---|---|---|---|---|
| Party | Candidate | Votes | % | ±% | Expenditures | |||
| New Democratic | Bernadette Smith | 1,568 | 44.35 | -13.46 | $35,313.48 | |||
| Liberal | John Cacayuran | 1,006 | 29.08 | +9.62 | $19,478.56 | |||
| Progressive Conservative | Jodi Moskal | 562 | 16.25 | -0.27 | $35,068.27 | |||
| Manitoba | Gary Marshall | 181 | 5.23 | $5,528.56 | ||||
| Green | Sabrina Koehn Binesi | 147 | 4.25 | -0.78 | $2,230.86 | |||
| Communist | Frank Komarniski | 27 | 0.84 | -0.34 | $9.44 | |||
| Total valid votes/Expense limit | 3,491 | 100.00 | - | $37,179.00 | ||||
| Total rejected and declines votes | 23 | 0.72 | -0.45 | |||||
| Turnout | 3,514 | 32.38 | -10.16 | |||||
| Electors on the lists | 11,207 | |||||||
| New Democratic hold | Swing | -11.54 | ||||||
| Source: Elections Manitoba[2] | ||||||||

| 2016 Manitoba general election | ||||||||
|---|---|---|---|---|---|---|---|---|
| Party | Candidate | Votes | % | ±% | Expenditures | |||
| New Democratic | Kevin Chief | 2,839 | 57.81 | -15.47 | $24,493.23 | |||
| Liberal | Althea Guiboche | 956 | 19.47 | +14.52 | $10,557.41 | |||
| Progressive Conservative | Marsha Street | 811 | 16.51 | -1.14 | $9,380.15 | |||
| Green | Alberteen Spence | 247 | 5.03 | +1.64 | $0.00 | |||
| Communist | Frank Komarniski | 58 | 1.18 | +0.45 | $ | |||
| Total valid votes/Expense limit | 4,911 | 100.00 | - | $36,863.00 | ||||
| Total rejected and declines votes | 58 | 1.17 | +0.63 | |||||
| Turnout | 4,969 | 42.53 | -1.51 | |||||
| Registered electors | 11,683 | |||||||
| New Democratic hold | Swing | -14.99 | ||||||
| Source: Elections Manitoba[3][4] | ||||||||
| 2011 Manitoba general election | ||||||||
|---|---|---|---|---|---|---|---|---|
| Party | Candidate | Votes | % | ±% | Expenditures | |||
| New Democratic | Kevin Chief | 3,806 | 73.28 | +6.92 | $18,567.73 | |||
| Progressive Conservative | John Vernaus | 917 | 17.65 | +5.68 | $19,915.21 | |||
| Liberal | Mary Lou Bourgeois | 257 | 4.95 | −9.77 | $5,383.65 | |||
| Green | Teresa Pun | 176 | 3.39 | −1.92 | $17.48 | |||
| Communist | Darrell Rankin | 38 | 0.73 | −0.91 | $312.12 | |||
| Total valid votes | 5,194 | |||||||
| Rejected and declined votes | 28 | 0.54 | -0.18 | |||||
| Turnout | 5,222 | 44.04 | +3.90 | |||||
| Electors on the lists | 11,858 | |||||||
| New Democratic hold | Swing | +0.62 | ||||||
^ Change is not based on redistributed results
| 2007 Manitoba general election | ||||||||
|---|---|---|---|---|---|---|---|---|
| Party | Candidate | Votes | % | ±% | Expenditures | |||
| New Democratic | George Hickes | 2,665 | 66.36 | −8.50 | $12,892.59 | |||
| Liberal | Mary Lou Bourgeois | 591 | 14.72 | +0.48 | $11,443.44 | |||
| Progressive Conservative | Alexa Rosentreter | 481 | 11.98 | +3.21 | $1,180.30 | |||
| Green | Kristen Andrews | 213 | 5.30 | – | $84.55 | |||
| Communist | Darrell Rankin | 66 | 1.64 | −0.49 | $373.89 | |||
| Total valid votes | 4,016 | 100.00 | ||||||
| Rejected and declined ballots | 29 | 0.72 | -0.69 | |||||
| Turnout | 4,045 | 40.14 | −0.10 | |||||
| Electors on the lists | 10,077 | |||||||
| New Democratic hold | Swing | -4.49 | ||||||
| 2003 Manitoba general election | ||||||||
|---|---|---|---|---|---|---|---|---|
| Party | Candidate | Votes | % | ±% | Expenditures | |||
| New Democratic | George Hickes | 2,877 | 74.86 | +21.52 | $10,189.54 | |||
| Liberal | Mary Lou Bourgeois | 547 | 14.23 | −7.12 | $7,991.06 | |||
| Progressive Conservative | Wyatt McIntyre | 337 | 8.77 | −10.79 | $10.68 | |||
| Communist | Darrell Rankin | 82 | 2.13 | $376.06 | ||||
| Total valid votes | 3,843 | 100.00 | ||||||
| Rejected and declined ballots | 55 | 1.41 | +0.48 | |||||
| Turnout | 3,898 | 40.24 | −18.84 | |||||
| Electors on the lists | 9,687 | |||||||
| New Democratic hold | Swing | +14.32 | ||||||
| 1999 Manitoba general election | ||||||||
|---|---|---|---|---|---|---|---|---|
| Party | Candidate | Votes | % | ±% | Expenditures | |||
| New Democratic | George Hickes | 3,338 | 53.34 | -9.69 | $21,952.00 | |||
| Liberal | Ajay Chopra | 1,336 | 21.35 | -1.71 | $21,013.00 | |||
| Progressive Conservative | Mary Richard | 1,224 | 19.56 | +7.79 | $20,221.11 | |||
| Independent | Peter Juba | 360 | 5.75 | $2,113.33 | ||||
| Total valid votes | 6,258 | 100.00 | ||||||
| Rejected and declined ballots | 59 | 0.93 | -0.17 | |||||
| Turnout | 6,317 | 59.08 | 0.85 | |||||
| Electors on the lists | 10,693 | |||||||
| New Democratic hold | Swing | +3.99 | ||||||
^ Change is not based on redistributed results
| 1995 Manitoba general election | ||||||||
|---|---|---|---|---|---|---|---|---|
| Party | Candidate | Votes | % | ±% | Expenditures | |||
| New Democratic | George Hickes | 3,095 | 63.03 | +8.32 | $15,378.00 | |||
| Liberal | Linda Cantiveros | 1,132 | 23.05 | -7.47 | $15,916.74 | |||
| Progressive Conservative | Claire Riddle | 578 | 11.77 | +0.45 | $13,389.05 | |||
| First Peoples Party | Lyle Morrisseau | 105 | 2.14 | no report filed | ||||
| Total valid votes | 4,910 | 100.00 | ||||||
| Rejected and discarded ballots | 55 | 1.11 | -0.27 | |||||
| Turnout | 4,965 | 58.23 | -2.70 | |||||
| Electors on lists | 8,527 | |||||||
| New Democratic hold | Swing | +7.90 | ||||||
| 1990 Manitoba general election | ||||||||
|---|---|---|---|---|---|---|---|---|
| Party | Candidate | Votes | % | ±% | ||||
| New Democratic | George Hickes | 2,778 | 54.72 | |||||
| Liberal | Errol Lewis | 1,550 | 30.53 | |||||
| Progressive Conservative | Calvin Pompana | 575 | 11.33 | |||||
| Independent | William Hawryluk | 108 | 2.13 | |||||
| Independent | Roy Price | 66 | 1.30 | |||||
| Total valid votes | 5,077 | 100.00 | ||||||
| Rejected ballots | 71 | 1.38 | ||||||
| Turnout | 5,148 | 60.92 | ||||||
| Electors on lists | 8,450 | |||||||
1969 to 1981
| 1977 Manitoba general election | ||||||||
|---|---|---|---|---|---|---|---|---|
| Party | Candidate | Votes | % | ±% | ||||
| New Democratic | Donald Malinowski | 3,116 | 63.32 | |||||
| Progressive Conservative | Margaret Didenko | 915 | 18.59 | |||||
| Liberal | Don Marks | 769 | 15.63 | |||||
| Communist | Harold Dyck | 62 | 1.26 | |||||
| Social Credit | Peter Stevens | 59 | 1.20 | |||||
| Total valid votes | 4,921 | 100.00 | ||||||
| Rejected votes | 85 | |||||||
| Turnout | 5,006 | 61.10 | ||||||
| Electors on the lists | 8,193 | |||||||
| 1973 Manitoba general election | ||||||||
|---|---|---|---|---|---|---|---|---|
| Party | Candidate | Votes | % | ±% | ||||
| New Democratic | Donald Malinowski | 3,676 | 65.55 | |||||
| Independent | Joseph Borowski | 1,127 | 20.10 | |||||
| Liberal | Lawrence Belanger | 569 | 10.15 | |||||
| Independent | George Munroe | 236 | 4.21 | |||||
| Total valid votes | 5,608 | 100.00 | ||||||
| Rejected and discarded votes | 100 | |||||||
| Turnout | 5,708 | 65.56 | ||||||
| Electors on the lists | 8,706 | |||||||
| 1969 Manitoba general election | ||||||||
|---|---|---|---|---|---|---|---|---|
| Party | Candidate | Votes | % | ±% | ||||
| New Democratic | Donald Malinowski | 2,253 | 52.52 | |||||
| Progressive Conservative | Slaw Rebchuk | 1,088 | 25.36 | |||||
| Liberal | Roger Garrity | 528 | 12.31 | |||||
| Communist | Bill Kardash | 421 | 9.81 | |||||
| Total valid votes | 4,290 | 100.00 | ||||||
| Rejected and discarded votes | 62 | |||||||
| Turnout | 4,352 | 46.37 | ||||||
| Electors on the lists | 9,385 | |||||||
All electoral information is taken from Elections Manitoba. Expenditures refer to individual candidate expenses.
Previous boundaries
References
- Bill Blaikie, Address to the Premier's Dinner, 29 October 2004.
- "Election Returns: By-Election". Elections Manitoba. 2017. Retrieved 23 August 2018.
- "Candidates: 41st General Election". Elections Manitoba. 29 March 2016. Retrieved 31 March 2016.
- "Election Returns: 41st General Election". Elections Manitoba. 2016. Retrieved 23 August 2018.