Autry-le-Châtel
Autry-le-Châtel is a commune in the Loiret department in north-central France.
Autry-le-Châtel | |
|---|---|
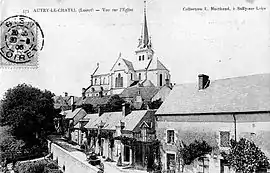 Old postcard of Autry-le-Châtel | |
.svg.png.webp) Coat of arms | |
Location of Autry-le-Châtel 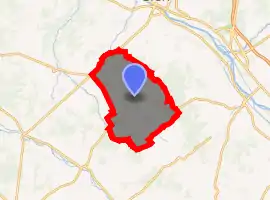
| |
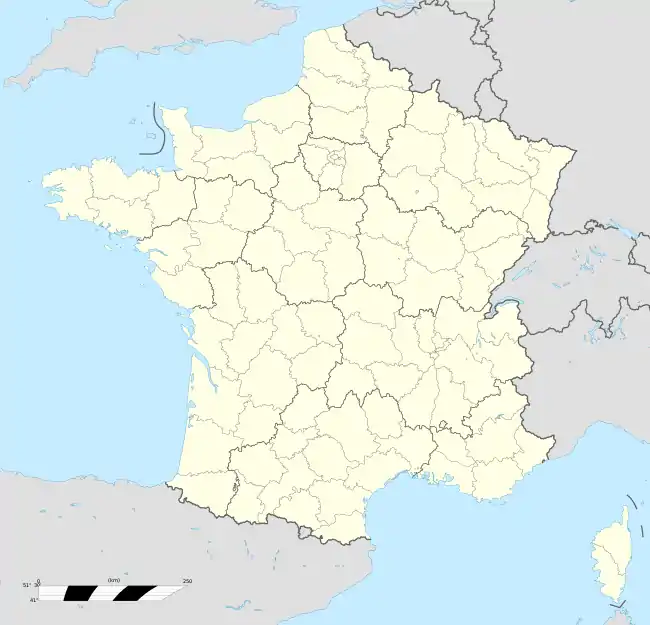 Autry-le-Châtel 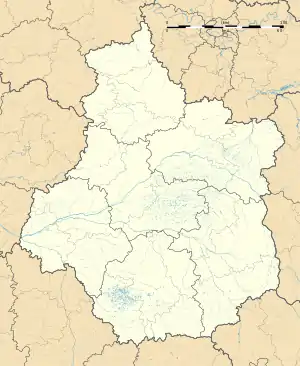 Autry-le-Châtel | |
| Coordinates: 47°35′54″N 2°36′11″E | |
| Country | France |
| Region | Centre-Val de Loire |
| Department | Loiret |
| Arrondissement | Montargis |
| Canton | Gien |
| Intercommunality | CC Berry Loire Puisaye |
| Government | |
| • Mayor (2014-2020) | Jacques Girault |
| Area 1 | 50.56 km2 (19.52 sq mi) |
| Population (2017-01-01)[1] | 961 |
| • Density | 19/km2 (49/sq mi) |
| Time zone | UTC+01:00 (CET) |
| • Summer (DST) | UTC+02:00 (CEST) |
| INSEE/Postal code | 45016 /45500 |
| Elevation | 141–236 m (463–774 ft) |
| 1 French Land Register data, which excludes lakes, ponds, glaciers > 1 km2 (0.386 sq mi or 247 acres) and river estuaries. | |
There is the church of Saint-Etienne, in the center of the village; it is a catholic church. There is also a castle.
A famous cheese in this region is the Crottin de Chavignol. If you want to buy it, you can go near Autry in different farms (for example, Le Grand Bardelet farm).
Geography
The commune of Autry-le-Châtel is located in the southeast of the department of Loiret, in the agricultural region of Berry. It is located 62.1 km from Orléans, prefecture of the department, 45.8 km from Montargis, sub-prefecture, and 11.4 km from Châtillon-sur-Loire. The nearest municipalities are: Cernoy-en-Berry (7.7 km), Saint-Martin-sur-Ocre (8 km), Saint-Brisson-sur-Loire (8.1 km), Coullons (8.7 km) km), Poilly-lez-Gien (8.9 km), Blancafort (9.1 km, in the Cher), Saint-Firmin-sur-Loire (10.2 km), Gien (10.6 km), Briare (11 km) and Châtillon-sur-Loire (11.4 km).
Places and monuments
- The remains of the old castle dating from the twelfth century
- The Small Castle dating from the end of the fifteenth century, listed as a historic monument on January 6, 1971
- The Saint-Etienne Church of the nineteenth century bears the name of "Liberty, Equality, Fraternity", motto of the French Republic
- A laundry
- The forest of Saint-Brisson
- The valley of Notre-Heure and its paddle-mills
- The pond of Coudreaux.
Population
| Year | Pop. | ±% |
|---|---|---|
| 1793 | 1,200 | — |
| 1800 | 860 | −28.3% |
| 1806 | 895 | +4.1% |
| 1821 | 1,270 | +41.9% |
| 1831 | 1,225 | −3.5% |
| 1836 | 1,364 | +11.3% |
| 1841 | 1,354 | −0.7% |
| 1846 | 1,391 | +2.7% |
| 1851 | 1,552 | +11.6% |
| 1856 | 1,514 | −2.4% |
| 1861 | 1,528 | +0.9% |
| 1866 | 1,537 | +0.6% |
| 1872 | 1,525 | −0.8% |
| 1876 | 1,545 | +1.3% |
| 1881 | 1,622 | +5.0% |
| 1886 | 1,605 | −1.0% |
| 1891 | 1,666 | +3.8% |
| 1896 | 1,592 | −4.4% |
| 1901 | 1,606 | +0.9% |
| 1906 | 1,577 | −1.8% |
| 1911 | 1,520 | −3.6% |
| 1921 | 1,300 | −14.5% |
| 1926 | 1,237 | −4.8% |
| 1931 | 1,162 | −6.1% |
| 1936 | 1,070 | −7.9% |
| 1946 | 1,096 | +2.4% |
| 1954 | 959 | −12.5% |
| 1962 | 879 | −8.3% |
| 1968 | 853 | −3.0% |
| 1975 | 835 | −2.1% |
| 1982 | 937 | +12.2% |
| 1990 | 919 | −1.9% |
| 1999 | 1,015 | +10.4% |
| 2006 | 1,050 | +3.4% |
| 2009 | 1,020 | −2.9% |
| 2014 | 989 | −3.0% |
See also
References
- "Populations légales 2017". INSEE. Retrieved 6 January 2020.
| Wikimedia Commons has media related to Autry-le-Châtel. |
| Authority control |
|---|