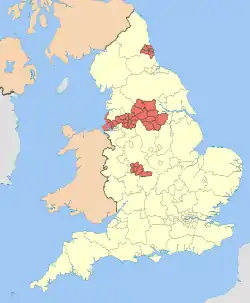
Bury Metropolitan Borough Council elections
One third of Bury Metropolitan Borough Council in Greater Manchester, England is elected each year, followed by one year without election. Since the last boundary changes in 2004, 51 councillors have been elected from 17 wards.[1]
Political control
Since the first election to the council in 1973 political control of the council has been held by the following parties:[2]
| Party in control | Years |
|---|---|
| No overall control | 1973–1975 |
| Conservative | 1975–1986 |
| Labour | 1986–1992 |
| No overall control | 1992–1995 |
| Labour | 1995–2006 |
| No overall control | 2006–2008 |
| Conservative | 2008–2010 |
| No overall control | 2010-2011 |
| Labour | 2011–present |
Council elections
- 1998 Bury Metropolitan Borough Council election
- 1999 Bury Metropolitan Borough Council election
- 2000 Bury Metropolitan Borough Council election
- 2002 Bury Metropolitan Borough Council election
- 2003 Bury Metropolitan Borough Council election
- 2004 Bury Metropolitan Borough Council election (whole Metropolitan Borough Council elected after boundary changes increased the number of seats by 3)[3]
- 2006 Bury Metropolitan Borough Council election
- 2007 Bury Metropolitan Borough Council election
- 2008 Bury Metropolitan Borough Council election
- 2010 Bury Metropolitan Borough Council election
- 2011 Bury Metropolitan Borough Council election
- 2012 Bury Metropolitan Borough Council election
- 2014 Bury Metropolitan Borough Council election
- 2015 Bury Metropolitan Borough Council election
- 2016 Bury Metropolitan Borough Council election
- 2018 Bury Metropolitan Borough Council election
- 2019 Bury Metropolitan Borough Council election
By-election results
| Party | Candidate | Votes | % | ±% | |
|---|---|---|---|---|---|
| Labour | 1,497 | 75.6 | |||
| Conservative | 376 | 19.0 | |||
| Independent | 106 | 5.4 | |||
| Majority | 1,121 | 56.6 | |||
| Turnout | 1,979 | ||||
| Labour hold | Swing | ||||
| Party | Candidate | Votes | % | ±% | |
|---|---|---|---|---|---|
| Liberal Democrats | 960 | 52.1 | -4.3 | ||
| Labour | 559 | 30.3 | +5.9 | ||
| Conservative | 325 | 17.6 | -1.6 | ||
| Majority | 401 | 21.8 | |||
| Turnout | 1,844 | 22.5 | |||
| Liberal Democrats hold | Swing | ||||
| Party | Candidate | Votes | % | ±% | |
|---|---|---|---|---|---|
| Labour | Anthony Cummings | 2,473 | 55.8 | +10.5 | |
| Conservative | Peter Wright | 1,360 | 37.7 | -14.3 | |
| Liberal Democrats | Mike Halsall | 597 | 13.5 | +3.8 | |
| Majority | 1,113 | 18.1 | |||
| Turnout | 4,430 | 55.1 | |||
| Labour hold | Swing | ||||
| Party | Candidate | Votes | % | ±% | |
|---|---|---|---|---|---|
| Labour | Rishi Shori | 879 | 30.7 | -13.9 | |
| Conservative | Samantha Davies | 870 | 30.4 | +3.1 | |
| BNP | Jean Purdy | 459 | 16.0 | -2.2 | |
| Liberal Democrats | Mike Halsall | 429 | 15.0 | +8.4 | |
| English Democrat | Stephen Morris | 228 | 8.0 | +8.0 | |
| Majority | 9 | 0.3 | |||
| Turnout | 2,865 | 35.1 | |||
| Labour hold | Swing | ||||
References
- "Your Council". Bury Council. Archived from the original on 2010-04-30. Retrieved 2010-04-12.
- "Bury". BBC News Online. 2009-04-19. Retrieved 2010-05-07.
- "Bury Metropolitan Borough Council". *BBC News Online. Retrieved 2010-04-12.
- "Tory John fails to oust David". Bolton Evening News. 2001-06-19. Retrieved 2010-04-12.
- "Close victory for Labour in council by-election". Bury Times. 2009-06-05. Archived from the original on 2011-07-20. Retrieved 2010-04-12.
External links
This article is issued from Wikipedia. The text is licensed under Creative Commons - Attribution - Sharealike. Additional terms may apply for the media files.
