Stockport Metropolitan Borough Council elections
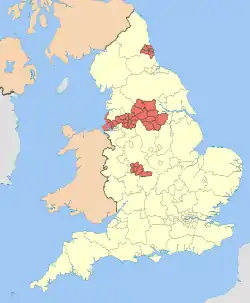
One third of the Metropolitan Borough of Stockport, in Greater Manchester, England is elected each year, followed by one year without election. Since the last boundary changes in 2004, 63 councillors have been elected from 21 wards.[1]
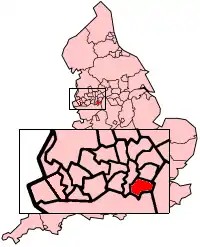
The Metropolitan Borough of Stockport shown within England.
Political control
Since 1973 political control of the council has been held by the following parties:[2]
| Party in control | Years | |
|---|---|---|
| No overall control | 1973–1975 | |
| Conservative | 1975–1983 | |
| No overall control | 1983–1999 | |
| Liberal Democrats | 1999–2000 | |
| No overall control | 2000–2002 | |
| Liberal Democrats | 2002–2011 | |
| No overall control | 2011–present | |
Council elections
- 1973 election
- 1975 election
- 1976 election
- 1978 election
- 1979 election
- 1980 election
- 1982 election
- 1983 election
- 1984 election
- 1986 election
- 1987 election
- 1988 election
- 1990 election
- 1991 election
- 1992 election
- 1994 election
- 1995 election
- 1996 election
- 1998 election
- 1999 election
- 2000 election
- 2002 election
- 2003 election
- 2004 election[lower-alpha 1]
- 2006 election
- 2007 election
- 2008 election
- 2010 election
- 2011 election
- 2012 election
- 2014 election
- 2015 election
- 2016 election
- 2018 election
- 2019 election
- Whole council elected after boundary changes[3]
Borough result maps
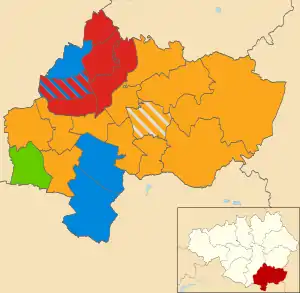 2004 results map
 2006 results map
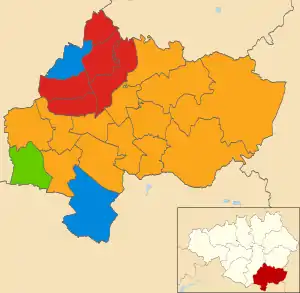 2007 results map
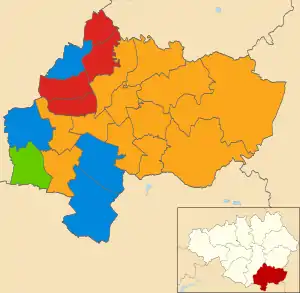 2008 results map
 2010 results map
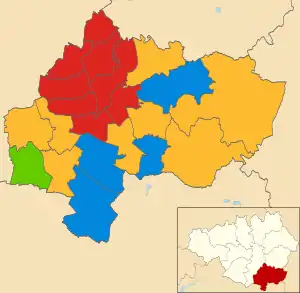 2011 results map
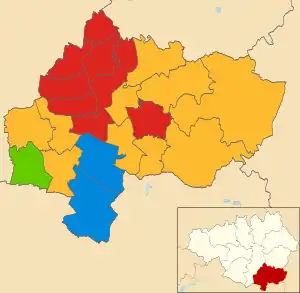 2012 results map
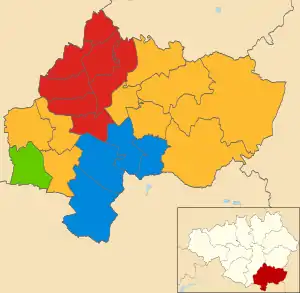 2014 results map
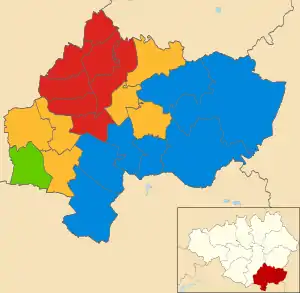 2015 results map
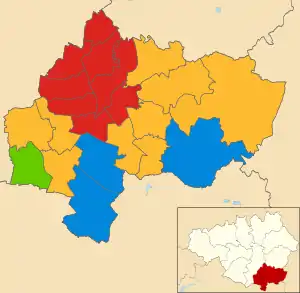 2016 results map
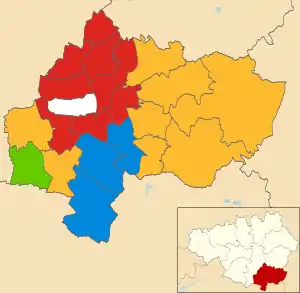 2018 results map
 2019 results map
By-election results
| Party | Candidate | Votes | % | ±% | |
|---|---|---|---|---|---|
| Liberal Democrats | 2,264 | 65.2 | +14.4 | ||
| Conservative | 1,048 | 30.2 | +4.7 | ||
| Labour | 161 | 4.6 | -19.1 | ||
| Majority | 1,218 | 35.0 | |||
| Turnout | 3,473 | 31.3 | |||
| Liberal Democrats hold | Swing | ||||
| Party | Candidate | Votes | % | ±% | |
|---|---|---|---|---|---|
| Liberal Democrats | 1,015 | 46.0 | -0.7 | ||
| Labour | 975 | 44.2 | +4.2 | ||
| Conservative | 165 | 7.5 | -1.4 | ||
| UKIP | 53 | 2.4 | +2.4 | ||
| Majority | 40 | 1.8 | |||
| Turnout | 2,208 | 23.5 | |||
| Liberal Democrats hold | Swing | ||||
| Party | Candidate | Votes | % | ±% | |
|---|---|---|---|---|---|
| Liberal Democrats | 1,830 | 51.9 | -1.2 | ||
| Conservative | 1,458 | 41.3 | +3.1 | ||
| Labour | 143 | 4.1 | -4.6 | ||
| UKIP | 97 | 2.7 | +2.7 | ||
| Majority | 372 | 10.6 | |||
| Turnout | 3,528 | 31.4 | |||
| Liberal Democrats hold | Swing | ||||
| Party | Candidate | Votes | % | ±% | |
|---|---|---|---|---|---|
| Liberal Democrats | Wendy E. Orrell | 1,779 | 47.4 | -6.1 | |
| Conservative | J.D. Wright | 1,336 | 35.6 | -1.0 | |
| UKIP | G. Price | 257 | 6.8 | +6.8 | |
| Labour | J.M. Rothwell | 225 | 6.0 | -0.0 | |
| Green | P. Shaw | 158 | 4.2 | +0.3 | |
| Majority | 443 | 11.8 | |||
| Turnout | 3,775 | 38.7 | |||
| Liberal Democrats hold | Swing | ||||
| Party | Candidate | Votes | % | ±% | |
|---|---|---|---|---|---|
| Labour | David Wilson | 1,218 | 49.5 | +1.0 | |
| Conservative | Gareth Butler | 403 | 16.4 | -8.9 | |
| UKIP | Gerald Price | 342 | 13.9 | +13.9 | |
| Liberal Democrats | Norman Beverley | 303 | 12.3 | +0.7 | |
| BNP | Paul Bennett | 195 | 7.9 | -6.6 | |
| Majority | 815 | 33.1 | |||
| Turnout | 2,461 | 23.5 | |||
| Labour hold | Swing | ||||
| Party | Candidate | Votes | % | ±% | |
|---|---|---|---|---|---|
| Liberal Democrats | Iain Roberts | 2,625 | 52.9 | +7.5 | |
| Conservative | J Smith-Jones | 2,005 | 40.4 | -5.4 | |
| Labour | K Priestley | 143 | 2.9 | -5.9 | |
| UKIP | D Perry | 96 | 1.9 | +1.9 | |
| Green | D Leaver | 91 | 1.8 | +1.8 | |
| Majority | 620 | 12.5 | |||
| Turnout | 4,960 | 43.9 | |||
| Liberal Democrats hold | Swing | ||||
| Party | Candidate | Votes | % | ±% | |
|---|---|---|---|---|---|
| Conservative | John McGahan | 2,080 | 53.2 | ||
| Liberal Democrats | Jeremy Richard Meal | 1,502 | 38.4 | ||
| Green | David James McDonough | 197 | 5.0 | ||
| Labour | Kathryn Ann Priestley | 132 | 3.4 | ||
| Majority | 578 | 14.8 | |||
| Turnout | 3,911 | 39.5 | |||
| Conservative hold | Swing | ||||
| Party | Candidate | Votes | % | ±% | |
|---|---|---|---|---|---|
| Labour | Becky Crawford | 3,877 | 75.0 | ||
| Conservative | Ros Lloyd | 875 | 16.9 | ||
| Liberal Democrats | Alex Orndal | 193 | 3.7 | ||
| Green | James Thomas Pelham | 170 | 3.3 | ||
| Independent | John Chapman Pearson | 56 | 1.1 | ||
| Majority | 3,002 | 55.1 | |||
| Turnout | 5,190 | 48.4 | |||
| Labour hold | Swing | ||||
References
- "Contact Your Councillor". Stockport Metropolitan Borough Council. Archived from the original on 19 April 2010. Retrieved 5 April 2010.
- "Stockport". BBC News Online. 19 April 2008. Retrieved 23 September 2009.
- "Stockport council". BBC News Online. Retrieved 23 July 2009.
- "Election Results". Stockport Metropolitan Borough Council. Retrieved 5 April 2010.
- Manchester Evening News (24 July 2009). "Labour hold onto North Reddish seat". Manchester Evening News. Retrieved 21 March 2018.
- "Bramhall South & Woodford By-Election - Thursday, 20th November, 2014". Stockport Council. Retrieved 27 December 2017.
- "Brinnington & Central Ward by-election 2017 - Thursday, 8th June, 2017". Stockport Council. Retrieved 27 December 2017.
External links
This article is issued from Wikipedia. The text is licensed under Creative Commons - Attribution - Sharealike. Additional terms may apply for the media files.
