2019 Trafford Metropolitan Borough Council election
The 2019 Trafford Metropolitan Borough Council election to elect members of Trafford Metropolitan Borough Council in England took place on 2 May 2019.[1] This was on the same day as other local elections.
 | |||||||||||||||||||||||||||||||||||||||||||||||||||||||||||||||||||||||||||||
21 of 63 seats (One Third) to Trafford Metropolitan Borough Council 32 seats needed for a majority | |||||||||||||||||||||||||||||||||||||||||||||||||||||||||||||||||||||||||||||
|---|---|---|---|---|---|---|---|---|---|---|---|---|---|---|---|---|---|---|---|---|---|---|---|---|---|---|---|---|---|---|---|---|---|---|---|---|---|---|---|---|---|---|---|---|---|---|---|---|---|---|---|---|---|---|---|---|---|---|---|---|---|---|---|---|---|---|---|---|---|---|---|---|---|---|---|---|---|
| |||||||||||||||||||||||||||||||||||||||||||||||||||||||||||||||||||||||||||||
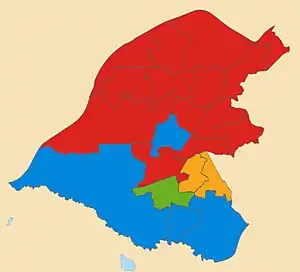
 Map of results of 2019 election | |||||||||||||||||||||||||||||||||||||||||||||||||||||||||||||||||||||||||||||
| |||||||||||||||||||||||||||||||||||||||||||||||||||||||||||||||||||||||||||||
One third of the council stood for election, with each successful candidate serving a four-year term of office, expiring in 2023. Prior to the election the Council had been in a state of no overall control, with the Labour Party running a minority administration through a confidence and supply arrangement with The Liberal Democrats. In the election the Labour Party gained six seats and were therefore capable of forming a majority administration thereafter.
After the election, the composition of the council was:

| Party | Seats | +/- | |
|---|---|---|---|
| Labour | 36 | ||
| Conservative | 20 | ||
| Liberal Democrat | 4 | ||
| Green | 3 | ||
Election Results
Overall election result
Overall result compared with 2018.
| Trafford Metropolitan Borough Council election result, 2019 | |||||||||||||||
|---|---|---|---|---|---|---|---|---|---|---|---|---|---|---|---|
| Party | Candidates | Votes | |||||||||||||
| Stood | Elected | Gained | Unseated | Net | % of total | % | No. | Net % | |||||||
| Labour | 20 | 14 | 6 | 0 | 61.9 | 41.3 | 27,488 | ||||||||
| Conservative | 21 | 4 | 0 | 9 | 19.0 | 29.4 | 19,573 | ||||||||
| Green | 21 | 1 | 1 | 0 | 9.5 | 12.6 | 8,411 | ||||||||
| Liberal Democrats | 21 | 2 | 2 | 0 | 9.5 | 10.6 | 7,072 | ||||||||
| UKIP | 15 | 0 | 0 | 0 | 0.0 | 5.2 | 3,472 | ||||||||
| Liberal | 1 | 0 | 0 | 0 | 0.0 | 0.56 | 367 | N/A | |||||||
| Independent | 2 | 0 | 0 | 0 | 0.0 | 0.38 | 251 | N/A | |||||||
By ward
Asterisk denotes the sitting councillor.
Altrincham ward
| Party | Candidate | Votes | % | ±% | |
|---|---|---|---|---|---|
| Green | Michael Welton | 2,377 | 61.3 | ||
| Conservative | Angela Stone | 1,057 | 27.3 | ||
| Labour | Ged Carter | 313 | 8.1 | ||
| Liberal Democrats | David Martin | 128 | 3.3 | ||
| Majority | 1,320 | 34.1 | N/A | ||
| Registered electors | 8,867 | ||||
| Turnout | 3,875 | 43.96 | |||
| Green gain from Conservative | Swing | ||||
Ashton upon Mersey ward
| Party | Candidate | Votes | % | ±% | |
|---|---|---|---|---|---|
| Labour | Ben Hartley | 1,535 | 42.9 | ||
| Conservative | Mike Whetton* | 1,398 | 39.1 | ||
| Green | Caroline Robertson-Brown | 273 | 7.6 | ||
| Liberal Democrats | Martin Elliott | 247 | 6.9 | ||
| UKIP | Brian Johnson | 127 | 3.5 | ||
| Majority | 137 | 3.83 | |||
| Registered electors | 7,500 | ||||
| Turnout | 3,580 | 47.84 | |||
| Labour gain from Conservative | Swing | ||||
Bowdon ward
| Party | Candidate | Votes | % | ±% | |
|---|---|---|---|---|---|
| Conservative | Claire Churchill | 1,727 | 59.5 | ||
| Liberal Democrats | Ludo Tolhurst-Cleaver | 411 | 14.2 | ||
| Green | Deborah Leftwich | 411 | 14.2 | ||
| Labour | Thomas Hague | 351 | 12.2 | ||
| Majority | 1,316 | 45.4 | |||
| Registered electors | 7,171 | ||||
| Turnout | 2,900 | 40.4 | |||
| Conservative hold | Swing | ||||
Broadheath ward
| Party | Candidate | Votes | % | ±% | |
|---|---|---|---|---|---|
| Labour | Serena Carr | 1,904 | 47.3 | ||
| Conservative | Shengke Zhi | 1,219 | 30.3 | ||
| Green | Daniel Gresty | 346 | 8.6 | ||
| UKIP | Norine Napier | 255 | 6.3 | ||
| Liberal Democrats | Christopher Marritt | 219 | 5.4 | ||
| Independent | Stephen Farndon | 87 | 2.1 | ||
| Majority | 685 | 16.9 | |||
| Registered electors | 9,960 | ||||
| Turnout | 4,030 | 40.64 | |||
| Labour gain from Conservative | Swing | ||||
Brooklands ward
| Party | Candidate | Votes | % | ±% | |
|---|---|---|---|---|---|
| Labour | Rose Thompson | 1,587 | 43.3 | ||
| Conservative | Michelle McGrath | 1,295 | 35.3 | ||
| Green | Joe Ryan | 309 | 8.4 | ||
| Liberal Democrats | Pauline Cliff | 298 | 8.1 | ||
| UKIP | Tony Nayler | 174 | 4.7 | ||
| Majority | 292 | 3.4 | |||
| Registered electors | 7,735 | ||||
| Turnout | 3,663 | 47.6 | |||
| Labour gain from Conservative | Swing | ||||
Bucklow-St. Martins ward
| Party | Candidate | Votes | % | ±% | |
|---|---|---|---|---|---|
| Labour | Aidan Williams* | 988 | 54.6 | ||
| Conservative | Lyall Ainscow | 327 | 18.0 | ||
| UKIP | Andrew Beaumont | 283 | 15.6 | ||
| Green | Rodrigo Capucho Paulo | 134 | 7.4 | ||
| Liberal Democrats | Stephen Power | 76 | 4.2 | ||
| Majority | 661 | 36.6 | |||
| Registered electors | 7,060 | ||||
| Turnout | 1,808 | 25.84 | |||
| Labour hold | Swing | ||||
Clifford ward
| Party | Candidate | Votes | % | ±% | |
|---|---|---|---|---|---|
| Labour | Akilah Akinola | 2,375 | 79.1 | ||
| Green | Jess Mayo | 378 | 12.6 | ||
| Conservative | Alex Finney | 155 | 5.2 | ||
| Liberal Democrats | Dave Nicholson | 93 | 3.0 | ||
| Majority | 1,997 | 66.5 | |||
| Registered electors | 8,351 | ||||
| Turnout | 3,001 | 36.07 | |||
| Labour hold | Swing | ||||
Davyhulme East ward
| Party | Candidate | Votes | % | ±% | |
|---|---|---|---|---|---|
| Labour | Barry Winstanley | 1,929 | 60.9 | ||
| Conservative | Daniel Kupusarevic | 695 | 21.9 | ||
| UKIP | Gary Regan | 253 | 7.9 | ||
| Green | Steven Tennant-Smythe | 184 | 5.8 | ||
| Liberal Democrats | Dawn Carberry-Power | 102 | 3.2 | ||
| Majority | 1,234 | 39.0 | |||
| Registered electors | 7,700 | ||||
| Turnout | 3,163 | 41.26 | |||
| Labour gain from Conservative | Swing | ||||
Davyhulme West ward
| Party | Candidate | Votes | % | ±% | |
|---|---|---|---|---|---|
| Labour | Karina Carter | 1,704 | 53.5 | ||
| Conservative | Lisa Cooke | 965 | 30.3 | ||
| UKIP | Paul Regan | 279 | 8.7 | ||
| Green | Ram Nachiappan | 150 | 4.7 | ||
| Liberal Democrats | Ged Zuk | 86 | 2.7 | ||
| Majority | 739 | 23.2 | |||
| Registered electors | 7,650 | ||||
| Turnout | 3,184 | 41.62 | |||
| Labour gain from Conservative | Swing | ||||
Flixton ward
| Party | Candidate | Votes | % | ±% | |
|---|---|---|---|---|---|
| Labour | Shirley Procter | 2,203 | 58.4 | ||
| Conservative | Jonathan Coupe* | 915 | 24.2 | ||
| UKIP | James Cook | 287 | 7.6 | ||
| Green | Tim Woodward | 217 | 5.7 | ||
| Liberal Democrats | Ian Sutherland | 152 | 4.0 | ||
| Majority | 1,288 | 34.2 | |||
| Registered electors | 8,322 | ||||
| Turnout | 3,774 | 45.51 | |||
| Labour gain from Conservative | Swing | ||||
Gorse Hill ward
| Party | Candidate | Votes | % | ±% | |
|---|---|---|---|---|---|
| Labour | Mike Cordingley* | 1,703 | 65.3 | ||
| Conservative | Gareth Parker | 310 | 11.9 | ||
| Green | Jennie Wadsworth | 252 | 9.6 | ||
| UKIP | Seamus Martin | 212 | 8.1 | ||
| Liberal Democrats | Adam Dean | 129 | 4.9 | ||
| Majority | 1,393 | 53.4 | |||
| Registered electors | 8,391 | ||||
| Turnout | 2,606 | 31.22 | |||
| Labour hold | Swing | ||||
Hale Barns ward
| Party | Candidate | Votes | % | ±% | |
|---|---|---|---|---|---|
| Conservative | Dave Morgan | 1,613 | 57.5 | ||
| Labour Co-op | Barbara Twiney | 378 | 13.5 | ||
| Liberal Democrats | Maggie Boysen | 313 | 11.1 | ||
| Green | Jessica Hession | 196 | 6.9 | ||
| Independent | Sandra Taylor | 164 | 5.8 | ||
| UKIP | Ian Royle | 144 | 5.1 | N/A | |
| Majority | 1,195 | 42.5 | |||
| Registered electors | 7,362 | ||||
| Turnout | 2,808 | 38.26 | |||
| Conservative hold | Swing | ||||
Hale Central ward
| Party | Candidate | Votes | % | ±% | |
|---|---|---|---|---|---|
| Conservative | Patricia Young* | 1,430 | 48.5 | ||
| Liberal Democrats | Will Frass | 555 | 18.8 | ||
| Green | Stephen Leicester | 512 | 17.4 | ||
| Labour | Benjamin Slater | 447 | 17.4 | ||
| Majority | 875 | 29.7 | |||
| Registered electors | 7,388 | ||||
| Turnout | 2,944 | 40.21 | |||
| Conservative hold | Swing | ||||
Longford ward
| Party | Candidate | Votes | % | ±% | |
|---|---|---|---|---|---|
| Labour | Anne Duffield* | 2,150 | 66.9 | ||
| Green | Margaret Westbrook | 406 | 12.6 | ||
| Conservative | Adam Miya | 336 | 10.46 | ||
| Liberal Democrats | Anna Fryer | 318 | 9.9 | ||
| Majority | 1,744 | 54.3 | |||
| Registered electors | 9,098 | ||||
| Turnout | 3,210 | 35.63 | |||
| Labour hold | Swing | ||||
Priory ward
| Party | Candidate | Votes | % | ±% | |
|---|---|---|---|---|---|
| Labour | Andrew Western* | 1,511 | 48.8 | ||
| Conservative | Louis Marks | 679 | 21.9 | ||
| Green | Nicholas Robertson-Brown | 404 | 13.0 | ||
| Liberal Democrats | Briony Stephenson | 305 | 9.8 | ||
| UKIP | Kevin Grime | 199 | 6.4 | N/A | |
| Majority | 832 | 26.85 | |||
| Registered electors | 8,052 | ||||
| Turnout | 3,098 | 38.61 | |||
| Labour hold | Swing | ||||
Sale Moor ward
| Party | Candidate | Votes | % | ±% | |
|---|---|---|---|---|---|
| Labour Co-op | Joanne Bennett* | 1,347 | 52.4 | ||
| Conservative | Matt Leigh | 664 | 25.9 | ||
| Green | Jane Leicester | 355 | 13.8 | ||
| Liberal Democrats | Simon Wright | 203 | 7.9 | ||
| Majority | 683 | 26.6 | |||
| Registered electors | 7,549 | ||||
| Turnout | 2,569 | 34.03 | |||
| Labour hold | Swing | ||||
St. Mary's ward
| Party | Candidate | Votes | % | ±% | |
|---|---|---|---|---|---|
| Conservative | Dan Bunting* | 1,527 | 49.1 | ||
| Labour | Jill Axford | 920 | 29.6 | ||
| Green | James McGlashan | 294 | 9.4 | ||
| Liberal Democrats | Alison Smith | 188 | 6.0 | ||
| UKIP | Kathy Mason | 184 | 5.9 | N/A | |
| Majority | 607 | 19.5 | |||
| Registered electors | 8,611 | ||||
| Turnout | 3,113 | 36.15 | |||
| Conservative hold | Swing | ||||
Stretford ward
| Party | Candidate | Votes | % | ±% | |
|---|---|---|---|---|---|
| Labour | Stephen Adshead* | 1,843 | 66.0 | ||
| Conservative | Kwok Leung | 329 | 11.8 | ||
| Green | Liz O'Neill | 304 | 10.9 | ||
| UKIP | Barbara McDermott | 208 | 7.5 | ||
| Liberal Democrats | Simon Lepori | 107 | 3.8 | ||
| Majority | 1,514 | 54.2 | |||
| Registered electors | 7,843 | ||||
| Turnout | 2,791 | 35.6 | |||
| Labour hold | Swing | ||||
Timperley ward
| Party | Candidate | Votes | % | ±% | |
|---|---|---|---|---|---|
| Liberal Democrats | Meena Minnis | 1,653 | 42.4 | ||
| Conservative | Angela Bruer-Morris* | 1,266 | 32.5 | ||
| Green | Jadwiga Leigh | 423 | 10.9 | ||
| Liberal | Neil Taylor | 367 | 9.4 | ||
| UKIP | Pauline Royle | 187 | 4.8 | N/A | |
| Majority | 387 | 9.9 | |||
| Registered electors | 8,410 | ||||
| Turnout | 3,896 | 46.33 | |||
| Liberal Democrats gain from Conservative | Swing | ||||
Urmston ward
| Party | Candidate | Votes | % | ±% | |
|---|---|---|---|---|---|
| Labour Co-op | Jo Harding* | 1,844 | 54.6 | ||
| Conservative | John Lijo | 724 | 21.4 | ||
| UKIP | Krissy Douglas | 340 | 10.1 | ||
| Green | Luciya Whyte | 290 | 8.6 | ||
| Liberal Democrats | Shaun Ennis | 179 | 5.3 | ||
| Majority | 1,120 | 33.2 | |||
| Registered electors | 8,472 | ||||
| Turnout | 3,394 | 40.06 | |||
| Labour hold | Swing | ||||
Village ward
| Party | Candidate | Votes | % | ±% | |
|---|---|---|---|---|---|
| Liberal Democrats | Julian Newgrosh | 1,310 | 41.0 | ||
| Conservative | Darren Meacher | 942 | 29.4 | ||
| Labour | Waseem Hassan | 456 | 14.3 | ||
| UKIP | Angela O'Neill | 295 | 9.2 | ||
| Green | Robert Raikes | 196 | 6.1 | ||
| Majority | 368 | 11.50 | |||
| Registered electors | 7,905 | ||||
| Turnout | 3,199 | 40.47 | |||
| Liberal Democrats gain from Conservative | Swing | ||||
References
- Staff writer (3 May 2019). "Local Election 2019 Results". trafford.gov.uk. Trafford MBC. Archived from the original on 3 May 2019. Retrieved 5 May 2019.

.jpg.webp)