Demographics of Punjab, India
According to the 2011 Census of India, Punjab, India has a population of around 27.7 million.
| Population Growth | |||
|---|---|---|---|
| Census | Population | %± | |
| 1951 | 9,161,000 | — | |
| 1961 | 11,135,001 | 21.5% | |
| 1971 | 13,551,000 | 21.7% | |
| 1981 | 16,788,915 | 23.9% | |
| 1991 | 20,281,969 | 20.8% | |
| 2001 | 24,358,999 | 20.1% | |
| 2011 | 27,743,338 | 13.9% | |
| source:Census of India [1][2] | |||
Caste population
As of September 2020, the caste population data for each upper caste citizen in Punjab collected in Socio Economic and Caste Census 2011 has not been released to public by Government of India.[3][4]
| Caste Population data of Punjab | ||
|---|---|---|
| Constitutional categories | Population (%) | Castes |
| Other Backward Classes (OBC) | 31.3%[5] | includes Sikh Rajputs,[6] Saini (Sainis added to OBC list in 2016[7]), Sunar, Kamboj, Labana, Tarkhan/Ramgarhia, Kumhar/Prajapati, Arain, Gurjar, Teli, Banjara, Lohar, Bhat,[8] Others |
| Scheduled Castes (Dalits) | 31.9%[9] | includes Mazhabi Sikh - 10%, Ramdasia Sikh/Ravidassia (Chamar)/Ad-Dharmi - 13.1%, Balmiki/Bhanghi - 3.5%, Bazigar - 1.05%, Others - 4%[10] |
| Others | 33% | includes Jat Sikh - 21%,[11] (Brahmin, Khatri, Rajput, Bania,-Arora-Sood[12]) - 12% |
| religious minorities | 3.8%[13] | includes Muslims, Christians, Buddhists, Jains |
Languages spoken
The Punjabi language written in the Gurmukhi script is the official language of the state.[16] Muslims form slight majority in the Malerkotla town and use Shahmukhi for communication purpose.[17] Punjabi is the sole official language of Punjab and is spoken by the majority of the population numbering around 24,919,067 constituting (89.82%) of the population as of 2011 census report. Hindi is second largest language, spoken by 2,177,853 constituting 7.85% of the population and rest 646,418 spoke's other Indian languages comprising 2.83% in other category.[14]
Religions in Punjab
Religions in Punjab, India (2011)
Sikhism is the most practiced faith in Punjab, practiced by 16 million people representing 57.69% of the population of Punjab population. Around 38.49% of the population i.e. 10.67 million practice Hinduism, while Islam is followed by 5.35 lakhs comprising 1.93% of the state population.[18] Other micro-faiths include Buddhism, Christianity and Jainism.[19]
| Religion | 2001[20] | 2011[21] |
|---|---|---|
| Sikhism | 14,592,387 | 16,004,754 |
| Hinduism | 8,997,942 | 10,678,138 |
| Islam | 382,045 | 535,489 |
| Christianity | 292,800 | 348,230 |
| Jainism | 39,276 | 45,040 |
| Buddhism | 41,487 | 33,237 |
| Other | 8,594 | 10,886 |
| Not stated | n/a | 87,564 |
| Total | 24,358,999 | 27,743,338 |
| Religion | 2001[20] | 2011[20] |
|---|---|---|
| Sikhism | 59.90 | 57.69 |
| Hinduism | 36.94 | 38.49 |
| Islam | 1.57 | 1.93 |
| Christianity | 1.20 | 1.26 |
| Jainism | 0.16 | 0.16 |
| Buddhism | 0.17 | 0.12 |
| Other | 0.03 | 0.04 |
| Not stated | n/a | 0.31 |
Religions in Punjab 1946 (before partition)
Note: It's includes only the present geographical area of Punjab i.e after the 1966 part of geographical area.
Present day India's Punjab have a population 9,238,810 as per 1946 statics concerned, Sikhism is marginally the majority religion of the region practiced by 4,679,599, Islam being second largest religion practiced by 2,699,651, while 1,619,878 adheres to Hindu faith. Other minority religion community includes; Christians at 188,576, Buddhists at 27,290, Jains at 22,741, while 1,075 people follow other religions or not stated anyone.[25][26][27]
Sikhism in Punjab
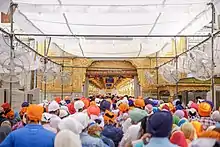
Sikhism was born in the Punjab area of South Asia, which now falls into the present day states of India and Pakistan. The main religions of the area at the time were Hinduism and Islam. The Sikh faith began around 1500 CE, when Guru Nanak began teaching a faith that was quite distinct from Hinduism and Islam. Nine Gurus followed Nanak and developed the Sikh faith and community over the next centuries.[28]
| Year | Pop. | ±% |
|---|---|---|
| 1951 | 5,553,918 | — |
| 1961 | 6,178,516 | +11.2% |
| 1971 | 8,160,232 | +32.1% |
| 1981 | 10,199,534 | +25.0% |
| 1991 | 12,768,393 | +25.2% |
| 2001 | 14,592,868 | +14.3% |
| 2011 | 16,004,754 | +9.7% |
| Source: census of India,[29][30] | ||
The Sikh population in India's Punjab have grown from 5.53 million in 1951 to 16 million in 2011 census (an increase of 10.47 million in last 60 years).
Percentage of Sikhism by decades[31][32]
| Year | Percent | Increase |
|---|---|---|
| 1951 | 60.62% | - |
| 1961 | 55.48% | -5.14% |
| 1971 | 60.22% | +4.74% |
| 1981 | 60.75% | +0.53% |
| 1991 | 62.95% | +2.2% |
| 2001 | 59.91% | -3.04% |
| 2011 | 57.69% | -2.22% |
While population of people who adheres to Sikh faith have increased, but the Sikh Percentage have declined from 60.62% in 1951 to 57.69% (a decline of 2.93% in last 60 years).
Religious population by districts
| # | District | Sikh | Hindu | Muslim | Christian | Jain | Buddhist | Other religions | Religion not stated |
|---|---|---|---|---|---|---|---|---|---|
| 1 | Amritsar | 1,716,935 | 690,939 | 12,502 | 54,344 | 3,152 | 876 | 5,488 | 1,0864 |
| 2 | Barnala | 467,751 | 112,859 | 13,100 | 622 | 246 | 108 | 481 | 360 |
| 3 | Bathinda | 984,286 | 380,569 | 16,299 | 2,474 | 1,266 | 246 | 559 | 2,826 |
| 4 | Faridkot | 469,789 | 141,363 | 3,125 | 1,227 | 1,109 | 155 | 103 | 637 |
| 5 | Fatehgarh Sahib | 427,521 | 152,851 | 16,808 | 1,698 | 178 | 48 | 251 | 808 |
| 6 | Firozpur | 1,090,815 | 906,408 | 6,844 | 19,358 | 1,143 | 454 | 278 | 3,774 |
| 7 | Gurdaspur | 1,002,874 | 1,074,332 | 27,667 | 176,587 | 580 | 405 | 812 | 15,066 |
| 8 | Hoshiarpur | 538,208 | 1,000,743 | 23,089 | 14,968 | 2034 | 3,476 | 531 | 3,576 |
| 9 | Jalandhar | 718,363 | 1,394,329 | 30,233 | 26,016 | 4,011 | 11,385 | 805 | 8,448 |
| 10 | Kapurthala | 453,692 | 336,124 | 10,190 | 5,445 | 553 | 6,662 | 334 | 2,168 |
| 11 | Ludhiana | 1,863,408 | 1,502,403 | 77,713 | 16,517 | 19,620 | 2,007 | 1,254 | 15,817 |
| 12 | Mansa | 598,443 | 156,539 | 10,375 | 917 | 1,577 | 123 | 493 | 1,284 |
| 13 | Moga | 818,921 | 158,414 | 9,388 | 3,277 | 436 | 178 | 365 | 4,767 |
| 14 | Muktsar | 638,625 | 254,920 | 4,333 | 1,681 | 744 | 240 | 433 | 920 |
| 15 | Patiala | 1,059,944 | 783,306 | 40,043 | 5,683 | 1,914 | 245 | 1,410 | 3,141 |
| 16 | Rupnagar | 361,045 | 304,481 | 14,492 | 2,094 | 653 | 118 | 143 | 1,601 |
| 17 | Mohali | 478,908 | 476,276 | 29,488 | 5,342 | 1,257 | 257 | 239 | 2,861 |
| 18 | Sangrur | 1,077,438 | 389,410 | 179,116 | 2,406 | 3,222 | 268 | 1,038 | 2,271 |
| 19 | Nawanshehar | 192,885 | 401,368 | 6,829 | 1,479 | 695 | 5,885 | 266 | 2,903 |
| 20 | Tarn Taran | 1,044,903 | 60,504 | 3,855 | 6,095 | 650 | 101 | 47 | 3,472 |
Punjab (Total) | 16,004,754 | 10,678,138 | 535,489 | 348,230 | 45,040 | 33,237 | 10,886 | 87,564 | |
| # | District | Sikh | Hindu | Muslim | Christian | Jain | Buddhist | Other religions | Religion not stated |
|---|---|---|---|---|---|---|---|---|---|
| 1 | Amritsar | 68.94% | 27.74% | 0.50% | 2.18% | 0.13% | 0.04% | 0.04% | 0.44% |
| 2 | Barnala | 78.54% | 18.95% | 2.20% | 0.10% | 0.04% | 0.02% | 0.08% | 0.06% |
| 3 | Bathinda | 70.89% | 27.41% | 1.17% | 0.18% | 0.09% | 0.02% | 0.04% | 0.20% |
| 4 | Faridkot | 76.08% | 22.89% | 0.51% | 0.20% | 0.18% | 0.03% | 0.02% | 0.10% |
| 5 | Fatehgarh Sahib | 71.23% | 25.47% | 2.80% | 0.28% | 0.03% | 0.01% | 0.04% | 0.13% |
| 6 | Firozpur | 53.76% | 44.67% | 0.34% | 0.95% | 0.06% | 0.02% | 0.01% | 0.19% |
| 7 | Gurdaspur | 43.64% | 46.74% | 1.20% | 7.68% | 0.03% | 0.02% | 0.04% | 0.66% |
| 8 | Hoshiarpur | 33.92% | 63.07% | 1.46% | 0.94% | 0.13% | 0.22% | 0.03% | 0.23% |
| 9 | Jalandhar | 32.75% | 63.56% | 1.38% | 1.19% | 0.18% | 0.52% | 0.04% | 0.39% |
| 10 | Kapurthala | 55.66% | 41.23% | 1.25% | 0.67% | 0.07% | 0.82% | 0.04% | 0.27% |
| 11 | Ludhiana | 53.26% | 42.94% | 2.22% | 0.47% | 0.56% | 0.06% | 0.04% | 0.45% |
| 12 | Mansa | 77.75% | 20.34% | 1.35% | 0.12% | 0.20% | 0.02% | 0.06% | 0.17% |
| 13 | Moga | 82.24% | 15.91% | 0.94% | 0.33% | 0.04% | 0.02% | 0.04% | 0.48% |
| 14 | Muktsar | 70.81% | 28.26% | 0.48% | 0.19% | 0.08% | 0.03% | 0.05% | 0.10% |
| 15 | Patiala | 55.91% | 41.32% | 2.11% | 0.30% | 0.10% | 0.01% | 0.07% | 0.17% |
| 16 | Rupnagar | 52.74% | 44.47% | 2.12% | 0.31% | 0.10% | 0.02% | 0.02% | 0.23% |
| 17 | Mohali | 48.15% | 47.88% | 2.96% | 0.54% | 0.13% | 0.03% | 0.02% | 0.29% |
| 18 | Sangrur | 65.10% | 23.53% | 10.82% | 0.15% | 0.19% | 0.02% | 0.06% | 0.14% |
| 19 | Nawanshehar | 31.50% | 65.55% | 1.12% | 0.24% | 0.11% | 0.96% | 0.04% | 0.47% |
| 20 | Tarn Taran | 93.33% | 5.40% | 0.34% | 0.54% | 0.06% | 0.01% | 0.00% | 0.31% |
Punjab (Total) | 57.69% | 38.49% | 1.93% | 1.26% | 0.16% | 0.12% | 0.04% | 0.32% | |
See also
References
- "Demographic Trends". Census of India. www.punenvis.nic.in. Archived from the original on 10 April 2009. Retrieved 4 June 2008.
- "Census Population" (PDF). Census of India. Ministry of Finance India. Archived from the original (PDF) on 19 December 2008. Retrieved 18 December 2008.
- "Raw caste data collected in 2011 given to social justice ministry, govt tells Rajya Sabha". ThePrint. 16 September 2020. Retrieved 27 September 2020.
- "'Caste Census-2011 not yet released'". The Hindu. Special Correspondent. 27 June 2018. ISSN 0971-751X. Retrieved 30 July 2018.CS1 maint: others (link)
- "Quota will have little impact in Punjab". The Tribune. 11 January 2019. Retrieved 30 December 2019.
- "Punjab Cabinet to discuss rolling back backward status for Sikh Rajputs". The Indian Express. 27 December 2017. Retrieved 30 July 2018.
- "Saini, Swarnkar/Sunar communities to be backward classes in Punjab". The Indian Express. 10 September 2016. Retrieved 8 December 2019.
- "CENTRAL LIST OF OBCs FOR THE STATE OF PUNJAB" (PDF). ncbc.nic.in.
- "SCs, STs form 25% of population, says Census 2011 data". The Indian Express. 1 May 2013. Retrieved 20 March 2018.
The highest SC population, 31.9 per cent of the state's total number, is in Punjab
- "PUNJAB DATA HIGHLIGHTS: THE SCHEDULED CASTES" (PDF). Censusindia.gov.in. Retrieved 6 July 2016.
- "The Jats in Punjab comprise 21 per cent population - India Today". Indiatoday.intoday.in. Retrieved 6 July 2016.
- "History - Khatri Sabha NCR". khatrisabhancr.com. Archived from the original on 19 July 2018. Retrieved 30 July 2018.
- "Census Reference Tables, C-Series Population by religious communities". censusindia.gov.in. Retrieved 18 August 2019.
- "Language – India, States and Union Territories" (PDF). Census of India 2011. Office of the Registrar General. pp. 13–14. Retrieved 19 October 2018.
- "C-16 Population By Mother Tongue - Punjab". censusindia.gov.in. Retrieved 16 March 2020.
- Singh, Roopinder (9 June 2019). "Punjabi fading in 'Punjabi Suba'". The Tribune. Retrieved 8 December 2019.
- India, Tribune (17 June 2020). "Waqf Board divided over use of Punjabi in recruitment". The Tribune. Retrieved 7 September 2020.
- "Although the OBC share in the country's population is about 41 per cent, in states like Punjab, the concentration of the OBC population is less than 25 per cent". Hindustantimes.com. Retrieved 6 July 2016.
- "Population by religious community: Punjab". 2011 Census of India. Retrieved 27 August 2015.
- "Total population by religious communities". Censusindia.gov.in. Archived from the original on 19 January 2008. Retrieved 20 November 2014.
- "Indian Census 2011". Census Department, Government of India. Archived from the original on 13 September 2015. Retrieved 25 August 2015.
- punjab.global.ucsb.edu › filesPDF Demography of the Punjab (1849-1947)
- www.jstor.org › stable The Sikh Princes and the East Punjab Massacres of 1947 - JStor
- www.asiaportal.info › ethnic-cleansi... Ethnic cleansing and genocidal massacres 65 years ago by ...
- punjab.global.ucsb.edu › filesPDF Demography of the Punjab (1849-1947)
- www.jstor.org › stable The Sikh Princes and the East Punjab Massacres of 1947 - JStor
- www.asiaportal.info › ethnic-cleansi... Ethnic cleansing and genocidal massacres 65 years ago by ...
- https://www.bbc.co.uk/religion/religions/sikhism/history/history_1.shtml
- www.epw.in › files › pdf › re...PDF Web results Religious Composition of Punjab's Population - Economic and ...
- www.cpsindia.org › Blog8PDF The Declining share of Sikhs in the population of India
- www.epw.in › files › pdf › re...PDF Web results Religious Composition of Punjab's Population - Economic and ...
- www.cpsindia.org › Blog8PDF The Declining share of Sikhs in the population of India
| Topics | 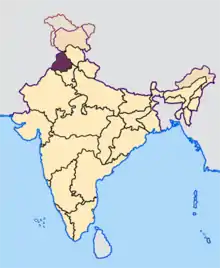 | |
|---|---|---|
| Administration |
| |
| Culture |
| |
| Divisions |
| |
| Districts | ||
| Major Cities | ||