Iowa's 3rd congressional district
Iowa's 3rd congressional district is a congressional district in the U.S. state of Iowa that covers its southwest quadrant, roughly an area including Des Moines to the borders with Nebraska and Missouri.
| Iowa's 3rd congressional district | |||
|---|---|---|---|
.tif.png.webp) Iowa's 3rd congressional district since January 3, 2013 | |||
| Representative |
| ||
| Distribution |
| ||
| Population (2019) | 848,170 | ||
| Median household income | $67,681[1] | ||
| Ethnicity | |||
| Cook PVI | R+1[3] | ||
From 2003 to 2013 it encompassed Des Moines (on the western end) to the western outskirts of the metropolitan area of Cedar Falls and Waterloo (on the northeastern end) to the western outskirts of the Cedar Rapids area (on the eastern end) and to Lucas County and Monroe County (on the southern end).
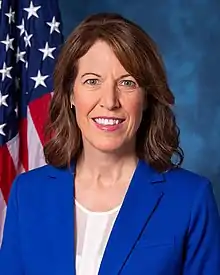
The district has been represented in the United States House of Representatives by Democrat Cindy Axne since 2019.
Statewide races since 2000
Election results from statewide races:
| Office | Year | District | Statewide | Nationwide |
|---|---|---|---|---|
| President | 2000 | Al Gore 49% – George W. Bush 48% | Gore | Bush |
| 2004 | George W. Bush 50% – John Kerry 50% | Bush | ||
| 2008 | Barack Obama 54% – John McCain 44% | Obama | Obama | |
| 2012 | Barack Obama 51% – Mitt Romney 47% | |||
| 2016 | Donald Trump 48% – Hillary Clinton 45% | Trump | Trump | |
| 2020 | Donald Trump 49.1% – Joe Biden 49.0% | Biden |
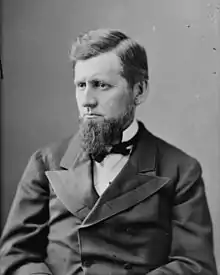
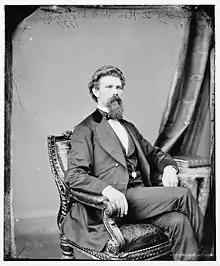
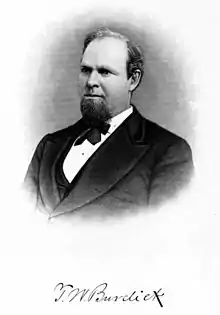
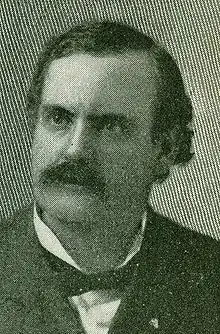
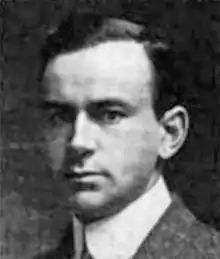
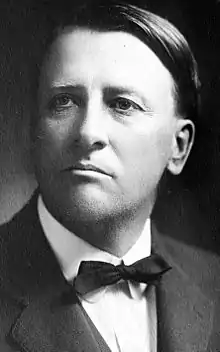
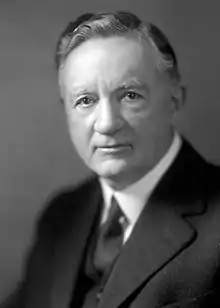
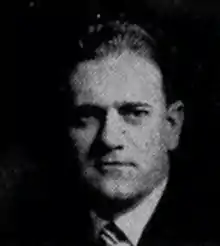
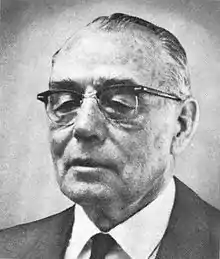
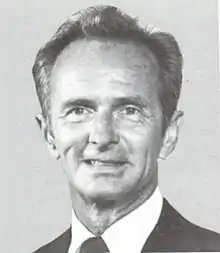
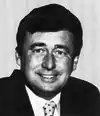
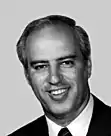
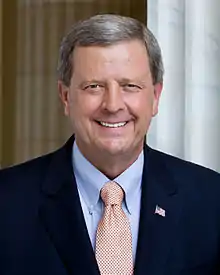
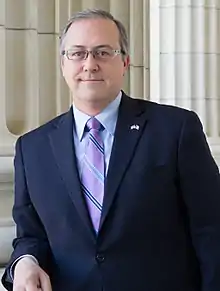
List of members representing the district

.jpg.webp)

.jpg.webp)
.jpg.webp)


Recent election results
| Year[4] | Winner | Second | Percentage | ||||
|---|---|---|---|---|---|---|---|
| Party affiliation | Candidate | Votes | Party affiliation | Candidate | Votes | ||
| 1920 | Republican | Burton E. Sweet | 67,859 | Farmer–Labor | Roy Jacobs | 1,974 | 97% – 3% |
| 1922 | Thomas J. B. Robinson | 34,518 | Democratic | Fred P. Hageman | 24,304 | 58% – 41% | |
| 1924 | 54,921 | Willis N. Birdsall | 25,215 | 69% – 31% | |||
| 1926 | 32,180 | Ellis E. Wilson | 13,696 | 70% – 30% | |||
| 1928 | 60,025 | Leo. F. Tierney | 38,469 | 61% – 39% | |||
| 1930 | 27,098 | W. L. Beecher | 15,908 | 63% – 37% | |||
| 1932 | Democratic | Albert C. Willford | 48,939 | Republican | Thomas J. B. Robinson | 47,776 | 51% – 49% |
| 1934 | Republican | John W. Gwynne | 42,063 | Democratic | Albert C. Willford | 35,159 | 51% – 43% |
| 1936 | 53,928 | 47,391 | 52% – 46% | ||||
| 1938 | 45,541 | W. F. Hayes | 30,158 | 60% – 40% | |||
| 1940 | 65,425 | Ernest J. Seemann | 43,709 | 60% – 40% | |||
| 1942 | 54,124 | William D. Kearney | 35,065 | 61% – 39% | |||
| 1944 | 74,901 | 56,985 | 58% – 42% | ||||
| 1946 | 48,346 | Dan J. P. Ryan | 29,661 | 62% – 38% | |||
| 1948 | H. R. Gross | 78,838 | 56,002 | 58% – 41% | |||
| 1950 | 73,490 | James O. Babcock | 40,786 | 64% – 36% | |||
| 1952 | 109,992 | George R. Laub | 56,871 | 66% – 34% | |||
| 1954 | 68,307 | 41,622 | 62% – 38% | ||||
| 1956 | 97,590 | Michael Micich | 69,076 | 59% – 41% | |||
| 1958 | 61,920 | 53,467 | 54% – 46% | ||||
| 1960 | 99,046 | Edward J. Gallagher Jr. | 76,837 | 56% – 44% | |||
| 1962 | 66,337 | Neel F. Hill | 50,580 | 57% – 43% | |||
| 1964 | 83,455 | Stephen M. Peterson | 83,036 | 50.1% – 49.9% | |||
| 1966 | 79,343 | L. A. Pat Touchae | 48,530 | 62% – 38% | |||
| 1968 | 101,839 | John E. Van Eschen | 57,164 | 64% – 36% | |||
| 1970 | 66,087 | Lyle D. Taylor | 45,958 | 59% – 41% | |||
| 1972 | 109,113 | 86,848 | 56% – 44% | ||||
| 1974 | Chuck Grassley | 77,468 | Stephen Rapp | 74,859 | 51% – 49% | ||
| 1976 | 117,957 | 90,981 | 56% – 44% | ||||
| 1978 | 103,659 | John Knudson | 34,880 | 75% – 25% | |||
| 1980 | T. Cooper Evans | 107,869 | Lynn G. Cutler | 101,735 | 51% – 48% | ||
| 1982 | 104,072 | 83,581 | 55% – 45% | ||||
| 1984 | 133,737 | Joe Johnston | 86,574 | 61% – 39% | |||
| 1986 | Democratic | David R. Nagle | 83,504 | Republican | John McIntee | 69,386 | 55% – 45% |
| 1988 | 129,204 | Donald B. Redfern | 74,682 | 63% – 37% | |||
| 1990 | 100,947 | unopposed | 833 | 99% – 1% | |||
| 1992 | Republican | Jim Ross Lightfoot | 125,931 | Democratic | Elaine Baxter | 121,063 | 49% – 47% |
| 1994 | 111,862 | 79,310 | 58% – 41% | ||||
| 1996 | Democratic | Leonard Boswell | 115,914 | Republican | Mike Mahaffey | 111,895 | 49% – 48% |
| 1998 | 107,947 | Larry McKibben | 78,063 | 57% – 41% | |||
| 2000 | 156,327 | Jay Marcus | 83,810 | 63% – 34% | |||
| 2002 | 115,367 | Stan Thompson | 97,285 | 53% – 45% | |||
| 2004 | 168,007 | 136,099 | 55% – 45% | ||||
| 2006 | 114,689 | Jeff Lamberti | 103,182 | 52% – 47% | |||
| 2008 | 175,423 | Kim Schmett | 131,524 | 56% – 42% | |||
| 2010 | 122,147 | Brad Zaun | 111,925 | 50% – 46% | |||
| 2012 | Republican | Tom Latham | 202,000 | Democratic | Leonard Boswell | 168,632 | 51% – 42% |
| 2014 | David Young | 148,814 | Staci Appel | 119,109 | 52% – 42% | ||
| 2016 | 208,598 | Jim Mowrer | 155,002 | 53% – 40% | |||
| 2018 | Democratic | Cindy Axne | 169,888 | Republican | David Young | 164,667 | 49% – 47% |
2002
| Party | Candidate | Votes | % | |
|---|---|---|---|---|
| Democratic | Leonard Boswell* | 115,367 | 53.41 | |
| Republican | Stan Thompson | 97,285 | 45.04 | |
| Libertarian | Jeffrey J. Smith | 2,689 | 1.25 | |
| Socialist Workers | Edwin B. Fruit | 569 | 0.26 | |
| No party | Others | 75 | 0.04 | |
| Total votes | 215,985 | 100.00 | ||
| Turnout | ||||
| Democratic hold | ||||
2004
| Party | Candidate | Votes | % | |
|---|---|---|---|---|
| Democratic | Leonard Boswell* | 168,007 | 55.21 | |
| Republican | Stan Thompson | 136,009 | 44.72 | |
| No party | Others | 213 | 0.07 | |
| Total votes | 304,229 | 100.00 | ||
| Turnout | ||||
| Democratic hold | ||||
2006
| Party | Candidate | Votes | % | |
|---|---|---|---|---|
| Democratic | Leonard Boswell* | 115,769 | 51.85 | |
| Republican | Jeff Lamberti | 103,722 | 46.45 | |
| Socialist Workers | Helen Meyers | 3,591 | 1.61 | |
| No party | Others | 205 | 0.09 | |
| Total votes | 223,287 | 100.00 | ||
| Turnout | ||||
| Democratic hold | ||||
2008
| Party | Candidate | Votes | % | |
|---|---|---|---|---|
| Democratic | Leonard Boswell* | 176,904 | 56.31 | |
| Republican | Kim Schmett | 132,136 | 42.06 | |
| Socialist Workers | Frank Forrestal | 4,599 | 1.46 | |
| No party | Others | 521 | 0.17 | |
| Total votes | 314,160 | 100.00 | ||
| Turnout | ||||
| Democratic hold | ||||
2010
| Party | Candidate | Votes | % | |
|---|---|---|---|---|
| Democratic | Leonard Boswell* | 122,147 | 50.73 | |
| Republican | Brad Zaun | 111,925 | 46.49 | |
| Socialist Workers | Rebecca Williamson | 6,258 | 2.60 | |
| No party | Others | 426 | 0.18 | |
| Total votes | 240,756 | 100.00 | ||
| Turnout | ||||
| Democratic hold | ||||
2012
| Party | Candidate | Votes | % | |||
|---|---|---|---|---|---|---|
| Republican | Tom Latham* | 202,000 | 50.56 | |||
| Democratic | Leonard Boswell* | 168,632 | 42.20 | |||
| Independent | Scott G. Batcher | 9,352 | 2.34 | |||
| Socialist Workers | David Rosenfeld | 6,286 | 1.57 | |||
| No party | Others | 572 | 0.14 | |||
| Total votes | 399,561 | 100.00 | ||||
| Turnout | ||||||
| Republican gain from Democratic | ||||||
2014
| Party | Candidate | Votes | % | |
|---|---|---|---|---|
| Republican | David Young | 148,814 | 52.8 | |
| Democratic | Staci Appel | 119,109 | 42.2 | |
| Libertarian | Edward Wright | 9,054 | 3.2 | |
| No party preference | Bryan Jack Holder | 4,360 | 1.5 | |
| Write-ins | 729 | 0.3 | ||
| Total votes | 282,066 | 100 | ||
| Republican hold | ||||
2016

Map showing the results of the 2016 election in Iowa's 3rd congressional district by county
| Party | Candidate | Votes | % | |
|---|---|---|---|---|
| Republican | David Young* | 208,598 | 53.45 | |
| Democratic | Jim Mowrer | 155,002 | 39.71 | |
| Libertarian | Bryan Jack Holder | 15,372 | 3.94 | |
| Nominated by Petition | Claudia Addy | 6,348 | 1.63 | |
| Nominated by Petition | Joe Grandanette | 4,518 | 1.16 | |
| Write-ins | 449 | 0.12 | ||
| Total votes | 390,287 | 100.00 | ||
| Republican hold | ||||
2018
| Party | Candidate | Votes | % | ±% | |
|---|---|---|---|---|---|
| Democratic | Cindy Axne | 169,888 | 49.0 | +9.29 | |
| Republican | David Young* | 164,667 | 47.49 | -5.96 | |
| Libertarian | Bryan Jack Holder | 7,005 | 2.02 | −1.92 | |
| Legal Marijuana Now | Mark Elworth Jr. | 1,906 | 0.55 | +0.55 | |
| Green | Paul Knupp | 1,795 | 0.52 | +0.52 | |
| Independent | Joe Grandanette | 1,271 | 0.37 | −0.79 | |
| Write-ins | 178 | 0.05 | +0.00 | ||
| Plurality | 5,221 | 1.51 | |||
| Turnout | 346,710 | 100 | |||
| Democratic gain from Republican | Swing | +15.25 | |||
2020
| Party | Candidate | Votes | % | |
|---|---|---|---|---|
| Democratic | Cindy Axne (incumbent) | 219,205 | 48.9 | |
| Republican | David Young | 212,997 | 47.6 | |
| Libertarian | Bryan Jack Holder | 15,361 | 3.4 | |
| Write-in | 384 | 0.1 | ||
| Total votes | 447,947 | 100.0 | ||
| Democratic hold | ||||
Historical district boundaries
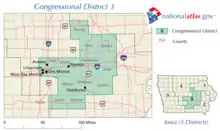
2003–2013
References
- https://www.census.gov/mycd/?st=19&cd=03
- https://censusreporter.org/profiles/50000US1903-congressional-district-3-ia/
- "Partisan Voting Index – Districts of the 115th Congress" (PDF). The Cook Political Report. April 7, 2017. Retrieved April 7, 2017.
- "Election Statistics,". 2005. Archived from the original on 2007-07-25.
- "Iowa General Election 2018". Iowa Secretary of State. Retrieved November 11, 2018.
- "General Election - 2020 Canvass Summary" (PDF). Iowa Secretary of State.
- Martis, Kenneth C. (1989). The Historical Atlas of Political Parties in the United States Congress. New York: Macmillan Publishing Company.
- Martis, Kenneth C. (1982). The Historical Atlas of United States Congressional Districts. New York: Macmillan Publishing Company.
- Congressional Biographical Directory of the United States 1774–present
| U.S. House of Representatives | ||
|---|---|---|
| Preceded by Maine's 1st congressional district |
Home district of the Speaker of the House December 4, 1899 – March 4, 1903 |
Succeeded by Illinois's 18th congressional district |
This article is issued from Wikipedia. The text is licensed under Creative Commons - Attribution - Sharealike. Additional terms may apply for the media files.