2020 United States presidential election in Iowa
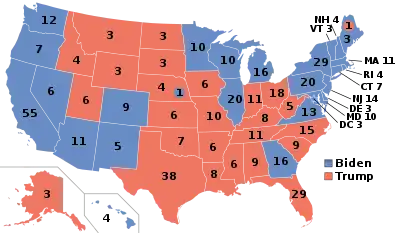
The 2020 United States presidential election in Iowa was held on Tuesday, November 3, 2020, as part of the 2020 United States elections in which all 50 states plus the District of Columbia participated.[1] Iowa voters chose electors to represent them in the Electoral College via a popular vote, pitting the Republican Party's nominee, incumbent President Donald Trump, and running mate Vice President Mike Pence against Democratic Party nominee, former Vice President Joe Biden, and his running mate California Senator Kamala Harris. Iowa has six electoral votes in the Electoral College.[2]
| ||||||||||||||||||||||||||
| Turnout | 75.77% | |||||||||||||||||||||||||
|---|---|---|---|---|---|---|---|---|---|---|---|---|---|---|---|---|---|---|---|---|---|---|---|---|---|---|
| ||||||||||||||||||||||||||
 County results
| ||||||||||||||||||||||||||
| ||||||||||||||||||||||||||
.jpg.webp)
| Elections in Iowa |
|---|
 |
|
|
Trump won the state 53.1% to 44.9%. Prior to this election, most news organizations had considered Iowa as either leaning towards Trump or a tossup. As was the case in Ohio, this election has confirmed Iowa's trend toward the GOP. Iowa had voted Democratic in six of seven elections prior to 2016, with the exception being George W. Bush's narrow plurality win in 2004. In 2016, however, Iowa voted for Trump by an unexpectedly large margin of 9.4%, voting over ten points to the right of the nation overall, indicating a possible realignment of the previously Democratic-leaning state towards the GOP, much as in the case of West Virginia in 2000 and 2004. Even though Biden contested the state,[3] Trump ended up carrying it by an only slightly reduced margin of 8.15% even as his national margin of defeat grew by 2.3%, confirming this trend.
Biden became the first Democratic nominee since Jimmy Carter in 1976 to win the presidency without carrying Iowa, as well as the first since FDR in 1940 to win the presidency without carrying Dubuque County. Biden improved on Hillary Clinton’s margins in the Des Moines and Cedar Rapids metropolitan areas and traditionally conservative western Iowa, the latter which borders Nebraska's 2nd congressional district, an electoral vote Trump won in 2016 but lost in 2020. Trump improved on his 2016 performance in populist northeast and south Iowa.
Per exit polling by the Associated Press, Trump's strength in Iowa came from white voters with no college degree, who comprised 62% of the electorate and supported Trump by 58%–40%. Trump swept all religious groups, garnering 66% of white Protestants, 54% of white Catholics, and 76% of white born-again/Evangelical Christians. 53% of voters believed Trump was better able to handle international trade.[4] Trump continued to win the cultural message among Iowa's white voters without a college degree.[5]
During the primary season, there remained hope among Democrats that Iowa would still be a contestable state.[6] However, Trump's well-held victory in the state in the general election also saw Republican congressional candidates -- from Senator Joni Ernst to at least two of the four House seats, including two held by Democrats (one vacated by Dave Loebsack in Iowa's 2nd district) -- winning their election.
Neither Biden nor Trump flipped any counties in the state, although Joe Biden came within 2% of flipping Dallas County, an educated suburb of Des Moines.
Iowa is one of three states that voted twice for Barack Obama and Trump, the other two being Ohio and Florida.
Caucuses
The state's caucuses, traditionally the first major electoral event in the country, were held on February 3, 2020.[7]
Republican caucuses
Incumbent president Donald Trump received about 97 percent of the votes in the Republican caucuses, and received 39 of the GOP delegates, while Bill Weld received enough votes to clinch 1 delegate.[8]

- Trump—100%
- Trump—≥95%
- Trump—90–95%
- Trump—85–90%

- Trump—≥95%
| Candidate | Votes | % | Estimated delegates |
|---|---|---|---|
| Donald Trump | 31,465 | 97.1 | 39 |
| William Weld | 426 | 1.3 | 1 |
| Joe Walsh | 348 | 1.1 | 0 |
| Other | 151 | 0.5 | 0 |
| Total | 32,389 | 100% | 40 |
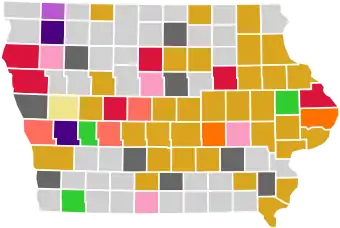
Democratic caucuses
After a three-day delay in votes being reported, the Iowa Democratic Party declared that Pete Buttigieg had narrowly won the state delegate equivalent (SDE) count of the Democratic caucuses with 26.2 percent. Bernie Sanders came in second with 26.1 percent of the SDEs, despite the fact that he received more popular votes (26.5 percent) than Buttigieg (25.1 percent). Elizabeth Warren, Joe Biden, and Amy Klobuchar finished in third, fourth, and fifth place, respectively.[11]
| Candidate | Initial alignment |
Final alignment[lower-alpha 1] |
State delegate equivalents |
Pledged national convention delegates[15][lower-alpha 2] | |||
|---|---|---|---|---|---|---|---|
| Votes | % | Votes | % | Number | % | ||
| Joe Biden | 26,291 | 14.9 | 23,605 | 13.7 | 340.3238 | 15.8 | [lower-alpha 3]14 |
| Pete Buttigieg | 37,572 | 21.3 | 43,209 | 25.1 | 562.9538 | 26.17 | [lower-alpha 4]12 |
| Bernie Sanders | 43,581 | 24.7 | 45,652 | 26.5 | 562.0214 | 26.13 | [lower-alpha 5]9 |
| Elizabeth Warren | 32,589 | 18.5 | 34,909 | 20.3 | 388.4403 | 18.1 | [lower-alpha 6]5 |
| Amy Klobuchar | 22,454 | 12.7 | 21,100 | 12.2 | 263.8689 | 12.3 | [lower-alpha 7]1 |
| Andrew Yang | 8,914 | 5.1 | 1,758 | 1.0 | 21.8559 | 1.0 | |
| Tom Steyer | 3,061 | 1.7 | 413 | 0.2 | 6.6189 | 0.3 | |
| Michael Bloomberg (did not run yet) | 212 | 0.1 | 16 | 0.0 | 0.2096 | 0.0 | |
| Tulsi Gabbard | 341 | 0.2 | 16 | 0.0 | 0.1143 | 0.0 | |
| Michael Bennet | 164 | 0.1 | 4 | 0.0 | 0.0000 | 0.0 | |
| Deval Patrick | 9 | 0.0 | 0 | 0.0 | 0.0000 | 0.0 | |
| John Delaney (withdrawn) | 0 | 0.0 | 0 | 0.0 | 0.0000 | 0.0 | |
| Other / Write-in | 155 | 0.1 | 198 | 0.1 | 0.6931 | 0.0 | |
| Uncommitted | 1,009 | 0.6 | 1,420 | 0.8 | 3.7321 | 0.2 | |
| Totals[lower-alpha 8] | 176,352 | 100% | 172,300 | 100% | 2,150.8321 | 100% | 41 |
Libertarian caucuses
The Libertarian Party of Iowa conducted their own caucuses on February 8, offering in-person caucus locations and an online virtual caucus. Only registered Libertarian voters were eligible to participate.[17][18]
| Iowa Libertarian presidential caucus, February 8, 2020[19] | ||
|---|---|---|
| Candidate | Votes | Percentage |
| Jacob Hornberger | 133 | 47.52% |
| Lincoln Chafee | 36 | 12.77% |
| Jo Jorgensen | 18 | 6.38% |
| Adam Kokesh | 17 | 6.03% |
| Dan Behrman | 14 | 4.96% |
| John McAfee | 10 | 3.55% |
| Vermin Supreme | 9 | 3.19% |
| Other (write-in) | 8 | 2.84% |
| None of the above | 8 | 2.84% |
| Sam Robb | 7 | 2.48% |
| Max Abramson | 6 | 2.13% |
| Mark Whitney | 4 | 1.42% |
| Arvin Vohra | 3 | 1.06% |
| Ken Armstrong | 2 | 0.71% |
| Souraya Faas | 2 | 0.71% |
| Benjamin Leder | 1 | 0.35% |
| John Monds | 1 | 0.35% |
| Total | 281 | 100% |
General election
Predictions
| Source | Ranking | As of |
|---|---|---|
| The Cook Political Report[20] | Tossup | October 6, 2020 |
| Inside Elections[21] | Tossup | October 6, 2020 |
| Sabato's Crystal Ball[22] | Lean R | November 2, 2020 |
| Politico[23] | Tossup | October 12, 2020 |
| RCP[24] | Tossup | October 6, 2020 |
| Niskanen[25] | Tossup | October 6, 2020 |
| CNN[26] | Tossup | October 7, 2020 |
| The Economist[27] | Tossup | October 6, 2020 |
| CBS News[28] | Tossup | October 6, 2020 |
| 270towin[29] | Tossup | October 6, 2020 |
| ABC News[30] | Tossup | October 6, 2020 |
| NPR[31] | Tossup | October 9, 2020 |
| NBC News[32] | Tossup | October 6, 2020 |
| 538[33] | Lean R | November 2, 2020 |
Polling
Graphical summary
Aggregate polls
| Source of poll aggregation |
Dates administered |
Dates updated |
Joe Biden Democratic |
Donald Trump Republican |
Other/ Undecided [lower-alpha 9] |
Margin |
|---|---|---|---|---|---|---|
| 270 to Win | October 26 – Nov 2, 2020 | November 2, 2020 | 46.2% | 47.8% | 6.0% | Trump +1.6 |
| Real Clear Politics | October 21–30, 2020 | November 2, 2020 | 45.8% | 47.2% | 7.0% | Trump +1.4 |
| FiveThirtyEight | until November 1, 2020 | November 2, 2020 | 46.1% | 47.5% | 6.4% | Trump +1.4 |
| Average | 46.0% | 47.5% | 6.5% | Trump +1.5 | ||
Polls
| Poll source | Date(s) administered |
Sample size[lower-alpha 10] |
Margin of error |
Donald Trump Republican |
Joe Biden Democratic |
Jo Jorgensen Libertarian |
Howie Hawkins Green |
Other | Undecided |
|---|---|---|---|---|---|---|---|---|---|
| Public Policy Polling | Nov 1–2, 2020 | 871 (V) | – | 48% | 49% | - | - | 2%[lower-alpha 11] | 1% |
| SurveyMonkey/Axios | Oct 20 – Nov 2, 2020 | 1,489 (LV) | ± 3.5% | 51%[lower-alpha 12] | 48% | - | - | – | – |
| Change Research | Oct 29 – Nov 1, 2020 | 1,084 (LV) | ± 3.2% | 47% | 47% | 3% | 0% | 2%[lower-alpha 13] | 1% |
| Civiqs/Daily Kos | Oct 29 – Nov 1, 2020 | 853 (LV) | ± 3.7% | 48% | 49% | - | - | 3%[lower-alpha 14] | 0% |
| Data for Progress | Oct 27 – Nov 1, 2020 | 951 (LV) | ± 3.2% | 49% | 47% | 3% | 1% | 1%[lower-alpha 15] | – |
| Emerson College | Oct 29–31, 2020 | 604 (LV) | ± 3.9% | 49%[lower-alpha 16] | 47% | - | - | 4% | 0% |
| InsiderAdvantage/Center for American Greatness[upper-alpha 1] | Oct 30, 2020 | 400 (LV) | ± 4.9% | 48% | 46% | 1% | - | – | 6% |
| Selzer & Co./Des Moines Register | Oct 26–29, 2020 | 814 (LV) | ± 3.4% | 48% | 41% | - | - | 8%[lower-alpha 17] | 2%[lower-alpha 18] |
| SurveyMonkey/Axios | Oct 1–28, 2020 | 3,005 (LV) | ± 2.5% | 50% | 49% | - | - | - | 2% |
| Quinnipiac University | Oct 23–27, 2020 | 1,225 (LV) | ± 2.8% | 47% | 46% | - | - | 1%[lower-alpha 19] | 6% |
| RABA Research/WHO13 News | Oct 21–24, 2020 | 693 (LV) | ± 4% | 46% | 50% | - | - | 2%[lower-alpha 20] | 1% |
| Emerson College | Oct 19–21, 2020 | 435 (LV) | ± 4.7% | 48%[lower-alpha 21] | 48% | - | - | 4%[lower-alpha 22] | 0% |
| RMG Research/PoliticalIQ | Oct 15–21, 2020 | 800 (LV) | ± 3.5% | 47%[lower-alpha 23] | 47% | - | - | 2%[lower-alpha 24] | 4% |
| 45%[lower-alpha 25] | 49% | - | - | 2%[lower-alpha 26] | 4% | ||||
| 49%[lower-alpha 27] | 48% | - | - | 2%[lower-alpha 28] | 4% | ||||
| Siena College/NYT Upshot | Oct 18–20, 2020 | 753 (LV) | ± 3.9% | 43% | 46% | 2% | 1% | 1%[lower-alpha 29] | 7%[lower-alpha 30] |
| Insider Advantage/Center for American Greatness[upper-alpha 1] | Oct 18–19, 2020 | 400 (LV) | ± 4.9% | 45% | 45% | 2% | - | – | 8% |
| Monmouth University | Oct 15–19, 2020 | 501 (RV) | ± 4.4% | 48% | 47% | 1% | 0%[lower-alpha 31] | 2%[lower-alpha 32] | 2% |
| 501 (LV)[lower-alpha 33] | 47% | 50% | - | - | – | – | |||
| 501 (LV)[lower-alpha 34] | 46% | 51% | - | - | – | – | |||
| David Binder Research/Focus on Rural America | Oct 10–13, 2020 | 200 (LV) | – | 50% | 44% | - | - | – | – |
| Data for Progress (D) | Oct 8–11, 2020 | 822 (LV) | ± 3.4% | 48% | 47% | 2% | 0% | – | 3% |
| YouGov/CBS | Oct 6–9, 2020 | 1,035 (LV) | ± 3.5% | 49% | 49% | - | - | 2%[lower-alpha 35] | 0% |
| Opinion Insight/American Action Forum[upper-alpha 2] | Oct 5–8, 2020 | 800 (LV) | ± 3.46% | 46%[lower-alpha 36] | 47% | - | - | 3%[lower-alpha 37] | 4%[lower-alpha 38] |
| Civiqs/Daily Kos | Oct 3–6, 2020 | 756 (LV) | ± 3.9% | 47% | 48% | - | - | 4%[lower-alpha 39] | 1% |
| Quinnipiac University | Oct 1–5, 2020 | 1,205 (LV) | ± 2.8% | 45% | 50% | - | - | 2%[lower-alpha 40] | 3% |
| SurveyMonkey/Axios | Sep 1–30, 2020 | 1,276 (LV) | – | 52% | 46% | - | - | – | 2% |
| Data for Progress (D) | Sep 23–28, 2020 | 743 (LV) | ± 3.6% | 47%[lower-alpha 23] | 44% | 1% | 1% | – | 6% |
| 50%[lower-alpha 41] | 45% | - | - | – | 5% | ||||
| Hart Research Associates/Human Rights Campaign[upper-alpha 3] | Sep 24–27, 2020 | 400 (LV) | ± 4.9% | 49% | 47% | - | - | – | – |
| RABA Research/WHO13 News | Sep 23–26, 2020 | 780 (LV) | ± 4% | 46% | 48% | - | - | 2%[lower-alpha 42] | 4% |
| Monmouth University | Sep 18–22, 2020 | 402 (RV) | ± 4.9% | 50% | 44% | 2% | 0% | 1%[lower-alpha 43] | 2% |
| 402 (LV) | 49%[lower-alpha 33] | 46% | 2% | – | 2%[lower-alpha 44] | 2% | |||
| 49%[lower-alpha 34] | 46% | 2% | – | 2%[lower-alpha 45] | 2% | ||||
| Siena College/NYT Upshot | Sep 16–22, 2020 | 501 (LV) | ± 4.99% | 42% | 45% | 2% | 0% | 1%[lower-alpha 46] | 10%[lower-alpha 47] |
| Selzer & Co./Des Moines Register | Sep 14–17, 2020 | 658 (LV) | ± 3.8% | 47% | 47% | - | - | 4%[lower-alpha 48] | 3% |
| Fabrizio Ward/Hart Research Associates/AARP | Aug 30 – Sep 5, 2020 | 800 (LV) | ± 3.5% | 47% | 45% | - | - | 1%[lower-alpha 49] | 6% |
| Opinion Insight/American Action Forum[upper-alpha 2] | Aug 30 – Sep 2, 2020 | 800 (LV) | ± 3.46% | 51%[lower-alpha 50] | 43% | 3% | 1% | – | 2% |
| SurveyMonkey/Axios | Aug 1–31, 2020 | 983 (LV) | – | 53% | 46% | - | - | – | 2% |
| Monmouth University | Jul 30 – Aug 3, 2020 | 401 (RV) | ± 4.9% | 48% | 45% | 3% | - | <1%[lower-alpha 51] | 3% |
| 401 (LV) | 48%[lower-alpha 52] | 46% | 2% | <1%[lower-alpha 53] | 3% | ||||
| 47%[lower-alpha 54] | 47% | 2% | 0%[lower-alpha 55] | 3% | |||||
| Data for Progress | Jul 24 – Aug 2, 2020 | 1,101 (LV) | – | 44%[lower-alpha 23] | 42% | 3% | 1% | – | 10% |
| 46%[lower-alpha 56] | 45% | - | - | – | 9% | ||||
| David Binder Research/Focus on Rural America | Jul 30–31, 2020 | 200 (LV) | – | 43% | 49% | - | - | – | – |
| SurveyMonkey/Axios | Jul 1–31, 2020 | 1,095 (LV) | – | 54% | 45% | - | - | – | 1% |
| RMG Research | Jul 27–30, 2020 | 500 (RV) | ± 4.5% | 41% | 40% | - | - | 7% | 13% |
| Public Policy Polling/AFSCME[upper-alpha 4] | Jul 23–24, 2020 | 1,118 (V) | – | 48% | 47% | - | - | – | 6% |
| Spry Strategies/American Principles Project[upper-alpha 5] | Jul 11–16, 2020 | 701 (LV) | ± 3.7% | 46% | 48% | - | - | – | 7% |
| SurveyMonkey/Axios | Jun 8–30, 2020 | 455 (LV) | – | 50% | 48% | - | - | – | 2% |
| Selzer/Des Moines Register | Jun 7–10, 2020 | 674 (LV) | ± 3.8% | 44% | 43% | - | - | 10%[lower-alpha 57] | 3% |
| Civiqs/Daily Kos | Jun 6–8, 2020 | 865 (RV) | ± 3.8% | 46% | 46% | - | - | 7%[lower-alpha 58] | 1% |
| Public Policy Polling/Emily's List[upper-alpha 6] | Jun 3–4, 2020 | 963 (V) | – | 48% | 47% | - | - | – | 5% |
| Public Policy Polling | Apr 30 – May 1, 2020 | 1,222 (V) | ± 2.8% | 48% | 46% | - | - | – | 6% |
| GBAO Strategies/PLUS Paid Family Leave | Apr 13–16, 2020 | 500 (LV) | – | 48% | 45% | - | - | 1% | 6% |
| Selzer/Des Moines Register | Mar 2–5, 2020 | 667 (LV) | ± 3.8% | 51% | 41% | - | - | – | – |
| The New York Times/Siena College | Jan 20–23, 2020 | 1,689 (RV) | ± 2.8% | 46% | 44% | - | - | 5%[lower-alpha 59] | 6% |
| Public Policy Polling | Dec 29–31, 2019 | 964 (V) | – | 49% | 46% | - | - | – | 5% |
| Emerson College | Dec 7–10, 2019 | 1,043 (RV) | ± 3% | 49% | 45% | - | - | – | 6% |
| NYT Upshot/Siena College | Oct 25–30, 2019 | 1,435 (RV) | ± 3.1% | 45% | 44% | - | - | 3% | 5% |
| Emerson College | Oct 13–16, 2019 | 888 (RV) | ± 3.2% | 51% | 49% | - | - | – | – |
| WPA Intelligence (R) | Apr 27–30, 2019 | 200 (LV) | ± 6.9% | 49% | 44% | - | - | – | 5% |
| Emerson College | Mar 21–24, 2019 | 707 (RV) | ± 3.6% | 47% | 53% | - | - | – | – |
| Emerson College | Jan 30 – Feb 2, 2019 | 831 (RV) | ± 3.4% | 49% | 51% | - | - | – | – |
Former candidates | |||||||||||||||||||||||||||||||||||||||||||||||||||||||||||||||||||||||||||||||||||||||||||||||||||||||||||||||||||||||||||||||||||||||||||||||||||||||||||||||||||||||||||||||||||||||||||||||||||||||||||||||||||||||||||||||||||||||||||||||||||||||||||||||||||||||||||||||||||||||||||||||
|---|---|---|---|---|---|---|---|---|---|---|---|---|---|---|---|---|---|---|---|---|---|---|---|---|---|---|---|---|---|---|---|---|---|---|---|---|---|---|---|---|---|---|---|---|---|---|---|---|---|---|---|---|---|---|---|---|---|---|---|---|---|---|---|---|---|---|---|---|---|---|---|---|---|---|---|---|---|---|---|---|---|---|---|---|---|---|---|---|---|---|---|---|---|---|---|---|---|---|---|---|---|---|---|---|---|---|---|---|---|---|---|---|---|---|---|---|---|---|---|---|---|---|---|---|---|---|---|---|---|---|---|---|---|---|---|---|---|---|---|---|---|---|---|---|---|---|---|---|---|---|---|---|---|---|---|---|---|---|---|---|---|---|---|---|---|---|---|---|---|---|---|---|---|---|---|---|---|---|---|---|---|---|---|---|---|---|---|---|---|---|---|---|---|---|---|---|---|---|---|---|---|---|---|---|---|---|---|---|---|---|---|---|---|---|---|---|---|---|---|---|---|---|---|---|---|---|---|---|---|---|---|---|---|---|---|---|---|---|---|---|---|---|---|---|---|---|---|---|---|---|---|---|---|---|---|---|---|---|---|---|---|---|---|---|---|---|---|---|---|---|---|---|---|---|---|---|---|---|---|---|---|---|---|---|---|---|---|
|
Donald Trump vs. Michael Bloomberg
Donald Trump vs. Cory Booker
Donald Trump vs. Pete Buttigieg
Donald Trump vs. Kirsten Gillibrand
Donald Trump vs. Kamala Harris
Donald Trump vs. Amy Klobuchar
Donald Trump vs. Beto O'Rourke
Donald Trump vs. Bernie Sanders
Donald Trump vs. Elizabeth Warren
|
Hypothetical polling | |||||||||||||||||||||||||||||||||||||||||||||||||||||||||||||||||||||||||||||||||||||||||
|---|---|---|---|---|---|---|---|---|---|---|---|---|---|---|---|---|---|---|---|---|---|---|---|---|---|---|---|---|---|---|---|---|---|---|---|---|---|---|---|---|---|---|---|---|---|---|---|---|---|---|---|---|---|---|---|---|---|---|---|---|---|---|---|---|---|---|---|---|---|---|---|---|---|---|---|---|---|---|---|---|---|---|---|---|---|---|---|---|---|
|
with Donald Trump and Sherrod Brown
with Donald Trump and Nancy Pelosi
with Donald Trump, Bernie Sanders, and Howard Schultz
with Donald Trump, Elizabeth Warren, and Howard Schultz
with Donald Trump and generic Democrat
|
Results
| Party | Candidate | Votes | % | ±% | |
|---|---|---|---|---|---|
| Republican | Donald Trump Mike Pence |
897,672 | 53.10% | +2.00% | |
| Democratic | Joe Biden Kamala Harris |
759,061 | 44.95% | +3.20% | |
| Libertarian | Jo Jorgensen Spike Cohen |
19,637 | 1.16% | -2.62% | |
| Independent | Kanye West Michelle Tidball |
3,210 | 0.19% | N/A | |
| Green | Howie Hawkins Angela Walker |
3,075 | 0.18% | -0.55% | |
| Constitution | Don Blankenship William Mohr |
1,707 | 0.10% | -0.24% | |
| Alliance | Rocky De La Fuente Darcy Richardson |
1,082 | 0.06% | N/A | |
| Genealogy Know Your Family History | Ricki Sue King Dayna Chandler |
546 | 0.03% | N/A | |
| Independent | Brock Pierce Karla Ballard |
544 | 0.03% | N/A | |
| Write-in | 4,337 | 0.38% | -1.09% | ||
| Total votes | 1,690,871 | 100.00% | |||
By congressional district
| District | Trump | Biden | Representative |
|---|---|---|---|
| 1st | 50.79% | 47.38% | Abby Finkenauer |
| Ashley Hinson | |||
| 2nd | 51.10% | 47.10% | Dave Loebsack |
| Mariannette Miller-Meeks | |||
| 3rd | 49.15% | 49.02% | Cindy Axne |
| 4th | 62.68% | 35.73% | Steve King |
| Randy Feenstra | |||
See also
Notes
- Final vote after votes for candidates below the 15% viability threshold in each precinct are reallocated to other viable candidates.
- In Iowa, the presidential caucuses only are the first determining step for the delegate distribution, the final step are the decisions on the district conventions and the much later state convention. According to the provisions set by the Iowa Democratic Party's "Delegate Selection Plan", statewide delegates preliminarily awarded to other candidates had to be reallocated at the state convention on June 13, as their pledged candidates had dropped out, while the already early decided district delegates remain fixed.
- Originally placed fourth with 6 delegates. 8 of the 12 statewide delegates initially awarded to Buttigieg (2), Sanders (3) and Warren (3), who had withdrawn in the meantime, had to be reallocated to Biden as the sole remaining viable contender and were added to his own 2 statewide delegates at the state convention on June 13.[15][16]
- Original winner with 14 delegates. Due to his withdrawal in March, 2 of the 5 statewide delegates mathematically won by Buttigieg were reallocated to Biden at the state convention on June 13.[15][16]
- Original runner-up with 12 delegates. Due to his withdrawal in April, 3 of the 4 statewide delegates mathematically won by Sanders were reallocated to Biden at the state convention on June 13.[15][16]
- Originally placed third with 8 delegates. Due to her withdrawal in March, all of the 3 statewide delegates mathematically won by Warren were reallocated to Biden at the state convention on June 13.[15][16]
- Falling short of 15% on state level and in three of four districts, Klobuchar only surpassed the treshold in one district and won 1 delegate there.
- Per the Iowa Democratic Party official report.[13]
- Calculated by taking the difference of 100% and all other candidates combined.
- Key:
A – all adults
RV – registered voters
LV – likely voters
V – unclear - "Someone else" with 2%
- Overlapping sample with the previous SurveyMonkey/Axios poll, but more information available regarding sample size
- "Don't recall" with 2%
- "Someone else" with 3%
- "Other candidate or write-in" with 1%
- With voters who lean towards a given candidate
- "Refused" with 5%; "Someone else" with 3%; would not vote with 0%
- Includes "Do not remember"
- "Someone else" with 1%
- "Someone else" with 2%
- With voters who lean towards a given candidate
- "Someone else" with 4%
- Standard VI response
- "Someone else" with 2%
- Results generated with high Democratic turnout model
- "Someone else" with 2%
- Results generated with high Republican turnout model
- "Someone else" with 2%
- "Someone else" with 1%; would not vote with 0%
- Includes "Refused"
- No voters
- "Another candidate" and "No one" with 1%
- With a likely voter turnout model featuring higher turnout than in the 2016 presidential election
- With a likely voter turnout model featuring lower turnout than in the 2016 presidential election
- "Other third party" with 2%
- With voters who lean towards a given candidate
- "One of the other candidates" with 2%; West (B) with 1%
- Includes "Refused"
- "Someone else" with 4%
- "Someone else" with 2%
- If the only candidates were Biden and Trump
- "Other candidate" with 2%
- "Another candidate" with 1%; "No one" with no voters
- "Hawkins/Other" with 2%
- "Hawkins/Other" with 2%
- "Someone else" with 1%; Would not vote with 0%
- Includes "Refused"
- "Someone else" with 4%
- Would not vote with 1%
- With voters who lean towards a given candidate
- "Other" and "No-one" with <1%
- With a likely voter turnout model featuring higher turnout than in the 2016 presidential election
- "Other" with <1%
- With a likely voter turnout model featuring lower turnout than in the 2016 presidential election
- "Other" with 0%
- If the only candidates were Biden and Trump
- "Someone else" with 9%; would not vote with 1%
- "Someone else" with 7%
- Other with 2%; would not vote with 3%
- Additional data sourced from FiveThirtyEight
- Other with 3%; would not vote with 4%
- Other with 1%; would not vote with 3%
- Other with 2%; would not vote with 3%
- Other with 2%; would not vote with 2%
- Other with 2%; would not vote with 3%
- Partisan clients
- The Center for American Greatness is a pro-Trump organization
- The American Action Forum is a 501 organisation which usually supports Republican candidates
- The Human Rights Campaign endorsed Biden prior to this poll's sampling period
- AFSCME endorsed Biden prior to this poll's sampling period
- This poll's sponsor is the American Principles Project, a 501(c)(4) organization that supports the Republican Party.
- Emily's List is an organisation that supports Democratic female candidates
- End Citizens United PAC has exclusively endorsed Democratic candidates
References
- Kelly, Ben (August 13, 2018). "US elections key dates: When are the 2018 midterms and the 2020 presidential campaign?". The Independent. Retrieved January 3, 2019.
- "Distribution of Electoral Votes". National Archives and Records Administration. Retrieved January 3, 2019.
- Pfannenstiel, Brianne. "Joe Biden, Mike Pence to campaign in Iowa this week, underscoring competitive presidential race". Des Moines Register. Retrieved January 18, 2021.
- "Iowa Voter Surveys: How Different Groups Voted". The New York Times. November 3, 2020. ISSN 0362-4331. Retrieved November 9, 2020.
- "Down on the farm with Trump". Bleeding Heartland. April 16, 2020. Retrieved November 9, 2020.
- Alberta, Tim. "Whoever Wins Iowa, They Won't Be Back". POLITICO. Retrieved January 4, 2021.
- Pfannenstiel, Brianne (August 25, 2018). "Countdown begins to 2020: Date of Iowa Democratic caucuses set for Feb. 3". The Des Moines Register. Retrieved January 3, 2019.
- "Live Results:Iowa Republican Caucuses". The New York Times. February 3, 2020. Retrieved February 3, 2020.
- "Iowa Republican Delegation 2020". The Green Papers. Retrieved February 12, 2020.
- "Live Results:Iowa Republican Caucuses". The New York Times. February 3, 2020. Retrieved February 3, 2020.
- "Iowa caucus results: Buttigieg, Sanders in a near tie, with 100% of results published". USA TODAY. February 6, 2020. Retrieved February 7, 2020.
- "Live: Iowa Caucus Results 2020". The New York Times. Retrieved February 27, 2020.
- "IDP Caucus 2020 (100% reporting: 1765 of 1765 precincts)". Iowa Democratic Party. Retrieved February 20, 2020.
- Levy, Adam; Merica, Dan (March 1, 2020). "Iowa Democratic Party certifies Buttigieg's Iowa lead amid Sanders challenge". CNN.com. Retrieved March 1, 2020.
- "2020 Presidential Primaries, Caucuses, and Conventions: Iowa Democrat". The Green Papers. Retrieved July 4, 2020.
- "Iowa Democratic Party Announces Delegation to National Convention". iowademocrats.org. June 13, 2020. Retrieved August 20, 2020.
- "Libertarian's announce caucus results". Knoxville Journal Express. February 10, 2020. Retrieved February 18, 2020.
- McDaniel, Tiffany (February 10, 2020). "Low voter turnout at the Iowa Libertarian Party Caucus". The Oskaloosa Herald. Retrieved February 18, 2020.
- Howe, Joseph (February 8, 2020). "Libertarian Party Of Iowa Presidential Caucus Winner And Results". Libertarian Party of Iowa. Retrieved February 8, 2020.
- "2020 POTUS Race ratings" (PDF). The Cook Political Report. Retrieved May 21, 2019.
- "POTUS Ratings | Inside Elections". insideelections.com. Retrieved May 21, 2019.
- "Larry J. Sabato's Crystal Ball » 2020 President". crystalball.centerforpolitics.org. Retrieved November 2, 2020.
- "2020 Election Forecast". Politico. November 19, 2019.
- "Battle for White House". RCP. April 19, 2019.
- 2020 Bitecofer Model Electoral College Predictions, Niskanen Center, March 24, 2020, retrieved: April 19, 2020.
- David Chalian; Terence Burlij. "Road to 270: CNN's debut Electoral College map for 2020". CNN. Retrieved June 16, 2020.
- "Forecasting the US elections". The Economist. Retrieved July 7, 2020.
- "2020 Election Battleground Tracker". CBS News. July 12, 2020. Retrieved July 13, 2020.
- "2020 Presidential Election Interactive Map". 270 to Win.
- "ABC News Race Ratings". CBS News. July 24, 2020. Retrieved July 24, 2020.
- "2020 Electoral Map Ratings: Trump Slides, Biden Advantage Expands Over 270 Votes". NPR.org. Retrieved August 3, 2020.
- "Biden dominates the electoral map, but here's how the race could tighten". NBC News. Retrieved August 6, 2020.
- "2020 Election Forecast". FiveThirtyEight. Retrieved August 14, 2020.
- "Election Canvass Summary" (PDF). Iowa Secretary of State. Retrieved November 30, 2020.
Further reading
- Summary: State Laws on Presidential Electors (PDF), Washington DC: National Association of Secretaries of State, August 2020,
Iowa
- David Wasserman (October 6, 2020), "The 10 Bellwether Counties That Show How Trump Is in Serious Trouble", Nytimes.com. (Describes bellwether Marshall County, Iowa)
External links
- "League of Women Voters of Iowa". (State affiliate of the U.S. League of Women Voters)
- Government Documents Round Table of the American Library Association, "Iowa", Voting & Elections Toolkits
- "Iowa: Election Tools, Deadlines, Dates, Rules, and Links", Vote.org, Oakland, CA