Kiblawan
Kiblawan, officially the Municipality of Kiblawan (Cebuano: Lungsod sa Kiblawan; Tagalog: Bayan ng Kiblawan), is a 2nd class municipality in the province of Davao del Sur, Philippines. According to the 2015 census, it has a population of 48,897 people. [3]
Kiblawan | |
|---|---|
| Municipality of Kiblawan | |
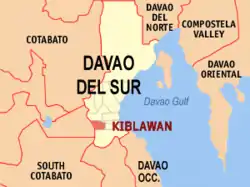 Map of Davao del Sur with Kiblawan highlighted | |
OpenStreetMap 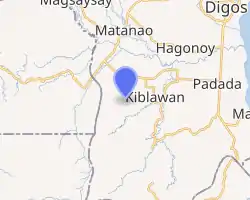
| |
.svg.png.webp) Kiblawan Location within the Philippines | |
| Coordinates: 6°37′N 125°13′E | |
| Country | |
| Region | Davao Region (Region XI) |
| Province | Davao del Sur |
| District | Lone District |
| Barangays | 30 (see Barangays) |
| Government | |
| • Type | Sangguniang Bayan |
| • Mayor | Carl Jason Rama |
| • Vice Mayor | Joel D. Calma |
| • Representative | Mercedes C. Cagas |
| • Electorate | 28,109 voters (2019) |
| Area | |
| • Total | 390.07 km2 (150.61 sq mi) |
| Elevation | 78 m (256 ft) |
| Population | |
| • Total | 48,897 |
| • Density | 130/km2 (320/sq mi) |
| • Households | 13,425 |
| Economy | |
| • Income class | 2nd municipal income class |
| • Poverty incidence | 29.21% (2015)[4] |
| • Revenue | ₱128,661,247.46 (2016) |
| Time zone | UTC+8 (PST) |
| ZIP code | 8008 |
| PSGC | |
| IDD : area code | +63 (0)82 |
| Climate type | tropical rainforest climate |
| Native languages | Davawenyo Cebuano Kalagan Tagalog Ata Manobo |
| Website | www |
Barangays
Kiblawan is politically subdivided into 30 barangays.
- Abnate
- Bagong Negros
- Bagong Silang
- Bagumbayan
- Balasiao
- Bonifacio
- Bunot
- Cogon-Bacaca
- Dapok
- Ihan
- Kibongbong
- Kimlawis
- Kisulan
- Lati-an
- Manual
- Maraga-a
- Molopolo
- New Sibonga
- Panaglib
- Pasig
- Poblacion
- Pocaleel
- San Isidro
- San Jose
- San Pedro
- Santo Niño
- Tacub
- Tacul
- Waterfall
- Bulol-Salo
Demographics
| Year | Pop. | ±% p.a. |
|---|---|---|
| 1970 | 24,549 | — |
| 1975 | 25,316 | +0.62% |
| 1980 | 25,894 | +0.45% |
| 1990 | 31,753 | +2.06% |
| 1995 | 36,375 | +2.58% |
| 2000 | 41,275 | +2.75% |
| 2007 | 43,054 | +0.58% |
| 2010 | 44,618 | +1.31% |
| 2015 | 48,897 | +1.76% |
| Source: Philippine Statistics Authority [3] [5] [6][7] | ||
Climate
| Climate data for Kiblawan, Davao del Sur | |||||||||||||
|---|---|---|---|---|---|---|---|---|---|---|---|---|---|
| Month | Jan | Feb | Mar | Apr | May | Jun | Jul | Aug | Sep | Oct | Nov | Dec | Year |
| Average high °C (°F) | 30 (86) |
30 (86) |
31 (88) |
31 (88) |
30 (86) |
29 (84) |
29 (84) |
29 (84) |
30 (86) |
30 (86) |
30 (86) |
30 (86) |
30 (86) |
| Average low °C (°F) | 22 (72) |
22 (72) |
23 (73) |
23 (73) |
24 (75) |
23 (73) |
23 (73) |
23 (73) |
23 (73) |
23 (73) |
23 (73) |
23 (73) |
23 (73) |
| Average precipitation mm (inches) | 59 (2.3) |
46 (1.8) |
41 (1.6) |
54 (2.1) |
105 (4.1) |
159 (6.3) |
179 (7.0) |
197 (7.8) |
162 (6.4) |
147 (5.8) |
102 (4.0) |
65 (2.6) |
1,316 (51.8) |
| Average rainy days | 12.3 | 11.7 | 12.2 | 14.5 | 22.6 | 25.6 | 26.6 | 27.5 | 25.5 | 26.0 | 21.2 | 16.0 | 241.7 |
| Source: Meteoblue [8] | |||||||||||||
References
- Municipality of Kiblawan | (DILG)
- "Province: Davao del Sur". PSGC Interactive. Quezon City, Philippines: Philippine Statistics Authority. Retrieved 12 November 2016.
- Census of Population (2015). "Region XI (Davao Region)". Total Population by Province, City, Municipality and Barangay. PSA. Retrieved 20 June 2016.
- "PSA releases the 2015 Municipal and City Level Poverty Estimates". Quezon City, Philippines. Retrieved 12 October 2019.
- Census of Population and Housing (2010). "Region XI (Davao Region)". Total Population by Province, City, Municipality and Barangay. NSO. Retrieved 29 June 2016.
- Censuses of Population (1903–2007). "Region XI (Davao Region)". Table 1. Population Enumerated in Various Censuses by Province/Highly Urbanized City: 1903 to 2007. NSO.
- "Province of Davao del Sur". Municipality Population Data. Local Water Utilities Administration Research Division. Retrieved 17 December 2016.
- "Kiblawan: Average Temperatures and Rainfall". Meteoblue. Retrieved 28 January 2020.
External links
- Kiblawan Profile at PhilAtlas.com
- Philippine Standard Geographic Code
- Philippine Census Information
- Local Governance Performance Management System
Places adjacent to Kiblawan | |
|---|---|
Digos (capital) | |
| Municipalities | |
| Component City | |
| Highly urbanized city |
|
This article is issued from Wikipedia. The text is licensed under Creative Commons - Attribution - Sharealike. Additional terms may apply for the media files.