List of countries by economic complexity
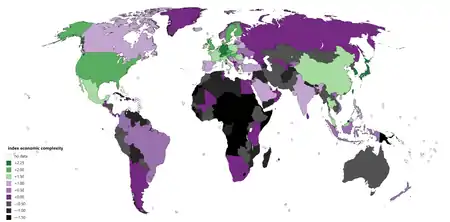
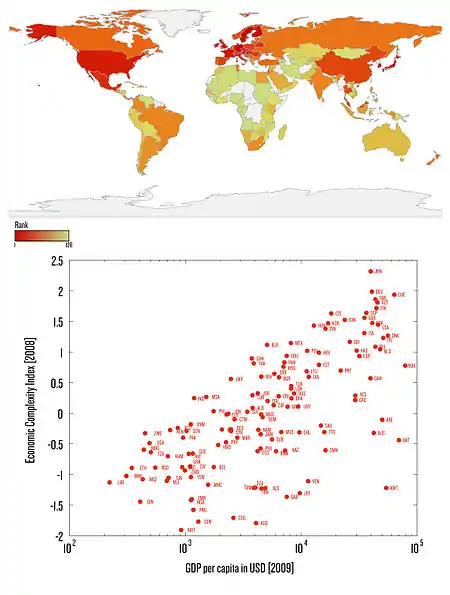
This list orders countries by their economic complexity index (ECI), as it was defined and calculated by Cesar A. Hidalgo and Ricardo Hausmann.
Country rankings
| Rank | Country | Economic complexity index (2018) | Change in 5 years (2013-18) |
Change in 10 years (2008-18) |
|---|---|---|---|---|
| 1 | 2.43 | |||
| 2 | 2.17 | |||
| 3 | 2.11 | |||
| 4 | 2.09 | |||
| 5 | 1.85 | |||
| 6 | 1.81 | |||
| 7 | 1.80 | |||
| 8 | 1.70 | |||
| 9 | 1.66 | |||
| 10 | 1.62 | |||
| 11 | 1.55 | |||
| 12 | 1.55 | |||
| 13 | 1.51 | |||
| 14 | 1.44 | |||
| 15 | 1.41 | |||
| 16 | 1.37 | |||
| 17 | 1.36 | |||
| 18 | 1.34 | |||
| 19 | 1.29 | |||
| 20 | 1.20 | |||
| 21 | 1.18 | |||
| 22 | 1.17 | |||
| 23 | 1.10 | |||
| 24 | 1.09 | |||
| 25 | 1.09 | |||
| 26 | 1.03 | |||
| 27 | 0.98 | |||
| 28 | 0.96 | |||
| 29 | 0.89 | |||
| 30 | 0.87 | |||
| 31 | 0.86 | |||
| 32 | 0.83 | |||
| 33 | 0.80 | |||
| 34 | 0.70 | |||
| 35 | 0.67 | |||
| 36 | 0.67 | |||
| 37 | 0.67 | |||
| 38 | 0.67 | |||
| 39 | 0.65 | |||
| 40 | 0.64 | |||
| 41 | 0.55 | |||
| 42 | 0.54 | |||
| 43 | 0.44 | |||
| 44 | 0.37 | |||
| 45 | 0.35 | |||
| 46 | 0.34 | |||
| 47 | 0.33 | |||
| 48 | 0.30 | |||
| 49 | 0.21 | |||
| 50 | 0.18 | |||
| 51 | 0.17 | |||
| 52 | 0.14 | |||
| 53 | 0.13 | |||
| 54 | 0.13 | |||
| 55 | 0.11 | |||
| 56 | 0.10 | |||
| 57 | 0.07 | |||
| 58 | 0.05 | |||
| 59 | 0.04 | |||
| 60 | 0.02 | |||
| 61 | 0.02 | |||
| 62 | -0.01 | |||
| 63 | -0.02 | |||
| 64 | -0.04 | |||
| 65 | -0.04 | |||
| 66 | -0.06 | |||
| 67 | -0.08 | |||
| 68 | -0.09 | |||
| 69 | -0.17 | |||
| 70 | -0.18 | |||
| 71 | -0.18 | |||
| 72 | -0.18 | |||
| 73 | -0.21 | |||
| 74 | -0.24 | |||
| 75 | -0.31 | |||
| 76 | -0.32 | |||
| 77 | -0.34 | |||
| 78 | -0.36 | |||
| 79 | -0.39 | |||
| 80 | -0.41 | |||
| 81 | -0.43 | |||
| 82 | -0.45 | |||
| 83 | -0.48 | |||
| 84 | -0.48 | |||
| 85 | -0.49 | |||
| 86 | -0.50 | |||
| 87 | -0.53 | |||
| 88 | -0.55 | |||
| 89 | -0.55 | |||
| 90 | -0.56 | |||
| 91 | -0.56 | |||
| 92 | -0.58 | |||
| 93 | -0.59 | |||
| 94 | -0.62 | |||
| 95 | -0.63 | |||
| 96 | -0.63 | |||
| 97 | -0.66 | |||
| 98 | -0.67 | |||
| 99 | -0.68 | |||
| 100 | -0.70 | |||
| 101 | -0.71 | |||
| 102 | -0.78 | |||
| 103 | -0.80 | |||
| 104 | -0.81 | |||
| 105 | -0.84 | |||
| 106 | -0.84 | |||
| 107 | -0.88 | |||
| 108 | -0.88 | |||
| 109 | -0.93 | |||
| 110 | -0.96 | |||
| 111 | -0.97 | |||
| 112 | -0.97 | |||
| 113 | -1.01 | |||
| 114 | -1.03 | |||
| 115 | -1.04 | |||
| 116 | -1.09 | |||
| 117 | -1.11 | |||
| 118 | -1.12 | |||
| 119 | -1.14 | |||
| 120 | -1.15 | |||
| 121 | -1.25 | |||
| 122 | -1.31 | |||
| 123 | -1.31 | |||
| 124 | -1.37 | |||
| 125 | -1.42 | |||
| 126 | -1.43 | |||
| 127 | -1.43 | |||
| 128 | -1.46 | |||
| 129 | -1.60 | |||
| 130 | -1.68 | |||
| 131 | -1.71 | |||
| 132 | -1.80 | |||
| 133 | -1.90 |
Factors affecting differences between countries
As an illustration, we can observe the differences between Egypt and Thailand in ECI ranking between the years of 1995 and 2015, let us use the below figures as an example:
| Rank | Country | ECI Value | Year |
|---|---|---|---|
| 45 | Thailand | 0.30 | 1995 |
| 75 | Egypt | -0.41 | 1995 |
| 24 | Thailand | 1.06 | 2015 |
| 68 | Egypt | -0.23 | 2015 |
- Difference in 1995: 0.71 ECI points for Thailand
- Difference in 2015: 1.28824 ECI points for Thailand
- Increase for Egypt 1995-2015: 0.18037 ECI Points
- Increase for Thailand 1995-2015: 0.7575 ECI Points
When we dig deeper into the export data of both countries, we can deduce that the differences were mainly in the composition of their relative export baskets. The more countries direct their efforts to more sophisticated products, the more it is reflected in the ECI score, and hence their potential economic growth.
For example, from 1995-2015, Thailand appears to have phased away from largely ubiquitous products “fur: 0.1 on the Product Complexity Index ("PCI"), Leather: 0.9 PCI, footwear: -0.7 PCI”, and focused their exports into products that few other countries can make “Cars: 2.47 PCI, parts and accessories of motor vehicles: 3.18 PCI, motor vehicles for transporting good: 1.87 PCI”.
Egypt, on the other hand, also experienced an increase in complexity, albeit much less than the one experienced by Thailand. They had a relatively high growth as a share of their total export portfolio in monitors and projectors: 0.9 PCI, but they also had a growth in insulated wires which has a PCI of -0.48.
So, in general, we can observe that Thailand has expanded in products with higher PCI than the ones they phased out from, while Egypt expanded in some higher PCI products, and also some lower ones hence the difference in ECI growth between the two.
For reference data, please go to http://atlas.cid.harvard.edu.
References
- "Complexity rankingsThe Atlas of Economic Complexity". Harvard' Growth Lab Viz Hub. Retrieved 2020-10-31.