Mathematical visualization
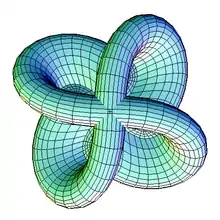
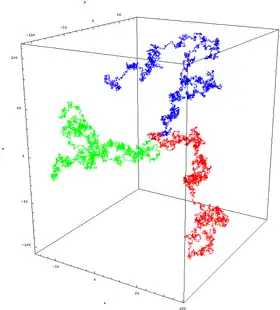
Mathematical phenomena can be understood and explored via visualization. Classically this consisted of two-dimensional drawings or building three-dimensional models (particularly plaster models in the 19th and early 20th century), while today it most frequently consists of using computers to make static two or three dimensional drawings, animations, or interactive programs. Writing programs to visualize mathematics is an aspect of computational geometry.
Applications
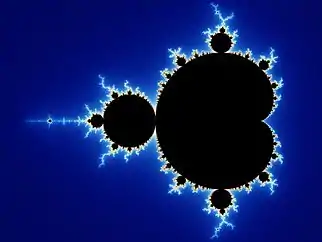
Mathematical visualization is used throughout mathematics, particularly in the fields of geometry and analysis. Notable examples include plane curves, space curves, polyhedra, ordinary differential equations, partial differential equations (particularly numerical solutions, as in fluid dynamics or minimal surfaces such as soap films), conformal maps, fractals, and chaos.
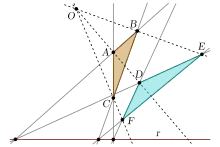
Geometry
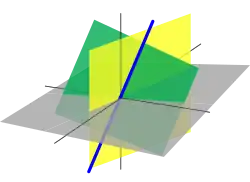
Linear algebra
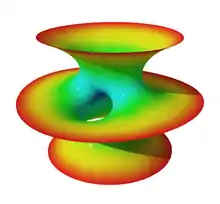
Complex analysis
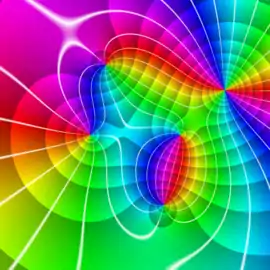
In complex analysis, functions of the complex plane are inherently 4-dimensional, but there is no natural geometric projection into lower dimensional visual representations. Instead, colour vision is exploited to capture dimensional information using techniques such as domain coloring.
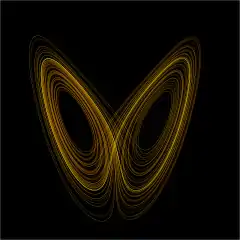
Chaos theory
Differential geometry
Topology

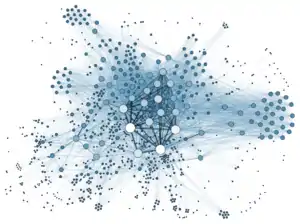
Graph theory
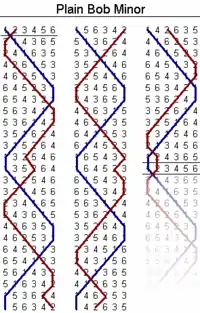
Combinatorics
Cellular automata
Stephen Wolfram's book on cellular automata, A New Kind of Science (2002), is one of the most intensely visual books published in the field of mathematics. It has been criticized for being too heavily visual, with much information conveyed by pictures that do not have formal meaning.[3]
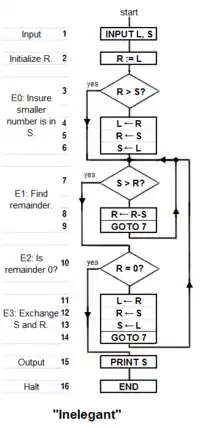
Computation
Other examples
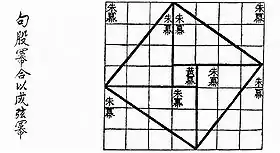
- Proofs without words have existed since antiquity, as in the Pythagorean theorem proof found in the Zhoubi Suanjing Chinese text which dates from 1046 BC to 256 BC.
- The Clebsch diagonal surface demonstrates the 27 lines on a cubic surface.
- Sphere eversion – that a sphere can be turned inside out in 3 dimension if allowed to pass through itself, but without kinks – was a startling and counter-intuitive result, originally proven via abstract means, later demonstrated graphically, first in drawings, later in computer animation.
The cover of the journal The Notices of the American Mathematical Society regularly features a mathematical visualization.
See also
References
- Published in Grandjean, Martin (2014). "La connaissance est un réseau". Les Cahiers du Numérique. 10 (3): 37–54. doi:10.3166/lcn.10.3.37-54. Retrieved 2014-10-15.
- Daniel Dennett (1995), Darwin's Dangerous Idea, Penguin Books, London, ISBN 978-0-14-016734-4, ISBN 0-14-016734-X
- Berry, Michael; Ellis, John; Deutch, David (15 May 2002). "A Revolution or self indulgent hype? How top scientists view Wolfram" (PDF). The Daily Telegraph. Retrieved 14 August 2012.
- Palais, Richard S. (June–July 1999), "The Visualization of Mathematics: Towards a Mathematical Exploratorium" (PDF), Notices of the American Mathematical Society, 46 (6): 647–658
External links
| Open-source |  | ||||
|---|---|---|---|---|---|
| GNU | |||||
| Freeware | |||||
| Retail |
| ||||
| Scenery generator | |||||
| Found objects | |||||
| Related | |||||
| |||||

