Norrtälje Municipality
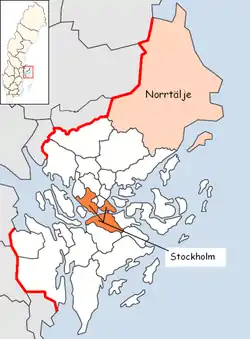
Norrtälje Municipality (Norrtälje kommun) is a municipality in Stockholm County in east central Sweden. Its seat is located in the city of Norrtälje.
Norrtälje Municipality
Norrtälje kommun | |
|---|---|
 Coat of arms | |
 | |
| Country | Sweden |
| County | Stockholm County |
| Seat | Norrtälje |
| Area | |
| • Total | 5,869.67 km2 (2,266.29 sq mi) |
| • Land | 2,016.04 km2 (778.40 sq mi) |
| • Water | 3,853.63 km2 (1,487.89 sq mi) |
| Area as of 1 January 2014. | |
| Population (31 December 2019)[2] | |
| • Total | 62,622 |
| • Density | 11/km2 (28/sq mi) |
| Time zone | UTC+1 (CET) |
| • Summer (DST) | UTC+2 (CEST) |
| ISO 3166 code | SE |
| Province | Uppland |
| Municipal code | 0188 |
| Website | www.norrtalje.se |
| Density is calculated using land area only. | |
It is the largest and northernmost municipality of Stockholm County and was created in 1971 through the amalgamation of several former municipalities. There are 25 original local government units (as of 1863) combined in the present municipality.
Many of the houses in Norrtälje municipality are summer cottages, only inhabited during summertime. This is due to its geographical location by the Stockholm archipelago, which makes it popular among Stockholmers and tourists.
Localities
| Locality | 2016 | 2010 | 2006 | 2000 | 1990 | 1980 |
|---|---|---|---|---|---|---|
| Norrtälje | 19365 | 17275 | 16,504 | 16,234 | 14,472 | 13,034 |
| Rimbo | 4882 | 4629 | 4,878 | 4,544 | 4,228 | 3,598 |
| Hallstavik | 4536 | 4476 | 4,465 | 4,651 | 4,762 | 4,535 |
| Älmsta | 1376 | 1097 | 911 | 914 | 867 | 760 |
| Hästängen | 690 | - | - | - | - | - |
| Edsbro | 574 | 488 | 507 | 440 | 435 | 394 |
| Bergshamra | 572 | 749 | 712 | 611 | 549 | 470 |
| Gräddö | 556 | - | - | - | - | - |
| Svanberga | 524 | 501 | 474 | 447 | 429 | 390 |
| Rånäs | 428 | 428 | 572 | 593 | 497 | 389 |
| Grisslehamn | 418 | 249 | 262 | 275 | 300 | 316 |
| Spillersboda | 408 | - | 317 | 380 | 278 | 140 |
| Herräng | 377 | 422 | 430 | 457 | 412 | 449 |
| Södersvik | 352 | 281 | 241 | 195 | 200 | 205 |
| Sättra | 336 | - | - | - | - | - |
| Riala | 329 | 215 | 225 | 171 | 148 | |
| Skebobruk | 276 | 282 | 263 | 261 | 262 | 198 |
| Söderbykarl | 268 | 231 | 185 | 179 | 198 | 217 |
| Blidö | 266 | - | - | - | - | - |
| Nysättra | 255 | - | 197 | 124 | 115 | 126 |
| Finsta | 239 | 244 | 176 | 139 | 132 | 89 |
| Rö | - | - | 269 | 309 | 270 | 223 |
| Gräddö | - | - | 259 | 245 | 180 | 144 |
| Drottningdal | - | - | 142 | 101 | 94 | 96 |
| Furusund | - | - | 125 | 114 | 103 | 102 |
| Köpmanholm | - | - | 102 | 105 | 103 | 91 |
| Total | 37,027 | 31,822 | 32,216 | 31,489 | 29,034 | 25,966 |
Elections
Riksdag
This table lists the national results since the 1972 Swedish municipality reform. The results of the Sweden Democrats from 1988 to 1998 were not published by the SCB at a municipal level due to the party's small size nationally at the time.
| Year | Turnout | Votes | V | S | MP | C | L | KD | M | SD | ND |
|---|---|---|---|---|---|---|---|---|---|---|---|
| 1973[4] | 89.8 | 24,160 | 3.9 | 41.5 | 0.0 | 30.8 | 7.7 | 2.1 | 13.8 | 0.0 | 0.0 |
| 1976[5] | 90.9 | 25,568 | 3.5 | 40.3 | 0.0 | 31.0 | 8.8 | 1.3 | 14.9 | 0.0 | 0.0 |
| 1979[6] | 89.6 | 26,072 | 4.5 | 40.5 | 0.0 | 26.4 | 7.9 | 1.4 | 19.1 | 0.0 | 0.0 |
| 1982[7] | 90.5 | 27,177 | 4.6 | 42.3 | 1.6 | 22.5 | 4.6 | 1.5 | 22.9 | 0.0 | 0.0 |
| 1985[8] | 89.0 | 27,982 | 4.4 | 42.6 | 1.1 | 17.0 | 13.3 | 0.0 | 21.4 | 0.0 | 0.0 |
| 1988[9] | 85.0 | 27,530 | 5.1 | 41.6 | 5.2 | 16.6 | 11.1 | 1.9 | 18.3 | 0.0 | 0.0 |
| 1991[10] | 86.0 | 29,455 | 3.5 | 34.5 | 3.1 | 13.2 | 8.3 | 5.4 | 23.3 | 0.0 | 7.8 |
| 1994[11] | 85.8 | 30,841 | 5.6 | 43.2 | 5.5 | 11.3 | 5.7 | 3.1 | 23.6 | 0.0 | 1.4 |
| 1998[12] | 79.9 | 29,828 | 9.7 | 34.7 | 4.5 | 7.8 | 3.8 | 11.4 | 25.4 | 0.0 | 0.0 |
| 2002[13] | 78.6 | 31,287 | 6.2 | 39.3 | 4.5 | 8.6 | 13.1 | 8.2 | 17.3 | 0.5 | 0.0 |
| 2006[14] | 80.8 | 33,114 | 4.9 | 31.5 | 4.8 | 9.5 | 6.7 | 6.3 | 32.1 | 2.1 | 0.0 |
| 2010[15] | 83.2 | 36,152 | 4.5 | 26.5 | 7.2 | 8.0 | 6.6 | 4.9 | 36.1 | 5.1 | 0.0 |
| 2014[16] | 85.4 | 38,444 | 4.5 | 29.9 | 6.3 | 7.4 | 4.6 | 3.6 | 27.9 | 12.4 | 0.0 |
Blocs
This lists the relative strength of the socialist and centre-right blocs since 1973, but parties not elected to the Riksdag are inserted as "other", including the Sweden Democrats results from 1988 to 2006, but also the Christian Democrats pre-1991 and the Greens in 1982, 1985 and 1991. The sources are identical to the table above. The coalition or government mandate marked in bold formed the government after the election. New Democracy got elected in 1991 but are still listed as "other" due to the short lifespan of the party. "Elected" is the total number of percentage points from the municipality that went to parties who were elected to the Riksdag.
| Year | Turnout | Votes | Left | Right | SD | Others | Elected |
|---|---|---|---|---|---|---|---|
| 1973 | 89.8 | 24,160 | 45.4 | 52.3 | 0.0 | 2.3 | 97.7 |
| 1976 | 90.9 | 25,568 | 44.0 | 54.7 | 0.0 | 1.3 | 98.7 |
| 1979 | 89.6 | 26,072 | 45.0 | 53.4 | 0.0 | 1.6 | 98.4 |
| 1982 | 90.5 | 27,177 | 46.9 | 50.0 | 0.0 | 3.1 | 96.9 |
| 1985 | 89.0 | 27,982 | 47.0 | 51.7 | 0.0 | 1.3 | 98.7 |
| 1988 | 85.0 | 27,530 | 51.9 | 46.0 | 0.0 | 2.1 | 97.9 |
| 1991 | 86.0 | 29,455 | 38.0 | 50.2 | 0.0 | 11.8 | 96.0 |
| 1994 | 85.8 | 30,841 | 54.3 | 43.7 | 0.0 | 2.0 | 98.0 |
| 1998 | 79.9 | 29,828 | 48.9 | 48.4 | 0.0 | 2.7 | 97.3 |
| 2002 | 78.6 | 31,287 | 50.0 | 47.2 | 0.0 | 2.8 | 97.2 |
| 2006 | 80.8 | 33,114 | 41.2 | 54.6 | 0.0 | 4.0 | 96.0 |
| 2010 | 83.2 | 36,152 | 38.2 | 55.6 | 5.1 | 1.1 | 98.9 |
| 2014 | 85.4 | 38,444 | 40.7 | 43.5 | 12.4 | 3.4 | 96.6 |
Transport

Norrtälje is located approximately 75 km northeast of central Stockholm. The European route E18 connects Norrtälje to other parts of Stockholm. Some of the major bus lines to Norrtälje include 620 and 621 from Åkersberga, 639 from Stockholm and Östhammar, 647 from the Stockholm-Arlanda Airport, and 676 from Stockholm.
Demography
Population development
| Year | Population | ||||||||
|---|---|---|---|---|---|---|---|---|---|
| 1970 | 38,238 | ||||||||
| 1975 | 39,193 | ||||||||
| 1980 | 40,842 | ||||||||
| 1985 | 42,204 | ||||||||
| 1990 | 46,165 | ||||||||
| 1995 | 50,295 | ||||||||
| 2000 | 52,611 | ||||||||
| 2005 | 54,596 | ||||||||
| 2010 | 56,080 | ||||||||
| 2015 | 58,669 | ||||||||
| 2017 | 60,808 | ||||||||
|
Source: SCB - Folkmängd efter region och år. | |||||||||
Residents with a foreign background
On the 31st of December 2017 the number of people with a foreign background (persons born outside of Sweden or with two parents born outside of Sweden) was 9 341, or 15.36% of the population (60 808 on the 31st of December 2017). On the 31st of December 2002 the number of residents with a foreign background was (per the same definition) 5 606, or 10.44% of the population (53 702 on the 31st of December 2002).[17] On 31 December 2017 there were 60 808 residents in Norrtälje, of which 7 559 people (12.43%) were born in a country other than Sweden. Divided by country in the table below - the Nordic countries as well as the 12 most common countries of birth outside of Sweden for Swedish residents have been included, with other countries of birth bundled together by continent by Statistics Sweden.[18]
| Country of birth[18] | ||
|---|---|---|
| 1 | 53,249 | |
| 2 | 1,877 | |
| 3 | 972 | |
| 4 | Asia: Other countries | 572 |
| 5 | 348 | |
| 6 | South America | 344 |
| 7 | 341 | |
| 8 | Africa: Other countries | 314 |
| 9 | 312 | |
| 10 | 310 | |
| 11 | 278 | |
| 12 | 276 | |
| 13 | 210 | |
| 14 | North America | 203 |
| 15 | 166 | |
| 16 | 163 | |
| 17 | 156 | |
| 18 | 156 | |
| 19 | SFR Yugoslavia/ | 130 |
| 20 | 128 | |
| 21 | 120 | |
| 22 | 101 | |
| 23 | Oceania | 36 |
| 24 | 21 | |
| 25 | 20 | |
| 26 | Unknown country of birth | 5 |
International relations
See also
External links
- Norrtälje Municipality - Official site
References
- "Statistiska centralbyrån, Kommunarealer den 1 januari 2014" (in Swedish). Statistics Sweden. 2014-01-01. Archived from the original (Microsoft Excel) on 2016-09-27. Retrieved 2014-04-18.
- "Folkmängd i riket, län och kommuner 31 december 2019" (in Swedish). Statistics Sweden. February 20, 2020. Retrieved February 20, 2020.
- Barrstam, Elisabet (2007-03-06). "Antal invånare i kommunens orter 1980–2006 (The number of inhabitants in the municipality's localities 1980–2006)" (in Swedish). Norrtälje kommun. Retrieved 2007-12-16.
- "Riksdagsvalet 1973 (page 161)" (PDF) (in Swedish). SCB. Retrieved 24 July 2017.
- "Riksdagsvalet 1976 (page 156)" (PDF) (in Swedish). SCB. Retrieved 24 July 2017.
- "Riksdagsvalet 1979 (page 180)" (PDF) (in Swedish). SCB. Retrieved 24 July 2017.
- "Riksdagsvalet 1982 (page 181)" (PDF) (in Swedish). SCB. Retrieved 24 July 2017.
- "Riksdagsvalet 1985 (page 182)" (PDF) (in Swedish). SCB. Retrieved 24 July 2017.
- "Riksdagsvalet 1988 (page 163)" (PDF) (in Swedish). SCB. Retrieved 24 July 2017.
- "Riksdagsvalet 1991 (page 22)" (PDF) (in Swedish). SCB. Retrieved 24 July 2017.
- "Riksdagsvalet 1994 (page 36)" (PDF) (in Swedish). SCB. Retrieved 24 July 2017.
- "Riksdagsvalet 1998 (page 33)" (PDF) (in Swedish). SCB. Retrieved 24 July 2017.
- "Valresultat Riksdag Norrtälje kommun 2002" (in Swedish). Valmyndigheten. Retrieved 24 July 2017.
- "Valresultat Riksdag Norrtälje kommun 2006" (in Swedish). Valmyndigheten. Retrieved 24 July 2017.
- "Valresultat Riksdag Norrtälje kommun 2010" (in Swedish). Valmyndigheten. Retrieved 24 July 2017.
- "Valresultat Riksdag Norrtälje kommun 2014" (in Swedish). Valmyndigheten. Retrieved 24 July 2017.
- Antal personer efter region, utländsk/svensk bakgrund och år (Read 4 januari 2019)
- Statistiska centralbyrån: Utrikes födda efter län, kommun och födelseland 31 december 2017 (XLS-fil) Läst 4 januari 2019
- "Archived copy". Archived from the original on 2008-05-25. Retrieved 2010-01-13.CS1 maint: archived copy as title (link)