2002 Swedish general election
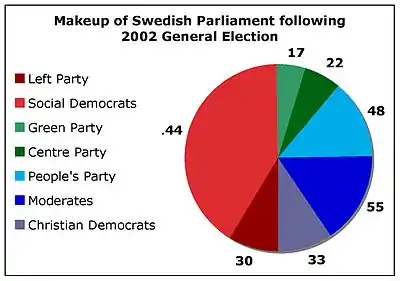
General elections were held in Sweden on 15 September 2002,[1] alongside municipal and county council elections. The Swedish Social Democratic Party remained the largest party in the Riksdag, winning 144 of the 349 seats.[2]
| |||||||||||||||||||||||||||||||||||||||||||||||||||||||||||||||||||||||||||||||||||||||||||||||||||||||||||||||||||||||
All 349 seats to the Riksdag 175 seats were needed for a majority | |||||||||||||||||||||||||||||||||||||||||||||||||||||||||||||||||||||||||||||||||||||||||||||||||||||||||||||||||||||||
|---|---|---|---|---|---|---|---|---|---|---|---|---|---|---|---|---|---|---|---|---|---|---|---|---|---|---|---|---|---|---|---|---|---|---|---|---|---|---|---|---|---|---|---|---|---|---|---|---|---|---|---|---|---|---|---|---|---|---|---|---|---|---|---|---|---|---|---|---|---|---|---|---|---|---|---|---|---|---|---|---|---|---|---|---|---|---|---|---|---|---|---|---|---|---|---|---|---|---|---|---|---|---|---|---|---|---|---|---|---|---|---|---|---|---|---|---|---|---|---|
| |||||||||||||||||||||||||||||||||||||||||||||||||||||||||||||||||||||||||||||||||||||||||||||||||||||||||||||||||||||||
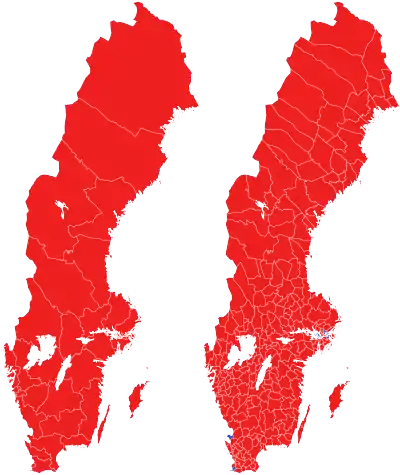 Largest party by district (left) and municipality (right) Red-Social Democratic, Blue-Moderate | |||||||||||||||||||||||||||||||||||||||||||||||||||||||||||||||||||||||||||||||||||||||||||||||||||||||||||||||||||||||
| |||||||||||||||||||||||||||||||||||||||||||||||||||||||||||||||||||||||||||||||||||||||||||||||||||||||||||||||||||||||
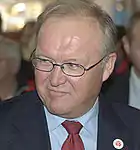


After securing a confidence and supply agreement with the Left Party and the Green Party, Prime Minister Göran Persson was able to remain in his position in a third consecutive term as a minority government.
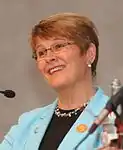
Although the bloc compositions were similar to 1998, the complexions of the centre-right bloc shifted radically. Under new party leader Bo Lundgren, the Moderates lost more than seven percentage points and barely held on as the largest party in its coalition. The Peoples' Party led by Lars Leijonborg, instead more than doubled its parliamentary delegation and received above 13 % of the vote. Lundgren resigned in the wake of the election, leading to the selection of future Prime Minister Fredrik Reinfeldt as the Moderate leader.
Among the four other Riksdag parties, the Christian Democrats and the Left Party both lost ground, whereas the Centre and Green parties managed to reach the parliamentary threshold of four percentage points.
Among minor parties, the Norrbotten Party reached 9.4 % of the vote in its county, polling above 20 % in some inland areas, although this was not enough to gain a Riksdag seat.[3] The Sweden Democrats became the eight largest party for the first time, making sizeable gains and winning more council seats than ever before.
Results
There were 5,303,212 valid ballots cast.[3]

| Final results of the 2002 Swedish general election |
Votes | Seats | ||||
|---|---|---|---|---|---|---|
| # | % | +/- | # | +/- | ||
| Social Democrats (s) | 2,113,560 | 39.85 | +3.46 | 144 | +13 | |
| Moderate Party (m) | 809,041 | 15.26 | −7.64 | 55 | −27 | |
| Liberal People's Party (fp) | 710,312 | 13.39 | +8.67 | 48 | +31 | |
| Christian Democrats (kd) | 485,235 | 9.15 | −2.62 | 33 | −9 | |
| Left Party (v) | 444,854 | 8.39 | −3.60 | 30 | −13 | |
| Centre Party (c) | 328,428 | 6.19 | +1.06 | 22 | +4 | |
| Green Party (mp) | 246,392 | 4.65 | +0.16 | 17 | +1 | |
| Sweden Democrats (sd) | 76,300 | 1.44 | +1.07 | 0 | – | |
| Swedish Senior Citizen Interest Party (spi) | 37,573 | 0.71 | +0.29 | 0 | – | |
| Norrbotten Party | 14,854 | 0.28 | +0.28 | 0 | – | |
| New Future | 9,337 | 0.18 | +0.01 | 0 | – | |
| National Democrats (nd) | 9,248 | 0.17 | +0.17 | 0 | – | |
| Skåne Party | 4,564 | 0.09 | +0.09 | 0 | – | |
| Socialist Party | 3,213 | 0.06 | +0.03 | 0 | – | |
| New Democracy¹ (nyd) | 2,207 | 0.04 | −0.11 | 0 | – | |
| Socialist Justice Party (rs) | 1,519 | 0.03 | −0.03 | 0 | – | |
| Communist Party of Sweden (skp) | 1,182 | 0.02 | −0.01 | 0 | – | |
| Unity | 603 | 0.01 | -0.02 | 0 | – | |
| Free List | 502 | 0.01 | +0.01 | 0 | – | |
| Voice of the Free People | 207 | 0.00 | – | 0 | – | |
| European Workers Party | 163 | 0.00 | ±0 | 0 | – | |
| Welfare Party | 94 | 0.00 | – | 0 | – | |
| National Democratic Party of Sweden | 87 | 0.00 | – | 0 | – | |
| Alliance Party | 58 | 0.00 | ±0 | 0 | – | |
| Skåne Federalists | 52 | 0.00 | – | 0 | – | |
| Communist League | 46 | 0.00 | ±0 | 0 | – | |
| Citizens Party | 27 | 0.00 | ±0 | 0 | – | |
| Rikshushållarna | 17 | 0.00 | – | 0 | – | |
| Republicans | 15 | 0.00 | ±0 | 0 | – | |
| Tax Reformists | 14 | 0.00 | – | 0 | – | |
| Popular Democrats | 12 | 0.00 | ±0 | 0 | – | |
| Populist Party | 11 | 0.00 | – | 0 | – | |
| New Swedes D.P.N.S. | 11 | 0.00 | – | 0 | – | |
| Donald Duck Party | 10 | 0.00 | – | 0 | – | |
| Parties with less than 10 votes | 61 | 0.00 | ||||
| Others not classified | 3,403 | 0.06 | ||||
| Valid votes | 5,303,212 | 98.47 | ||||
| Invalid votes | 82,218 | 1.53 | ||||
| Turnout | 5,385,430 | 80.11 | −1.28 | |||
¹ New Democracy was actually dissolved by the time of the election and did not run, but some voters wrote the party name on an empty ballot anyway.
By municipality
 Votes by municipality. The municipalities are the color of the party that got the most votes within the coalition that won relative majority.
 Cartogram of the map to the left with each municipality rescaled to the number of valid votes cast.
 Map showing the voting shifts from the 1998 to the 2002 election. Darker blue indicates a municipality voted more towards the parties that formed the centre-right bloc. Darker red indicates a municipality voted more towards the parties that form the left-wing bloc.
 Votes by municipality as a scale from red/Left-wing bloc to blue/Centre-right bloc.
 Cartogram of vote with each municipality rescaled in proportion to number of valid votes cast. Deeper blue represents a relative majority for the centre-right coalition, brighter red represents a relative majority for the left-wing coalition.
References
- Nohlen, D & Stöver, P (2010) Elections in Europe: A data handbook, p1858 ISBN 978-3-8329-5609-7
- Nohlen & Stöver, p1873
- "Sverige - Valområde - 2002-09-27 09:16:45" (in Swedish). Valmyndigheten. 27 September 2002. Retrieved 19 November 2019.
Further reading
- Madeley, John T. S. (April 2003). "'The Swedish model is dead! Long live the Swedish model!' The 2002 Riksdag election". West European Politics. 26 (2): 165–173. doi:10.1080/01402380512331341161.
| General elections | |
|---|---|
| Local elections | |
| European elections | |
| Referendums | |