Pornic
Pornic (Pornizh in Breton, Port-Nitz in Gallo) is a commune in the Loire-Atlantique department in western France.
Pornic | |
|---|---|
Commune | |
.JPG.webp) Castle of Pornic and the port | |
.svg.png.webp) Coat of arms | |
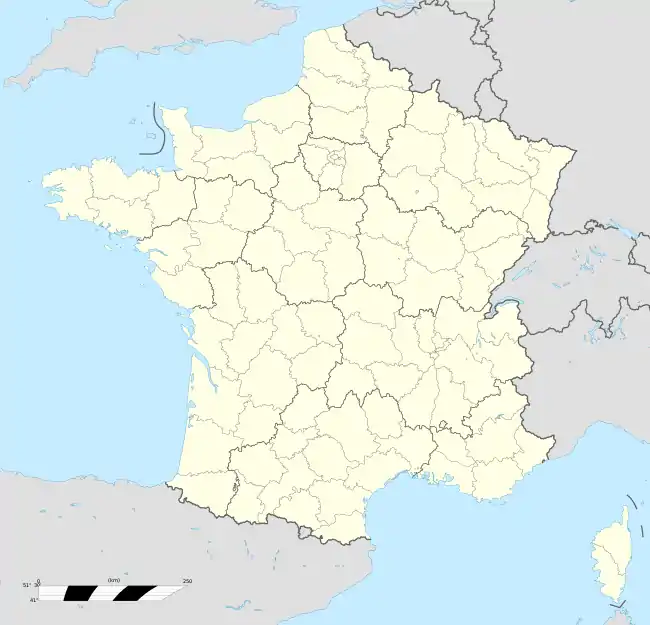
Location of Pornic 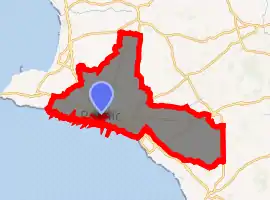
| |
 Pornic 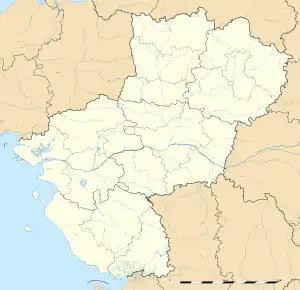 Pornic | |
| Coordinates: 47°07′00″N 2°06′00″W | |
| Country | France |
| Region | Pays de la Loire |
| Department | Loire-Atlantique |
| Arrondissement | Saint-Nazaire |
| Canton | Pornic |
| Intercommunality | Pornic |
| Boroughs | Sainte-Marie-sur-Mer, Clion-sur-Mer |
| Government | |
| • Mayor (2020–2026) | Jean-Michel Brard |
| Area 1 | 94.2 km2 (36.4 sq mi) |
| Population (2017-01-01)[1] | 15,018 |
| • Density | 160/km2 (410/sq mi) |
| Demonym(s) | Pornicais (French) |
| Time zone | UTC+01:00 (CET) |
| • Summer (DST) | UTC+02:00 (CEST) |
| INSEE/Postal code | 44131 /44210 |
| Elevation | 0–31 m (0–102 ft) |
| 1 French Land Register data, which excludes lakes, ponds, glaciers > 1 km2 (0.386 sq mi or 247 acres) and river estuaries. | |
In 1973 the commune of Pornic absorbed the neighbouring municipalities of Sainte-Marie-sur-Mer and Clion-sur-Mer.
Population
|
|
Sights
- Château de Pornic; medieval castle
Breton language
The municipality launched a linguistic plan through Ya d'ar brezhoneg on 1 March 2006.
Transport
The local train station is served by trains to Nantes.
Twin towns
The village is twinned with Scalby, North Yorkshire.
Climate
Pornic has a Csb type climate (Mediterranean with mild summers). The highest temperature recorded in Pornic is 38.1 °C on 4 August 2003, while the lowest temperature was -11.2 °C on 2 February 1986. Pornic's average temperature between 1971 and 2000 is approximately 12.8 °C.
References
- "Populations légales 2017". INSEE. Retrieved 6 January 2020.
| Wikimedia Commons has media related to Pornic. |
|
This article is issued from Wikipedia. The text is licensed under Creative Commons - Attribution - Sharealike. Additional terms may apply for the media files.