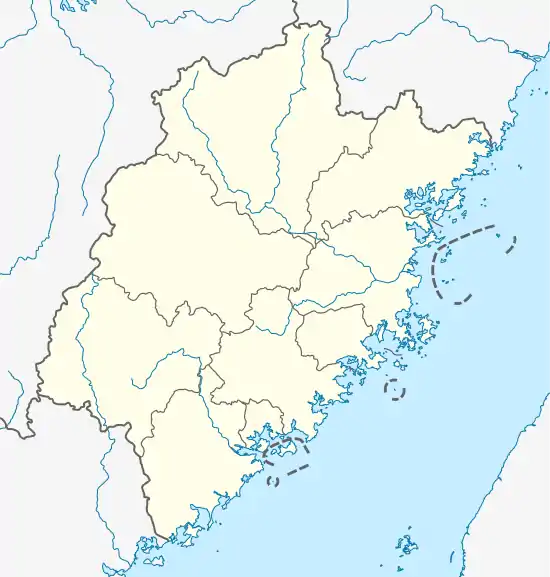
Qingliu County
Qingliu (simplified Chinese: 清流县; traditional Chinese: 清流縣; pinyin: Qīngliú Xiàn) is a county of western Fujian province, People's Republic of China. It is under the administration of Sanming City.
Qingliu County
清流县 Tsingliu; Chingliu | |
|---|---|
 Qingliu Location of the seat in Fujian | |
| Coordinates: 26°10′41″N 116°49′01″E | |
| Country | People's Republic of China |
| Province | Fujian |
| Prefecture-level city | Sanming |
| Time zone | UTC+8 (China Standard) |
Administration
The county executive, legislature, and judiciary are in Longjin (龙津) Town, along with the CPC and PSB branches.
Other Towns (镇, zhen)
- Songxi (嵩溪)
- Songkou (嵩口)
- Changjiao (长校)
- Lingdi (灵地)
Township (乡, xiang)
- Donghua (东华)
- Linshe (林畲)
- Wenjiao (温郊)
- Sheming (佘明)
- Tianyuan (田源)
- Litian (里田)
- Shawu (沙芜)
- Laifang (赖坊)
- Dengjia (邓家)
- Lijia (李家)
Climate
| Climate data for Qingliu (1981−2010) | |||||||||||||
|---|---|---|---|---|---|---|---|---|---|---|---|---|---|
| Month | Jan | Feb | Mar | Apr | May | Jun | Jul | Aug | Sep | Oct | Nov | Dec | Year |
| Record high °C (°F) | 28.0 (82.4) |
31.0 (87.8) |
31.9 (89.4) |
34.3 (93.7) |
35.5 (95.9) |
37.0 (98.6) |
38.8 (101.8) |
39.4 (102.9) |
37.3 (99.1) |
35.7 (96.3) |
32.3 (90.1) |
28.0 (82.4) |
39.4 (102.9) |
| Average high °C (°F) | 14.0 (57.2) |
15.5 (59.9) |
18.8 (65.8) |
24.2 (75.6) |
27.9 (82.2) |
30.5 (86.9) |
33.8 (92.8) |
33.2 (91.8) |
30.3 (86.5) |
26.4 (79.5) |
21.4 (70.5) |
16.5 (61.7) |
24.4 (75.9) |
| Daily mean °C (°F) | 7.8 (46.0) |
9.9 (49.8) |
13.3 (55.9) |
18.5 (65.3) |
22.2 (72.0) |
25.1 (77.2) |
27.2 (81.0) |
26.7 (80.1) |
24.1 (75.4) |
19.6 (67.3) |
14.2 (57.6) |
9.0 (48.2) |
18.1 (64.6) |
| Average low °C (°F) | 4.2 (39.6) |
6.4 (43.5) |
9.8 (49.6) |
14.8 (58.6) |
18.5 (65.3) |
21.5 (70.7) |
22.8 (73.0) |
22.8 (73.0) |
20.4 (68.7) |
15.5 (59.9) |
10.0 (50.0) |
4.6 (40.3) |
14.3 (57.7) |
| Record low °C (°F) | −6.9 (19.6) |
−4.2 (24.4) |
−4.2 (24.4) |
2.9 (37.2) |
9.0 (48.2) |
12.5 (54.5) |
18.6 (65.5) |
16.3 (61.3) |
10.9 (51.6) |
3.0 (37.4) |
−2.8 (27.0) |
−8.9 (16.0) |
−8.9 (16.0) |
| Average precipitation mm (inches) | 71.6 (2.82) |
130.3 (5.13) |
219.5 (8.64) |
224.7 (8.85) |
293.7 (11.56) |
303.7 (11.96) |
147.2 (5.80) |
160.5 (6.32) |
101.9 (4.01) |
65.4 (2.57) |
52.8 (2.08) |
48.1 (1.89) |
1,819.4 (71.63) |
| Average relative humidity (%) | 82 | 84 | 85 | 84 | 83 | 83 | 78 | 80 | 84 | 80 | 81 | 81 | 82 |
| Source: China Meteorological Data Service Center | |||||||||||||
This article is issued from Wikipedia. The text is licensed under Creative Commons - Attribution - Sharealike. Additional terms may apply for the media files.
