Results breakdown of the 1979 Spanish local elections (Castile and León)
This is the results breakdown of the local elections held in Castile and León on 3 April 1979. The following tables show detailed results in the autonomous community's most populous municipalities, sorted alphabetically.[1][2]
Overall
| Parties and coalitions | Popular vote | Councillors | ||||
|---|---|---|---|---|---|---|
| Votes | % | ±pp | Total | +/− | ||
| Union of the Democratic Centre (UCD) | 459,573 | 41.85 | n/a | 7,911 | n/a | |
| Spanish Socialist Workers' Party (PSOE) | 255,933 | 23.31 | n/a | 1,429 | n/a | |
| Democratic Coalition (CD) | 69,962 | 6.37 | n/a | 785 | n/a | |
| Communist Party of Spain (PCE) | 66,231 | 6.03 | n/a | 133 | n/a | |
| Party of Labour of Castile and León (PTCL) | 9,204 | 0.84 | n/a | 13 | n/a | |
| Spanish Ruralist Party (PRE) | 5,263 | 0.48 | n/a | 108 | n/a | |
| Communist Movement–Organization of Communist Left (MC–OIC) | 4,856 | 0.44 | n/a | 0 | n/a | |
| Workers' Revolutionary Organization (ORT) | 3,978 | 0.36 | n/a | 10 | n/a | |
| Nationalist Party of Castile and León (PANCAL) | 3,666 | 0.33 | n/a | 3 | n/a | |
| Democratic Candidacy (CDE) | 3,590 | 0.33 | n/a | 68 | n/a | |
| Liberal Party (PL) | 2,639 | 0.24 | n/a | 32 | n/a | |
| National Union (UN) | 2,503 | 0.23 | n/a | 12 | n/a | |
| New Force (FN) | 1,208 | 0.11 | n/a | 0 | n/a | |
| Spanish Phalanx of the CNSO (FE–JONS) | 1,049 | 0.10 | n/a | 4 | n/a | |
| Others | 192,370 | 17.50 | n/a | 3,454 | n/a | |
| Blank ballots | 286 | 0.03 | n/a | |||
| Total | 1,098,037 | 100.00 | 13,962 | n/a | ||
| Valid votes | 1,098,037 | 96.32 | n/a | |||
| Invalid votes | 42,009 | 3.68 | n/a | |||
| Votes cast / turnout | 1,140,046 | 60.93 | n/a | |||
| Abstentions | 730,957 | 39.07 | n/a | |||
| Registered voters | 1,871,003 | |||||
| Sources[1][3] | ||||||
City control
The following table lists party control in the most populous municipalities, including provincial capitals (shown in bold).[1]
| Municipality | Population | New control | |
|---|---|---|---|
| Ávila | 37,302 | Union of the Democratic Centre (UCD) | |
| Burgos | 145,473 | Union of the Democratic Centre (UCD) | |
| León | 120,761 | Spanish Socialist Workers' Party (PSOE) (UCD in 1979) | |
| Palencia | 65,896 | Union of the Democratic Centre (UCD) | |
| Ponferrada | 52,488 | Spanish Socialist Workers' Party (PSOE) | |
| Salamanca | 141,474 | Spanish Socialist Workers' Party (PSOE) | |
| Segovia | 48,623 | Union of the Democratic Centre (UCD) | |
| Soria | 28,845 | Union of the Democratic Centre (UCD) | |
| Valladolid | 308,523 | Spanish Socialist Workers' Party (PSOE) | |
| Zamora | 54,819 | Union of the Democratic Centre (UCD) | |
Municipalities
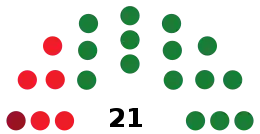
Ávila
- Population: 37,302
 | ||||||
| Parties and coalitions | Popular vote | Seats | ||||
|---|---|---|---|---|---|---|
| Votes | % | ±pp | Total | +/− | ||
| Union of the Democratic Centre (UCD) | 11,226 | 67.95 | n/a | 15 | n/a | |
| Spanish Socialist Workers' Party (PSOE) | 3,810 | 23.06 | n/a | 5 | n/a | |
| Communist Party of Spain (PCE) | 989 | 5.99 | n/a | 1 | n/a | |
| Communist Movement–Organization of Communist Left (MC–OIC) | 296 | 1.79 | n/a | 0 | n/a | |
| Blank ballots | 201 | 1.22 | n/a | |||
| Total | 16,522 | 21 | n/a | |||
| Valid votes | 16,522 | 98.54 | n/a | |||
| Invalid votes | 245 | 1.46 | n/a | |||
| Votes cast / turnout | 16,767 | 62.76 | n/a | |||
| Abstentions | 9,949 | 37.24 | n/a | |||
| Registered voters | 26,716 | |||||
| Sources[1][4] | ||||||
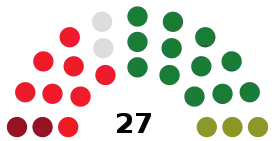
Burgos
- Population: 145,473
 | ||||||
| Parties and coalitions | Popular vote | Seats | ||||
|---|---|---|---|---|---|---|
| Votes | % | ±pp | Total | +/− | ||
| Union of the Democratic Centre (UCD) | 23,214 | 38.82 | n/a | 12 | n/a | |
| Spanish Socialist Workers' Party (PSOE) | 15,211 | 25.44 | n/a | 8 | n/a | |
| Democratic Coalition (CD) | 5,885 | 9.84 | n/a | 3 | n/a | |
| Communist Party of Spain (PCE) | 4,349 | 7.27 | n/a | 2 | n/a | |
| Independents (INDEP) | 4,243 | 7.10 | n/a | 2 | n/a | |
| Nationalist Party of Castile and León (PANCAL) | 2,200 | 3.68 | n/a | 0 | n/a | |
| Party of Labour of Castile and León (PTCL) | 2,083 | 3.48 | n/a | 0 | n/a | |
| National Union (UN) | 1,644 | 2.75 | n/a | 0 | n/a | |
| Communist Movement–Organization of Communist Left (MC–OIC) | 964 | 1.61 | n/a | 0 | n/a | |
| Blank ballots | 0 | 0.00 | n/a | |||
| Total | 59,793 | 27 | n/a | |||
| Valid votes | 59,793 | 92.32 | n/a | |||
| Invalid votes | 4,974 | 7.68 | n/a | |||
| Votes cast / turnout | 64,767 | 63.71 | n/a | |||
| Abstentions | 36,900 | 36.29 | n/a | |||
| Registered voters | 101,667 | |||||
| Sources[1][5] | ||||||
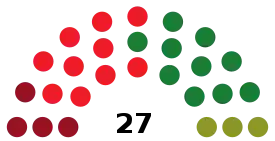
León
- Population: 120,761
 | ||||||
| Parties and coalitions | Popular vote | Seats | ||||
|---|---|---|---|---|---|---|
| Votes | % | ±pp | Total | +/− | ||
| Union of the Democratic Centre (UCD) | 17,696 | 34.57 | n/a | 10 | n/a | |
| Spanish Socialist Workers' Party (PSOE) | 16,991 | 33.20 | n/a | 10 | n/a | |
| Communist Party of Spain (PCE) | 7,023 | 13.72 | n/a | 4 | n/a | |
| Democratic Coalition (CD) | 6,775 | 13.24 | n/a | 3 | n/a | |
| Spanish Ruralist Party (PRE) | 2,090 | 4.08 | n/a | 0 | n/a | |
| Party of Labour of Spain (PTE) | 609 | 1.19 | n/a | 0 | n/a | |
| Blank ballots | 0 | 0.00 | n/a | |||
| Total | 51,184 | 27 | n/a | |||
| Valid votes | 51,184 | 98.10 | n/a | |||
| Invalid votes | 989 | 1.90 | n/a | |||
| Votes cast / turnout | 52,173 | 58.57 | n/a | |||
| Abstentions | 36,909 | 41.43 | n/a | |||
| Registered voters | 89,082 | |||||
| Sources[1][6] | ||||||
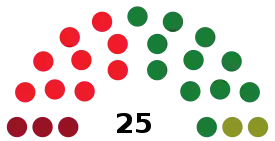
Palencia
- Population: 65,896
 | ||||||
| Parties and coalitions | Popular vote | Seats | ||||
|---|---|---|---|---|---|---|
| Votes | % | ±pp | Total | +/− | ||
| Union of the Democratic Centre (UCD) | 11,439 | 40.50 | n/a | 11 | n/a | |
| Spanish Socialist Workers' Party (PSOE) | 9,459 | 33.49 | n/a | 9 | n/a | |
| Communist Party of Spain (PCE) | 3,193 | 11.31 | n/a | 3 | n/a | |
| Democratic Coalition (CD) | 2,477 | 8.77 | n/a | 2 | n/a | |
| Spanish Phalanx (FE) | 982 | 3.48 | n/a | 0 | n/a | |
| Party of Labour of Castile and León (PTCL) | 572 | 2.03 | n/a | 0 | n/a | |
| Communist Movement–Organization of Communist Left (MC–OIC) | 120 | 0.42 | n/a | 0 | n/a | |
| Blank ballots | 0 | 0.00 | n/a | |||
| Total | 28,242 | 25 | n/a | |||
| Valid votes | 28,242 | 98.53 | n/a | |||
| Invalid votes | 422 | 1.47 | n/a | |||
| Votes cast / turnout | 28,664 | 60.87 | n/a | |||
| Abstentions | 18,426 | 39.13 | n/a | |||
| Registered voters | 47,090 | |||||
| Sources[1][7] | ||||||
Ponferrada
- Population: 52,488
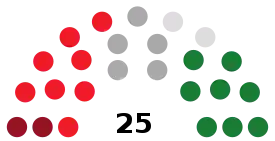 | ||||||
| Parties and coalitions | Popular vote | Seats | ||||
|---|---|---|---|---|---|---|
| Votes | % | ±pp | Total | +/− | ||
| Spanish Socialist Workers' Party (PSOE) | 5,914 | 29.16 | n/a | 8 | n/a | |
| Union of the Democratic Centre (UCD) | 5,530 | 27.27 | n/a | 8 | n/a | |
| Independent Neighbors Association (AVI) | 3,645 | 17.97 | n/a | 5 | n/a | |
| Communist Party of Spain (PCE) | 2,059 | 10.15 | n/a | 2 | n/a | |
| Bierzo Independents (IB) | 1,730 | 8.53 | n/a | 2 | n/a | |
| Democratic Coalition (CD) | 734 | 3.62 | n/a | 0 | n/a | |
| New Force (FN) | 569 | 2.81 | n/a | 0 | n/a | |
| Party of Labour of Spain (PTE) | 101 | 0.50 | n/a | 0 | n/a | |
| Blank ballots | 0 | 0.00 | n/a | |||
| Total | 20,282 | 25 | n/a | |||
| Valid votes | 20,282 | 99.02 | n/a | |||
| Invalid votes | 201 | 0.98 | n/a | |||
| Votes cast / turnout | 20,483 | 55.01 | n/a | |||
| Abstentions | 16,749 | 44.99 | n/a | |||
| Registered voters | 37,232 | |||||
| Sources[1][8] | ||||||
Salamanca
- Population: 141,474
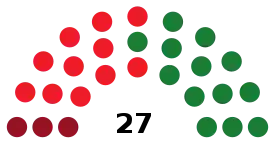 | ||||||
| Parties and coalitions | Popular vote | Seats | ||||
|---|---|---|---|---|---|---|
| Votes | % | ±pp | Total | +/− | ||
| Union of the Democratic Centre (UCD) | 28,158 | 43.96 | n/a | 13 | n/a | |
| Spanish Socialist Workers' Party (PSOE) | 23,122 | 36.10 | n/a | 11 | n/a | |
| Communist Party of Spain (PCE) | 7,439 | 11.61 | n/a | 3 | n/a | |
| Democratic Coalition (CD) | 2,892 | 4.52 | n/a | 0 | n/a | |
| Party of Labour of Spain (PTE) | 1,353 | 2.11 | n/a | 0 | n/a | |
| New Force (FN) | 639 | 1.00 | n/a | 0 | n/a | |
| Revolutionary Communist League (LCR) | 444 | 0.69 | n/a | 0 | n/a | |
| Blank ballots | 0 | 0.00 | n/a | |||
| Total | 64,047 | 27 | n/a | |||
| Valid votes | 64,047 | 98.59 | n/a | |||
| Invalid votes | 918 | 1.41 | n/a | |||
| Votes cast / turnout | 64,965 | 61.00 | n/a | |||
| Abstentions | 41,534 | 39.00 | n/a | |||
| Registered voters | 106,499 | |||||
| Sources[1][9] | ||||||
Segovia
- Population: 48,623
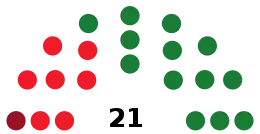 | ||||||
| Parties and coalitions | Popular vote | Seats | ||||
|---|---|---|---|---|---|---|
| Votes | % | ±pp | Total | +/− | ||
| Union of the Democratic Centre (UCD) | 12,176 | 57.46 | n/a | 13 | n/a | |
| Spanish Socialist Workers' Party (PSOE) | 6,956 | 32.83 | n/a | 7 | n/a | |
| Communist Party of Spain (PCE) | 1,560 | 7.36 | n/a | 1 | n/a | |
| Communist Movement–Organization of Communist Left (MC–OIC) | 499 | 2.35 | n/a | 0 | n/a | |
| Blank ballots | 0 | 0.00 | n/a | |||
| Total | 21,191 | 21 | n/a | |||
| Valid votes | 21,191 | 96.11 | n/a | |||
| Invalid votes | 858 | 3.89 | n/a | |||
| Votes cast / turnout | 22,049 | 65.06 | n/a | |||
| Abstentions | 11,842 | 34.94 | n/a | |||
| Registered voters | 33,891 | |||||
| Sources[1][10] | ||||||
Soria
- Population: 28,845
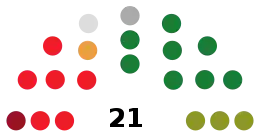 | ||||||
| Parties and coalitions | Popular vote | Seats | ||||
|---|---|---|---|---|---|---|
| Votes | % | ±pp | Total | +/− | ||
| Union of the Democratic Centre (UCD) | 4,200 | 34.67 | n/a | 8 | n/a | |
| Spanish Socialist Workers' Party (PSOE) | 3,196 | 26.38 | n/a | 6 | n/a | |
| Democratic Coalition (CD) | 1,799 | 14.85 | n/a | 3 | n/a | |
| Communist Party of Spain (PCE) | 745 | 6.15 | n/a | 1 | n/a | |
| Independent Electoral Group (AEI) | 727 | 6.00 | n/a | 1 | n/a | |
| Citizen Movement of Soria (MCS) | 700 | 5.78 | n/a | 1 | n/a | |
| Sorian Independent Group (GIS) | 629 | 5.19 | n/a | 1 | n/a | |
| Communist Movement (MC) | 117 | 0.97 | n/a | 0 | n/a | |
| Blank ballots | 0 | 0.00 | n/a | |||
| Total | 12,113 | 21 | n/a | |||
| Valid votes | 12,113 | 97.52 | n/a | |||
| Invalid votes | 308 | 2.48 | n/a | |||
| Votes cast / turnout | 12,421 | 57.24 | n/a | |||
| Abstentions | 9,278 | 42.76 | n/a | |||
| Registered voters | 21,699 | |||||
| Sources[1][11] | ||||||
Valladolid
- Population: 308,523
 | ||||||
| Parties and coalitions | Popular vote | Seats | ||||
|---|---|---|---|---|---|---|
| Votes | % | ±pp | Total | +/− | ||
| Spanish Socialist Workers' Party (PSOE) | 47,939 | 39.81 | n/a | 13 | n/a | |
| Union of the Democratic Centre (UCD) | 33,582 | 27.89 | n/a | 9 | n/a | |
| Communist Party of Spain (PCE) | 15,722 | 13.06 | n/a | 4 | n/a | |
| Independents (INDEP) | 9,174 | 7.62 | n/a | 2 | n/a | |
| Democratic Coalition (CD) | 6,221 | 5.17 | n/a | 1 | n/a | |
| Party of Labour of Spain (PTE) | 3,021 | 2.51 | n/a | 0 | n/a | |
| Communist Movement–Organization of Communist Left (MC–OIC) | 1,632 | 1.36 | n/a | 0 | n/a | |
| Nationalist Party of Castile and León (PANCAL) | 1,394 | 1.16 | n/a | 0 | n/a | |
| Left Municipal Union (PCT–LCR) | 693 | 0.58 | n/a | 0 | n/a | |
| Communist Organization of Spain (Red Flag) (OCE–BR) | 580 | 0.48 | n/a | 0 | n/a | |
| Republican Left (IR) | 457 | 0.38 | n/a | 0 | n/a | |
| Liberal Party (PL) | 0 | 0.00 | n/a | 0 | n/a | |
| Workers' Revolutionary Organization (ORT) | 0 | 0.00 | n/a | 0 | n/a | |
| Blank ballots | 0 | 0.00 | n/a | |||
| Total | 120,415 | 29 | n/a | |||
| Valid votes | 120,415 | 97.82 | n/a | |||
| Invalid votes | 2,683 | 2.18 | n/a | |||
| Votes cast / turnout | 123,098 | 57.72 | n/a | |||
| Abstentions | 90,154 | 42.28 | n/a | |||
| Registered voters | 213,252 | |||||
| Sources[1][12] | ||||||
Zamora
- Population: 54,819
 | ||||||
| Parties and coalitions | Popular vote | Seats | ||||
|---|---|---|---|---|---|---|
| Votes | % | ±pp | Total | +/− | ||
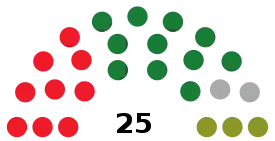
| Union of the Democratic Centre (UCD) | 7,560 | 37.64 | n/a | 11 | n/a | |
| Spanish Socialist Workers' Party (PSOE) | 6,582 | 32.77 | n/a | 9 | n/a | |
| Democratic Coalition (CD) | 2,577 | 12.83 | n/a | 3 | n/a | |
| Independent Zamorans Union (UZI) | 1,779 | 8.86 | n/a | 2 | n/a | |
| Liberal Party (PL) | 726 | 3.61 | n/a | 0 | n/a | |
| Communist Movement–Organization of Communist Left (MC–OIC) | 588 | 2.93 | n/a | 0 | n/a | |
| Workers' Revolutionary Organization (ORT) | 271 | 1.35 | n/a | 0 | n/a | |
| Blank ballots | 0 | 0.00 | n/a | |||
| Total | 20,083 | 25 | n/a | |||
| Valid votes | 20,083 | 96.29 | n/a | |||
| Invalid votes | 773 | 3.71 | n/a | |||
| Votes cast / turnout | 20,856 | 51.43 | n/a | |||
| Abstentions | 19,699 | 48.57 | n/a | |||
| Registered voters | 40,555 | |||||
| Sources[1][13] | ||||||
References
- "Elecciones Municipales en Castilla y León (1979 - 2019)". Historia Electoral.com (in Spanish). Retrieved 7 June 2019.
- "Elecciones Municipales. 3 de abril de 1979. Castilla y León". eldiario.es (in Spanish). Retrieved 7 June 2019.
- "Electoral Results Consultation. Municipal. April 1979. Castile and León". Ministry of the Interior (in Spanish). Retrieved 1 December 2020.
- "Electoral Results Consultation. Municipal. April 1979. Ávila Municipality". Ministry of the Interior (in Spanish). Retrieved 7 June 2019.
- "Electoral Results Consultation. Municipal. April 1979. Burgos Municipality". Ministry of the Interior (in Spanish). Retrieved 7 June 2019.
- "Electoral Results Consultation. Municipal. April 1979. León Municipality". Ministry of the Interior (in Spanish). Retrieved 7 June 2019.
- "Electoral Results Consultation. Municipal. April 1979. Palencia Municipality". Ministry of the Interior (in Spanish). Retrieved 7 June 2019.
- "Electoral Results Consultation. Municipal. April 1979. Ponferrada Municipality". Ministry of the Interior (in Spanish). Retrieved 19 June 2020.
- "Electoral Results Consultation. Municipal. April 1979. Salamanca Municipality". Ministry of the Interior (in Spanish). Retrieved 7 June 2019.
- "Electoral Results Consultation. Municipal. April 1979. Segovia Municipality". Ministry of the Interior (in Spanish). Retrieved 7 June 2019.
- "Electoral Results Consultation. Municipal. April 1979. Soria Municipality". Ministry of the Interior (in Spanish). Retrieved 7 June 2019.
- "Electoral Results Consultation. Municipal. April 1979. Valladolid Municipality". Ministry of the Interior (in Spanish). Retrieved 7 June 2019.
- "Electoral Results Consultation. Municipal. April 1979. Zamora Municipality". Ministry of the Interior (in Spanish). Retrieved 7 June 2019.
This article is issued from Wikipedia. The text is licensed under Creative Commons - Attribution - Sharealike. Additional terms may apply for the media files.