Results breakdown of the 1999 Spanish local elections (Castile and León)
This is the results breakdown of the local elections held in Castile and León on 13 June 1999. The following tables show detailed results in the autonomous community's most populous municipalities, sorted alphabetically.[1][2][3]
City control
The following table lists party control in the most populous municipalities, including provincial capitals (shown in bold).[1] Gains for a party are displayed with the cell's background shaded in that party's colour.
| Municipality | Population | Previous control | New control | ||
|---|---|---|---|---|---|
| Ávila | 47,650 | People's Party (PP) | People's Party (PP) | ||
| Burgos | 161,984 | People's Party (PP) | Spanish Socialist Workers' Party (PSOE) | ||
| León | 139,809 | People's Party (PP) | People's Party (PP) | ||
| Palencia | 79,745 | People's Party (PP) | Spanish Socialist Workers' Party (PSOE) | ||
| Ponferrada | 61,469 | People's Party (PP) | People's Party (PP) | ||
| Salamanca | 158,457 | People's Party (PP) | People's Party (PP) | ||
| Segovia | 54,012 | People's Party (PP) | Centrist Unity–Democratic and Social Centre (UC–CDS) | ||
| Soria | 33,882 | People's Party (PP) | Spanish Socialist Workers' Party (PSOE) | ||
| Valladolid | 319,946 | People's Party (PP) | People's Party (PP) | ||
| Zamora | 64,421 | People's Party (PP) | People's Party (PP) | ||
Municipalities
Ávila
- Population: 47,650
 | ||||||
| Parties and coalitions | Popular vote | Seats | ||||
|---|---|---|---|---|---|---|
| Votes | % | ±pp | Total | +/− | ||
| People's Party (PP) | 13,536 | 56.60 | –7.19 | 13 | –1 | |
| Spanish Socialist Workers' Party (PSOE) | 5,531 | 23.13 | +8.73 | 5 | +2 | |
| United Left of Castile and León (IUCyL) | 2,936 | 12.28 | –1.82 | 3 | ±0 | |
| Spanish Democratic Party (PADE) | 455 | 1.90 | New | 0 | ±0 | |
| The Phalanx (FE) | 297 | 1.24 | New | 0 | ±0 | |
| Independent Group of Ávila (AIAV) | n/a | n/a | –5.51 | 0 | –1 | |
| Blank ballots | 1,161 | 4.85 | +2.65 | |||
| Total | 23,916 | 21 | ±0 | |||
| Valid votes | 23,916 | 98.48 | –0.35 | |||
| Invalid votes | 368 | 1.52 | +0.35 | |||
| Votes cast / turnout | 24,284 | 62.24 | –6.55 | |||
| Abstentions | 14,730 | 37.76 | +6.55 | |||
| Registered voters | 39,014 | |||||
| Sources[1][4] | ||||||
Burgos
- Population: 161,984
 | ||||||
| Parties and coalitions | Popular vote | Seats | ||||
|---|---|---|---|---|---|---|
| Votes | % | ±pp | Total | +/− | ||
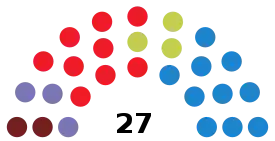
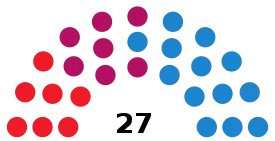
| People's Party (PP) | 30,207 | 34.90 | –16.29 | 10 | –6 | |
| Spanish Socialist Workers' Party (PSOE) | 26,259 | 30.34 | +12.94 | 9 | +4 | |
| Independent Burgalese Popular Action (APBI) | 9,676 | 11.18 | New | 3 | +3 | |
| Commoners' Land–Castilian Nationalist Party (TC–PNC) | 8,566 | 9.90 | +7.76 | 3 | +3 | |
| United Left of Castile and León (IUCyL) | 6,647 | 7.68 | –7.99 | 2 | –3 | |
| Spanish Democratic Party (PADE) | 1,669 | 1.93 | New | 0 | ±0 | |
| Humanist Party (PH) | 300 | 0.35 | New | 0 | ±0 | |
| Progress, Union and Freedom (PUL) | n/a | n/a | –6.13 | 0 | –1 | |
| Blank ballots | 3,223 | 3.72 | +1.18 | |||
| Total | 86,547 | 27 | ±0 | |||
| Valid votes | 86,547 | 99.12 | +0.03 | |||
| Invalid votes | 766 | 0.88 | –0.03 | |||
| Votes cast / turnout | 87,313 | 64.80 | –3.33 | |||
| Abstentions | 47,430 | 35.20 | +3.33 | |||
| Registered voters | 134,743 | |||||
| Sources[1][5] | ||||||
León
- Population: 139,809
 | ||||||
| Parties and coalitions | Popular vote | Seats | ||||
|---|---|---|---|---|---|---|
| Votes | % | ±pp | Total | +/− | ||
| People's Party (PP) | 31,191 | 44.61 | –1.16 | 13 | –1 | |
| Spanish Socialist Workers' Party (PSOE) | 17,248 | 24.67 | +2.72 | 7 | +1 | |
| Leonese People's Union (UPL) | 16,202 | 23.17 | +1.53 | 7 | +1 | |
| United Left of Castile and León (IUCyL) | 2,549 | 3.65 | –2.82 | 0 | –1 | |
| Centrist Union–Democratic and Social Centre (UC–CDS) | 440 | 0.63 | New | 0 | ±0 | |
| Spanish Democratic Party (PADE) | 131 | 0.19 | New | 0 | ±0 | |
| The Phalanx (FE) | 108 | 0.15 | New | 0 | ±0 | |
| Humanist Party (PH) | 91 | 0.13 | ±0.00 | 0 | ±0 | |
| National Democracy (DN) | 85 | 0.12 | New | 0 | ±0 | |
| Blank ballots | 1,882 | 2.69 | +0.75 | |||
| Total | 69,927 | 27 | ±0 | |||
| Valid votes | 69,927 | 99.17 | –0.19 | |||
| Invalid votes | 585 | 0.83 | +0.19 | |||
| Votes cast / turnout | 70,512 | 56.17 | –11.34 | |||
| Abstentions | 55,016 | 43.83 | +11.34 | |||
| Registered voters | 125,528 | |||||
| Sources[1][6] | ||||||
Palencia
- Population: 79,745
 | ||||||
| Parties and coalitions | Popular vote | Seats | ||||
|---|---|---|---|---|---|---|
| Votes | % | ±pp | Total | +/− | ||
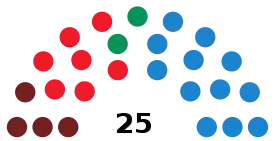
| Spanish Socialist Workers' Party (PSOE) | 20,676 | 48.07 | +9.98 | 13 | +3 | |
| People's Party (PP) | 17,110 | 39.78 | –5.78 | 11 | –2 | |
| United Left (IU) | 2,300 | 5.35 | –3.41 | 1 | –1 | |
| Federation of Associations for Urban Social Respect (FARSU) | 718 | 1.67 | New | 0 | ±0 | |
| Regionalist Unity of Castile and León (URCL) | 494 | 1.15 | +0.53 | 0 | ±0 | |
| Commoners' Land–Castilian Nationalist Party (TC–PNC) | 327 | 0.76 | +0.22 | 0 | ±0 | |
| Humanist Party (PH) | 109 | 0.25 | New | 0 | ±0 | |
| Blank ballots | 1,279 | 2.97 | +1.07 | |||
| Total | 43,013 | 25 | ±0 | |||
| Valid votes | 43,013 | 99.05 | –0.12 | |||
| Invalid votes | 411 | 0.95 | +0.12 | |||
| Votes cast / turnout | 43,424 | 64.18 | –6.91 | |||
| Abstentions | 24,234 | 35.82 | +6.91 | |||
| Registered voters | 67,658 | |||||
| Sources[1][7] | ||||||
Ponferrada
- Population: 61,469
 | ||||||
| Parties and coalitions | Popular vote | Seats | ||||
|---|---|---|---|---|---|---|
| Votes | % | ±pp | Total | +/− | ||
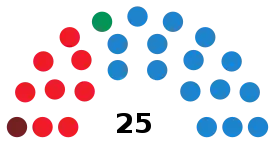
| People's Party (PP) | 18,076 | 57.34 | +13.14 | 16 | +4 | |
| Spanish Socialist Workers' Party (PSOE) | 9,766 | 30.98 | –4.63 | 8 | –1 | |
| Party of El Bierzo (PB) | 1,671 | 5.30 | –3.40 | 1 | –1 | |
| United Left of Castile and León (IUCyL) | 1,450 | 4.60 | –3.01 | 0 | –2 | |
| Blank ballots | 563 | 1.79 | –0.06 | |||
| Total | 31,526 | 25 | ±0 | |||
| Valid votes | 31,526 | 99.22 | +0.21 | |||
| Invalid votes | 247 | 0.78 | –0.21 | |||
| Votes cast / turnout | 31,773 | 59.84 | –5.04 | |||
| Abstentions | 21,327 | 40.16 | +5.04 | |||
| Registered voters | 53,100 | |||||
| Sources[1][8] | ||||||
Salamanca
- Population: 158,457
 | ||||||
| Parties and coalitions | Popular vote | Seats | ||||
|---|---|---|---|---|---|---|
| Votes | % | ±pp | Total | +/− | ||
| People's Party (PP) | 43,049 | 53.91 | –0.16 | 17 | +1 | |
| Spanish Socialist Workers' Party (PSOE) | 25,722 | 32.21 | –0.98 | 10 | +1 | |
| United Left of Castile and León (IUCyL) | 3,704 | 4.64 | –3.99 | 0 | –2 | |
| Regionalist Unity of Castile and León (URCL) | 1,883 | 2.36 | +1.42 | 0 | ±0 | |
| Independent Salamancan Union (USI) | 1,334 | 1.67 | New | 0 | ±0 | |
| Salamancan People for Salamanca–PREPAL (PREPAL) | 399 | 0.50 | +0.10 | 0 | ±0 | |
| Commoners' Land–Castilian Nationalist Party (TC–PNC) | 191 | 0.24 | New | 0 | ±0 | |
| The Phalanx (FE) | 170 | 0.21 | New | 0 | ±0 | |
| Spanish Democratic Party (PADE) | 156 | 0.20 | New | 0 | ±0 | |
| Humanist Party (PH) | 147 | 0.18 | New | 0 | ±0 | |
| Blank ballots | 3,104 | 3.89 | +2.08 | |||
| Total | 79,859 | 27 | ±0 | |||
| Valid votes | 79,859 | 99.15 | –0.23 | |||
| Invalid votes | 688 | 0.85 | +0.23 | |||
| Votes cast / turnout | 80,547 | 57.41 | –12.50 | |||
| Abstentions | 59,757 | 42.59 | +12.50 | |||
| Registered voters | 140,304 | |||||
| Sources[1][9] | ||||||
Segovia
- Population: 54,012
 | ||||||
| Parties and coalitions | Popular vote | Seats | ||||
|---|---|---|---|---|---|---|
| Votes | % | ±pp | Total | +/− | ||
| People's Party (PP) | 11,260 | 41.19 | –11.55 | 12 | –3 | |
| Spanish Socialist Workers' Party (PSOE) | 7,218 | 26.40 | +4.00 | 7 | +1 | |
| United Left of Castile and León (IUCyL) | 3,824 | 13.99 | –1.64 | 4 | ±0 | |
| Centrist Union–Democratic and Social Centre (UC–CDS) | 2,005 | 7.33 | New | 2 | +2 | |
| Spanish Democratic Party (PADE) | 960 | 3.51 | New | 0 | ±0 | |
| The Greens–Green Group (LV–GV) | 629 | 2.30 | +0.29 | 0 | ±0 | |
| Commoners' Land–Castilian Nationalist Party (TC–PNC) | 241 | 0.88 | New | 0 | ±0 | |
| Humanist Party (PH) | 57 | 0.21 | New | 0 | ±0 | |
| Blank ballots | 1,146 | 4.19 | +1.55 | |||
| Total | 27,340 | 25 | ±0 | |||
| Valid votes | 27,340 | 98.61 | –0.36 | |||
| Invalid votes | 385 | 1.39 | +0.36 | |||
| Votes cast / turnout | 27,725 | 61.34 | –7.83 | |||
| Abstentions | 17,475 | 38.66 | +7.83 | |||
| Registered voters | 45,200 | |||||
| Sources[1][10] | ||||||
Soria
- Population: 33,882
 | ||||||
| Parties and coalitions | Popular vote | Seats | ||||
|---|---|---|---|---|---|---|
| Votes | % | ±pp | Total | +/− | ||
| People's Party (PP) | 6,135 | 41.87 | –3.26 | 10 | –1 | |
| Spanish Socialist Workers' Party (PSOE) | 4,014 | 27.39 | +5.96 | 6 | +1 | |
| Independent Sorian Alternative (ALSI) | 2,671 | 18.23 | +7.60 | 4 | +2 | |
| United Left of Castile and León (IUCyL) | 1,185 | 8.09 | –1.51 | 1 | –1 | |
| Blank ballots | 648 | 4.42 | +1.48 | |||
| Total | 14,653 | 21 | ±0 | |||
| Valid votes | 14,653 | 98.07 | –1.02 | |||
| Invalid votes | 289 | 1.93 | +1.02 | |||
| Votes cast / turnout | 14,942 | 53.44 | –7.52 | |||
| Abstentions | 13,019 | 46.56 | +7.52 | |||
| Registered voters | 27,961 | |||||
| Sources[1][11] | ||||||
Valladolid
- Population: 319,946
 | ||||||
| Parties and coalitions | Popular vote | Seats | ||||
|---|---|---|---|---|---|---|
| Votes | % | ±pp | Total | +/− | ||
| People's Party (PP) | 79,526 | 45.83 | –1.50 | 15 | ±0 | |
| Spanish Socialist Workers' Party (PSOE) | 64,278 | 37.05 | +3.25 | 12 | +2 | |
| United Left of Castile and León (IUCyL) | 13,357 | 7.70 | –6.10 | 2 | –2 | |
| Independent Candidacy–Union of Regionalist Parties of Castile and León (CI) | 6,619 | 3.81 | +2.71 | 0 | ±0 | |
| Platform of Independents of Spain (PIE) | 1,297 | 0.75 | +0.48 | 0 | ±0 | |
| Centrist Union–Democratic and Social Centre (UC–CDS) | 967 | 0.56 | New | 0 | ±0 | |
| Commoners' Land–Castilian Nationalist Party (TC–PNC) | 796 | 0.46 | +0.16 | 0 | ±0 | |
| Regionalist Unity of Castile and León (URCL) | 623 | 0.36 | +0.10 | 0 | ±0 | |
| Federation of Associations for Urban Social Respect (FARSU) | 595 | 0.34 | New | 0 | ±0 | |
| Humanist Party (PH) | 358 | 0.21 | New | 0 | ±0 | |
| Independent Spanish Phalanx (FEI) | 356 | 0.21 | New | 0 | ±0 | |
| Blank ballots | 4,741 | 2.73 | +0.82 | |||
| Total | 173,513 | 29 | ±0 | |||
| Valid votes | 173,513 | 99.31 | +0.09 | |||
| Invalid votes | 1,203 | 0.69 | –0.09 | |||
| Votes cast / turnout | 174,716 | 63.46 | –8.26 | |||
| Abstentions | 100,607 | 36.54 | +8.26 | |||
| Registered voters | 275,323 | |||||
| Sources[1][12] | ||||||
Zamora
- Population: 64,421
 | ||||||
| Parties and coalitions | Popular vote | Seats | ||||
|---|---|---|---|---|---|---|
| Votes | % | ±pp | Total | +/− | ||
| People's Party (PP) | 15,375 | 50.12 | –2.40 | 15 | +1 | |
| Spanish Socialist Workers' Party (PSOE) | 9,213 | 30.03 | –3.08 | 8 | –1 | |
| Centrist Union–Democratic and Social Centre (UC–CDS) | 1,794 | 5.85 | New | 1 | +1 | |
| United Left (IU) | 1,588 | 5.18 | –3.93 | 1 | –1 | |
| Zamoran People's Union (UPZ) | 817 | 2.66 | New | 0 | ±0 | |
| Zamoran People for Zamora–PREPAL (PREPAL) | 513 | 1.67 | –0.70 | 0 | ±0 | |
| Democratic Party of the New Left (PDNI) | 314 | 1.02 | New | 0 | ±0 | |
| Humanist Party (PH) | 61 | 0.20 | New | 0 | ±0 | |
| Regionalist Unity of Castile and León (URCL) | 60 | 0.20 | New | 0 | ±0 | |
| Blank ballots | 941 | 3.07 | +1.18 | |||
| Total | 30,676 | 25 | ±0 | |||
| Valid votes | 30,676 | 98.71 | +0.27 | |||
| Invalid votes | 400 | 1.29 | –0.27 | |||
| Votes cast / turnout | 31,076 | 57.16 | –8.60 | |||
| Abstentions | 23,295 | 42.84 | +8.60 | |||
| Registered voters | 54,371 | |||||
| Sources[1][13] | ||||||
References
- "Elecciones Municipales en Castilla y León (1979 - 2019)". Historia Electoral.com (in Spanish). Retrieved 7 June 2019.
- "Elecciones Municipales. 13 de junio de 1999. Castilla y León". eldiario.es (in Spanish). Retrieved 7 June 2019.
- "13J/Elecciones Municipales 1999. Castilla y León". Público (in Spanish). Retrieved 7 June 2019.
- "Electoral Results Consultation. Municipal. June 1999. Ávila Municipality". Ministry of the Interior (in Spanish). Retrieved 7 June 2019.
- "Electoral Results Consultation. Municipal. June 1999. Burgos Municipality". Ministry of the Interior (in Spanish). Retrieved 7 June 2019.
- "Electoral Results Consultation. Municipal. June 1999. León Municipality". Ministry of the Interior (in Spanish). Retrieved 7 June 2019.
- "Electoral Results Consultation. Municipal. June 1999. Palencia Municipality". Ministry of the Interior (in Spanish). Retrieved 7 June 2019.
- "Electoral Results Consultation. Municipal. June 1999. Ponferrada Municipality". Ministry of the Interior (in Spanish). Retrieved 19 June 2020.
- "Electoral Results Consultation. Municipal. June 1999. Salamanca Municipality". Ministry of the Interior (in Spanish). Retrieved 7 June 2019.
- "Electoral Results Consultation. Municipal. June 1999. Segovia Municipality". Ministry of the Interior (in Spanish). Retrieved 7 June 2019.
- "Electoral Results Consultation. Municipal. June 1999. Soria Municipality". Ministry of the Interior (in Spanish). Retrieved 7 June 2019.
- "Electoral Results Consultation. Municipal. June 1999. Valladolid Municipality". Ministry of the Interior (in Spanish). Retrieved 7 June 2019.
- "Electoral Results Consultation. Municipal. June 1999. Zamora Municipality". Ministry of the Interior (in Spanish). Retrieved 7 June 2019.
This article is issued from Wikipedia. The text is licensed under Creative Commons - Attribution - Sharealike. Additional terms may apply for the media files.