Results breakdown of the 1983 Spanish local elections (Castile and León)
This is the results breakdown of the local elections held in Castile and León on 8 May 1983. The following tables show detailed results in the autonomous community's most populous municipalities, sorted alphabetically.[1][2]
Overall
| Parties and coalitions | Popular vote | Councillors | ||||
|---|---|---|---|---|---|---|
| Votes | % | ±pp | Total | +/− | ||
| Spanish Socialist Workers' Party (PSOE) | 547,715 | 40.60 | +17.29 | 4,595 | +3,166 | |
| People's Coalition (AP–PDP–UL)1 | 511,552 | 37.92 | +31.55 | 6,803 | +6,018 | |
| Democratic and Social Centre (CDS) | 65,192 | 4.83 | New | 735 | +736 | |
| Communist Party of Spain (PCE) | 42,144 | 3.12 | –2.91 | 86 | –47 | |
| Liberal Democratic Party (PDL) | 31,247 | 2.32 | New | 518 | ±0 | |
| Agrarian Bloc–Spanish Ruralist Party (BAR–PRE) | 6,645 | 0.49 | +0.10 | 202 | +94 | |
| Agrarian Regionalist Spanish Bloc (BARE) | 1,916 | 0.14 | New | 50 | +50 | |
| Regionalist Party of the Leonese Country (PREPAL) | 4,734 | 0.35 | New | 32 | ±0 | |
| Party of El Bierzo (PB) | 2,199 | 0.16 | New | 8 | ±0 | |
| Others | 121,413 | 8.99 | –8.51 | 1,725 | –1,729 | |
| Blank ballots | 3,608 | 0.27 | +0.24 | |||
| Total | 1,348,957 | 100.00 | 13,962 | +744 | ||
| Valid votes | 1,348,957 | 99.78 | +3.46 | |||
| Invalid votes | 2,914 | 0.22 | –3.46 | |||
| Votes cast / turnout | 1,351,871 | 68.22 | +7.29 | |||
| Abstentions | 629,814 | 31.78 | –7.29 | |||
| Registered voters | 1,981,685 | |||||
| Sources[1][3] | ||||||
City control
The following table lists party control in the most populous municipalities, including provincial capitals (shown in bold).[1] Gains for a party are displayed with the cell's background shaded in that party's colour.
| Municipality | Population | Previous control | New control | ||
|---|---|---|---|---|---|
| Ávila | 40,173 | Union of the Democratic Centre (UCD) | People's Coalition (AP–PDP–UL) | ||
| Burgos | 152,545 | Union of the Democratic Centre (UCD) | People's Coalition (AP–PDP–UL) (SI in 1987) | ||
| León | 127,095 | Union of the Democratic Centre (UCD) | Independents of León (IL) | ||
| Palencia | 71,716 | Union of the Democratic Centre (UCD) | People's Coalition (AP–PDP–UL) | ||
| Ponferrada | 53,763 | Spanish Socialist Workers' Party (PSOE) | Spanish Socialist Workers' Party (PSOE) | ||
| Salamanca | 153,981 | Spanish Socialist Workers' Party (PSOE) | Spanish Socialist Workers' Party (PSOE) | ||
| Segovia | 50,759 | Union of the Democratic Centre (UCD) | Spanish Socialist Workers' Party (PSOE) (PDP in 1986) | ||
| Soria | 30,326 | Union of the Democratic Centre (UCD) | People's Coalition (AP–PDP–UL) | ||
| Valladolid | 320,293 | Spanish Socialist Workers' Party (PSOE) | Spanish Socialist Workers' Party (PSOE) | ||
| Zamora | 58,560 | Union of the Democratic Centre (UCD) | Spanish Socialist Workers' Party (PSOE) | ||
Municipalities
Ávila
- Population: 40,173
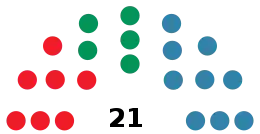 | ||||||
| Parties and coalitions | Popular vote | Seats | ||||
|---|---|---|---|---|---|---|
| Votes | % | ±pp | Total | +/− | ||
| People's Coalition (AP–PDP–UL) | 7,845 | 40.15 | New | 9 | +9 | |
| Spanish Socialist Workers' Party (PSOE) | 6,312 | 32.30 | +9.24 | 7 | +2 | |
| Democratic and Social Centre (CDS) | 4,417 | 22.61 | New | 5 | +5 | |
| Communist Party of Spain (PCE) | 719 | 3.68 | –2.31 | 0 | –1 | |
| Independent Group (AI) | 246 | 1.26 | New | 0 | ±0 | |
| Union of the Democratic Centre (UCD) | n/a | n/a | –67.95 | 0 | –15 | |
| Blank ballots | 0 | 0.00 | –1.22 | |||
| Total | 19,539 | 21 | ±0 | |||
| Valid votes | 19,539 | 100.00 | +1.46 | |||
| Invalid votes | 0 | 0.00 | –1.46 | |||
| Votes cast / turnout | 19,539 | 64.98 | +2.22 | |||
| Abstentions | 10,529 | 35.02 | –2.22 | |||
| Registered voters | 30,068 | |||||
| Sources[1][4] | ||||||
Burgos
- Population: 152,545
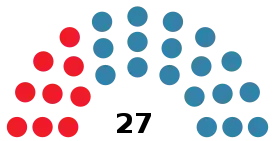 | ||||||
| Parties and coalitions | Popular vote | Seats | ||||
|---|---|---|---|---|---|---|
| Votes | % | ±pp | Total | +/− | ||
| People's Coalition (AP–PDP–UL)1 | 43,407 | 59.28 | +49.44 | 18 | +15 | |
| Spanish Socialist Workers' Party (PSOE) | 22,228 | 30.36 | +4.92 | 9 | +1 | |
| Communist Party of Spain (PCE) | 2,200 | 3.00 | –4.27 | 0 | –2 | |
| Independents (INDEP) | 2,115 | 2.89 | –4.21 | 0 | –2 | |
| Democratic and Social Centre (CDS) | 1,789 | 2.44 | New | 0 | ±0 | |
| Liberal Democratic Party (PDL) | 1,485 | 2.03 | New | 0 | ±0 | |
| Union of the Democratic Centre (UCD) | n/a | n/a | –38.82 | 0 | –12 | |
| Blank ballots | 0 | 0.00 | ±0.00 | |||
| Total | 73,224 | 27 | ±0 | |||
| Valid votes | 73,224 | 100.00 | +7.68 | |||
| Invalid votes | 0 | 0.00 | –7.68 | |||
| Votes cast / turnout | 73,224 | 64.75 | +1.04 | |||
| Abstentions | 39,868 | 35.25 | –1.04 | |||
| Registered voters | 113,092 | |||||
| Sources[1][5] | ||||||
León
- Population: 127,095
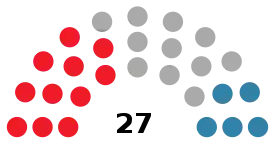 | ||||||
| Parties and coalitions | Popular vote | Seats | ||||
|---|---|---|---|---|---|---|
| Votes | % | ±pp | Total | +/− | ||
| Spanish Socialist Workers' Party (PSOE) | 23,912 | 37.87 | +4.67 | 11 | +1 | |
| Independents of León (IL) | 23,596 | 37.37 | New | 11 | +11 | |
| People's Coalition (AP–PDP–UL)1 | 12,324 | 19.52 | +6.28 | 5 | +2 | |
| Communist Party of Spain (PCE) | 1,686 | 2.67 | –11.05 | 0 | –4 | |
| Regionalist Party of the Leonese Country (PREPAL) | 987 | 1.56 | New | 0 | ±0 | |
| Democratic and Social Centre (CDS) | 645 | 1.02 | New | 0 | ±0 | |
| Union of the Democratic Centre (UCD) | n/a | n/a | –34.57 | 0 | –10 | |
| Blank ballots | 0 | 0.00 | ±0.00 | |||
| Total | 63,150 | 27 | ±0 | |||
| Valid votes | 63,150 | 100.00 | +1.90 | |||
| Invalid votes | 0 | 0.00 | –1.90 | |||
| Votes cast / turnout | 63,150 | 66.16 | +7.59 | |||
| Abstentions | 32,296 | 33.84 | –7.59 | |||
| Registered voters | 95,446 | |||||
| Sources[1][6] | ||||||
Palencia
- Population: 71,716
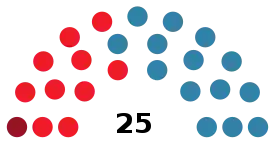 | ||||||
| Parties and coalitions | Popular vote | Seats | ||||
|---|---|---|---|---|---|---|
| Votes | % | ±pp | Total | +/− | ||
| People's Coalition (AP–PDP–UL)1 | 18,617 | 50.55 | +41.78 | 14 | +12 | |
| Spanish Socialist Workers' Party (PSOE) | 14,584 | 39.60 | +6.11 | 10 | +1 | |
| Communist Party of Spain (PCE) | 2,524 | 6.85 | –4.46 | 1 | –2 | |
| Democratic and Social Centre (CDS) | 1,105 | 3.00 | New | 0 | ±0 | |
| Union of the Democratic Centre (UCD) | n/a | n/a | –40.50 | 0 | –11 | |
| Blank ballots | 0 | 0.00 | ±0.00 | |||
| Total | 36,830 | 25 | ±0 | |||
| Valid votes | 36,830 | 100.00 | +1.47 | |||
| Invalid votes | 0 | 0.00 | –1.47 | |||
| Votes cast / turnout | 36,830 | 71.18 | +10.32 | |||
| Abstentions | 14,911 | 28.82 | –10.32 | |||
| Registered voters | 51,741 | |||||
| Sources[1][7] | ||||||
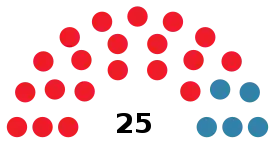
Ponferrada
- Population: 53,763
 | ||||||
| Parties and coalitions | Popular vote | Seats | ||||
|---|---|---|---|---|---|---|
| Votes | % | ±pp | Total | +/− | ||
| Spanish Socialist Workers' Party (PSOE) | 16,647 | 67.41 | +38.25 | 20 | +12 | |
| People's Coalition (AP–PDP–UL)1 | 4,686 | 18.98 | +15.36 | 5 | +5 | |
| Party of El Bierzo (PB) | 1,061 | 4.30 | New | 0 | ±0 | |
| Liberal Democratic Party (PDL) | 1,040 | 4.21 | New | 0 | ±0 | |
| Communist Party of Spain (PCE) | 924 | 3.74 | –6.41 | 0 | –2 | |
| Democratic and Social Centre (CDS) | 336 | 1.36 | New | 0 | ±0 | |
| Union of the Democratic Centre (UCD) | n/a | n/a | –27.27 | 0 | –8 | |
| Independent Neighbors Association (AVI) | n/a | n/a | –17.97 | 0 | –5 | |
| Bierzo Independents (IB) | n/a | n/a | –8.53 | 0 | –2 | |
| Blank ballots | 0 | 0.00 | ±0.00 | |||
| Total | 24,694 | 25 | ±0 | |||
| Valid votes | 24,694 | 100.00 | +0.98 | |||
| Invalid votes | 0 | 0.00 | –0.98 | |||
| Votes cast / turnout | 24,694 | 60.46 | +5.45 | |||
| Abstentions | 16,152 | 39.54 | –5.45 | |||
| Registered voters | 40,846 | |||||
| Sources[1][8] | ||||||
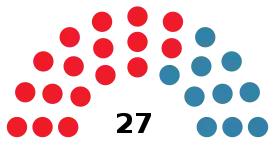
Salamanca
- Population: 153,981
 | ||||||
| Parties and coalitions | Popular vote | Seats | ||||
|---|---|---|---|---|---|---|
| Votes | % | ±pp | Total | +/− | ||
| Spanish Socialist Workers' Party (PSOE) | 45,573 | 56.67 | +20.57 | 17 | +6 | |
| People's Coalition (AP–PDP–UL)1 | 27,470 | 34.16 | +29.64 | 10 | +10 | |
| Democratic and Social Centre (CDS) | 3,648 | 4.54 | New | 0 | ±0 | |
| Communist Party of Spain (PCE) | 2,215 | 2.75 | –8.86 | 0 | –3 | |
| Independents (INDEP) | 1,520 | 1.89 | New | 0 | ±0 | |
| Union of the Democratic Centre (UCD) | n/a | n/a | –43.96 | 0 | –13 | |
| Blank ballots | 0 | 0.00 | ±0.00 | |||
| Total | 80,423 | 27 | ±0 | |||
| Valid votes | 80,423 | 100.00 | +1.41 | |||
| Invalid votes | 0 | 0.00 | –1.41 | |||
| Votes cast / turnout | 80,423 | 70.72 | +9.72 | |||
| Abstentions | 33,302 | 29.28 | –9.72 | |||
| Registered voters | 113,725 | |||||
| Sources[1][9] | ||||||
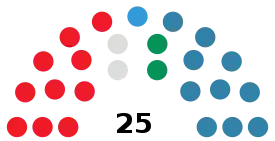
Segovia
- Population: 50,759
 | ||||||
| Parties and coalitions | Popular vote | Seats | ||||
|---|---|---|---|---|---|---|
| Votes | % | ±pp | Total | +/− | ||
| Spanish Socialist Workers' Party (PSOE) | 9,368 | 37.45 | +4.62 | 10 | +3 | |
| People's Coalition (AP–PDP–UL) | 8,889 | 35.53 | New | 10 | +10 | |
| Democratic and Social Centre (CDS) | 2,210 | 8.83 | New | 2 | +2 | |
| Independents (INDEP) | 2,115 | 8.45 | New | 2 | +2 | |
| Liberal Democratic Party (PDL) | 1,409 | 5.63 | New | 1 | +1 | |
| Communist Party of Spain (PCE) | 1,024 | 4.09 | –3.27 | 0 | –1 | |
| Union of the Democratic Centre (UCD) | n/a | n/a | –57.46 | 0 | –13 | |
| Blank ballots | 0 | 0.00 | ±0.00 | |||
| Total | 25,015 | 25 | +4 | |||
| Valid votes | 25,015 | 100.00 | +3.89 | |||
| Invalid votes | 0 | 0.00 | –3.89 | |||
| Votes cast / turnout | 25,015 | 66.82 | +1.76 | |||
| Abstentions | 12,421 | 33.18 | –1.76 | |||
| Registered voters | 37,436 | |||||
| Sources[1][10] | ||||||
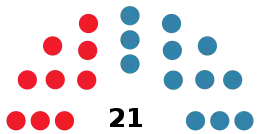
Soria
- Population: 30,326
 | ||||||
| Parties and coalitions | Popular vote | Seats | ||||
|---|---|---|---|---|---|---|
| Votes | % | ±pp | Total | +/− | ||
| People's Coalition (AP–PDP–UL)1 | 6,854 | 54.57 | +39.72 | 12 | +9 | |
| Spanish Socialist Workers' Party (PSOE) | 5,707 | 45.43 | +19.05 | 9 | +3 | |
| Union of the Democratic Centre (UCD) | n/a | n/a | –34.67 | 0 | –8 | |
| Communist Party of Spain (PCE) | n/a | n/a | –6.15 | 1 | –1 | |
| Independent Electoral Group (AEI) | n/a | n/a | –6.00 | 1 | –1 | |
| Citizen Movement of Soria (MCS) | n/a | n/a | –5.78 | 1 | –1 | |
| Sorian Independent Group (GIS) | n/a | n/a | –5.19 | 0 | –1 | |
| Blank ballots | 0 | 0.00 | ±0.00 | |||
| Total | 12,561 | 21 | ±0 | |||
| Valid votes | 12,561 | 100.00 | +2.48 | |||
| Invalid votes | 0 | 0.00 | –2.48 | |||
| Votes cast / turnout | 12,561 | 55.16 | –2.08 | |||
| Abstentions | 10,210 | 44.84 | +2.08 | |||
| Registered voters | 22,771 | |||||
| Sources[1][11] | ||||||
Valladolid
- Population: 320,293
 | ||||||
| Parties and coalitions | Popular vote | Seats | ||||
|---|---|---|---|---|---|---|
| Votes | % | ±pp | Total | +/− | ||
| Spanish Socialist Workers' Party (PSOE) | 89,944 | 58.61 | +18.80 | 19 | +6 | |
| People's Coalition (AP–PDP–UL)1 | 47,013 | 30.64 | +25.47 | 9 | +8 | |
| Communist Party of Spain (PCE) | 8,419 | 5.49 | –7.57 | 1 | –3 | |
| Democratic and Social Centre (CDS) | 6,482 | 4.22 | New | 0 | ±0 | |
| Agrarian Bloc–Spanish Ruralist Party (BAR–PRE) | 806 | 0.53 | New | 0 | ±0 | |
| UP–PR–INDEP (UP–PR–INDEP) | 791 | 0.52 | New | 0 | ±0 | |
| Union of the Democratic Centre (UCD) | n/a | n/a | –27.89 | 0 | –9 | |
| Independents (INDEP) | n/a | n/a | –7.62 | 0 | –2 | |
| Blank ballots | 0 | 0.00 | ±0.00 | |||
| Total | 153,455 | 29 | ±0 | |||
| Valid votes | 153,455 | 100.00 | +2.18 | |||
| Invalid votes | 0 | 0.00 | –2.18 | |||
| Votes cast / turnout | 153,455 | 64.55 | +6.83 | |||
| Abstentions | 84,286 | 35.45 | –6.83 | |||
| Registered voters | 237,741 | |||||
| Sources[1][12] | ||||||
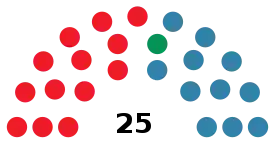
Zamora
- Population: 58,560
 | ||||||
| Parties and coalitions | Popular vote | Seats | ||||
|---|---|---|---|---|---|---|
| Votes | % | ±pp | Total | +/− | ||
| Spanish Socialist Workers' Party (PSOE) | 12,815 | 47.09 | +14.32 | 13 | +4 | |
| People's Coalition (AP–PDP–UL)1 | 10,613 | 39.00 | +26.17 | 11 | +8 | |
| Democratic and Social Centre (CDS) | 1,596 | 5.87 | New | 1 | +1 | |
| Liberal Democratic Party (PDL) | 794 | 2.92 | New | 0 | ±0 | |
| Communist Party of Spain (PCE) | 735 | 2.70 | New | 0 | ±0 | |
| Regionalist Party of the Leonese Country (PREPAL) | 659 | 2.42 | New | 0 | ±0 | |
| Union of the Democratic Centre (UCD) | n/a | n/a | –37.64 | 0 | –11 | |
| Independent Zamorans Union (UZI) | n/a | n/a | –8.86 | 0 | –2 | |
| Blank ballots | 0 | 0.00 | ±0.00 | |||
| Total | 27,212 | 25 | ±0 | |||
| Valid votes | 27,212 | 100.00 | +3.71 | |||
| Invalid votes | 0 | 0.00 | –3.71 | |||
| Votes cast / turnout | 27,212 | 60.53 | +9.10 | |||
| Abstentions | 17,743 | 39.47 | –9.10 | |||
| Registered voters | 44,955 | |||||
| Sources[1][13] | ||||||
References
- "Elecciones Municipales en Castilla y León (1979 - 2019)". Historia Electoral.com (in Spanish). Retrieved 7 June 2019.
- "Elecciones Municipales. 8 de mayo de 1983. Castilla y León". eldiario.es (in Spanish). Retrieved 7 June 2019.
- "Electoral Results Consultation. Municipal. May 1983. Castile and León". Ministry of the Interior (in Spanish). Retrieved 1 December 2020.
- "Electoral Results Consultation. Municipal. May 1983. Ávila Municipality". Ministry of the Interior (in Spanish). Retrieved 7 June 2019.
- "Electoral Results Consultation. Municipal. May 1983. Burgos Municipality". Ministry of the Interior (in Spanish). Retrieved 7 June 2019.
- "Electoral Results Consultation. Municipal. May 1983. León Municipality". Ministry of the Interior (in Spanish). Retrieved 7 June 2019.
- "Electoral Results Consultation. Municipal. May 1983. Palencia Municipality". Ministry of the Interior (in Spanish). Retrieved 7 June 2019.
- "Electoral Results Consultation. Municipal. May 1983. Ponferrada Municipality". Ministry of the Interior (in Spanish). Retrieved 19 June 2020.
- "Electoral Results Consultation. Municipal. May 1983. Salamanca Municipality". Ministry of the Interior (in Spanish). Retrieved 7 June 2019.
- "Electoral Results Consultation. Municipal. May 1983. Segovia Municipality". Ministry of the Interior (in Spanish). Retrieved 7 June 2019.
- "Electoral Results Consultation. Municipal. May 1983. Soria Municipality". Ministry of the Interior (in Spanish). Retrieved 7 June 2019.
- "Electoral Results Consultation. Municipal. May 1983. Valladolid Municipality". Ministry of the Interior (in Spanish). Retrieved 7 June 2019.
- "Electoral Results Consultation. Municipal. May 1983. Zamora Municipality". Ministry of the Interior (in Spanish). Retrieved 7 June 2019.
This article is issued from Wikipedia. The text is licensed under Creative Commons - Attribution - Sharealike. Additional terms may apply for the media files.