Results breakdown of the 1999 Spanish local elections (Andalusia)
This is the results breakdown of the local elections held in Andalusia on 13 June 1999. The following tables show detailed results in the autonomous community's most populous municipalities, sorted alphabetically.[1][2][3]
Overall
| Parties and coalitions | Popular vote | Councillors | ||||
|---|---|---|---|---|---|---|
| Votes | % | ±pp | Total | +/− | ||
| Spanish Socialist Workers' Party of Andalusia (PSOE–A) | 1,412,471 | 37.75 | +3.79 | 4,146 | +169 | |
| People's Party (PP) | 1,165,682 | 31.15 | ±0.00 | 2,394 | –48 | |
| United Left/The Greens–Assembly for Andalusia (IULV–CA) | 478,385 | 12.79 | –5.29 | 1,129 | –200 | |
| Andalusian Party (PA)1 | 355,684 | 9.51 | +0.25 | 544 | +120 | |
| Liberal Independent Group (GIL) | 67,620 | 1.81 | +0.84 | 74 | +31 | |
| The Greens–Andalusian Left (LV–IA) | 25,557 | 0.68 | New | 10 | +10 | |
| The Greens of Andalusia (LVA) | 7,481 | 0.20 | New | 0 | ±0 | |
| Democratic Party of the New Left–Andalusia (PDNI–A) | 13,315 | 0.36 | New | 31 | +31 | |
| Portuese Independents (IP) | 11,424 | 0.31 | –0.13 | 10 | –6 | |
| Platform of Independents of Spain (PIE) | 6,170 | 0.16 | –0.40 | 18 | –55 | |
| Andalusian Federation of Independents–Coalition of Independents (FADI–CI) | 5,851 | 0.16 | –0.19 | 18 | –40 | |
| Independent Group of Benalmádena (GIB) | 5,251 | 0.14 | +0.04 | 11 | +3 | |
| Pro-Torre del Mar Municipality Independent Group (GIPMTM) | 4,535 | 0.12 | –0.02 | 5 | ±0 | |
| Andalusian Popular Unity (UPAN) | 3,405 | 0.09 | –0.03 | 8 | ±0 | |
| Centrist Union–Democratic and Social Centre (UC–CDS) | 2,652 | 0.07 | –0.08 | 4 | –24 | |
| Independent Social Group (GSI) | 2,074 | 0.06 | New | 12 | +12 | |
| Humanist Party (PH) | 1,974 | 0.05 | +0.04 | 0 | ±0 | |
| United Rotenians (RRUU) | 1,928 | 0.05 | +0.02 | 3 | +1 | |
| Independent Sanluquenians (SI) | 1,863 | 0.05 | New | 2 | +2 | |
| Independent Motrilenian Democratic Group (ADMI) | 1,742 | 0.05 | –0.04 | 2 | –1 | |
| Linese Alternative (AL) | 1,619 | 0.04 | +0.01 | 0 | ±0 | |
| Independent Social Party of the Rincón de la Victoria Municipality (PSIMRV) | 1,601 | 0.04 | ±0.00 | 3 | ±0 | |
| People's Voice (VP) | 1,477 | 0.04 | New | 0 | ±0 | |
| The Phalanx (FE) | 1,257 | 0.03 | New | 0 | ±0 | |
| Independent Group Pro-City Council of El Palmar de Troya (GI–PPT) | 1,164 | 0.03 | New | 1 | +1 | |
| Linese People's Union (UdPL) | 1,072 | 0.03 | New | 0 | ±0 | |
| Independent Group for the Municipal Autonomy of Torrenueva (GRITO) | 922 | 0.02 | New | 0 | ±0 | |
| Andalusian Nation (NA) | 842 | 0.02 | –0.06 | 0 | ±0 | |
| Others | 112,818 | 3.02 | — | 352 | –45 | |
| Blank ballots | 52,838 | 1.41 | +0.38 | |||
| Total | 3,741,592 | 100.00 | 8,777 | –39 | ||
| Valid votes | 3,741,592 | 99.22 | –0.31 | |||
| Invalid votes | 29,584 | 0.78 | +0.31 | |||
| Votes cast / turnout | 3,771,176 | 64.64 | –4.17 | |||
| Abstentions | 2,062,854 | 35.36 | +4.17 | |||
| Registered voters | 5,834,030 | |||||
| Sources[1][4] | ||||||
City control
The following table lists party control in the most populous municipalities, including provincial capitals (shown in bold).[1] Gains for a party are displayed with the cell's background shaded in that party's colour.
Municipalities
Alcalá de Guadaíra
- Population: 56,244
 | ||||||
| Parties and coalitions | Popular vote | Seats | ||||
|---|---|---|---|---|---|---|
| Votes | % | ±pp | Total | +/− | ||
| Spanish Socialist Workers' Party of Andalusia (PSOE–A) | 14,484 | 56.57 | +16.69 | 15 | +4 | |
| People's Party (PP) | 5,168 | 20.19 | –1.89 | 5 | –1 | |
| United Left/The Greens–Assembly for Andalusia (IULV–CA) | 2,751 | 10.75 | –10.70 | 3 | –2 | |
| Andalusian Party (PA) | 2,066 | 8.07 | –5.23 | 2 | –1 | |
| Workers' Citizen Group of Alcalá de Guadaíra (ACT–AG) | 382 | 1.49 | New | 0 | ±0 | |
| Democratic Party of the New Left–Andalusia (PDNI–A) | 268 | 1.05 | New | 0 | ±0 | |
| Blank ballots | 483 | 1.89 | +0.45 | |||
| Total | 25,602 | 25 | ±0 | |||
| Valid votes | 25,602 | 99.04 | –0.64 | |||
| Invalid votes | 247 | 0.96 | +0.64 | |||
| Votes cast / turnout | 25,849 | 56.21 | –6.52 | |||
| Abstentions | 20,140 | 43.79 | +6.52 | |||
| Registered voters | 45,989 | |||||
| Sources[1][5][6] | ||||||
Algeciras
- Population: 101,972
 | ||||||
| Parties and coalitions | Popular vote | Seats | ||||
|---|---|---|---|---|---|---|
| Votes | % | ±pp | Total | +/− | ||
| Andalusian Party (PA)1 | 16,969 | 41.53 | –3.98 | 12 | ±0 | |
| Spanish Socialist Workers' Party of Andalusia (PSOE–A) | 10,519 | 25.74 | +7.92 | 7 | +2 | |
| People's Party (PP) | 8,095 | 19.81 | –6.67 | 6 | –2 | |
| United Left/The Greens–Assembly for Andalusia (IULV–CA) | 2,672 | 6.54 | –0.65 | 2 | ±0 | |
| People's Voice (VP) | 1,477 | 3.61 | New | 0 | ±0 | |
| The Voice of Algeciras (VA) | 429 | 1.05 | New | 0 | ±0 | |
| Humanist Party (PH) | 80 | 0.20 | New | 0 | ±0 | |
| Blank ballots | 622 | 1.52 | +0.80 | |||
| Total | 40,863 | 27 | ±0 | |||
| Valid votes | 40,863 | 99.35 | –0.28 | |||
| Invalid votes | 269 | 0.65 | +0.28 | |||
| Votes cast / turnout | 41,132 | 51.97 | –6.32 | |||
| Abstentions | 38,017 | 48.03 | +6.32 | |||
| Registered voters | 79,149 | |||||
| Sources[1][5][7] | ||||||
Almería
- Population: 168,025
 | ||||||
| Parties and coalitions | Popular vote | Seats | ||||
|---|---|---|---|---|---|---|
| Votes | % | ±pp | Total | +/− | ||
| People's Party (PP) | 35,169 | 45.78 | –3.03 | 13 | –1 | |
| Spanish Socialist Workers' Party of Andalusia (PSOE–A) | 30,932 | 40.26 | +9.28 | 12 | +3 | |
| United Left/The Greens–Assembly for Andalusia (IULV–CA) | 6,028 | 7.85 | –7.74 | 2 | –2 | |
| Andalusian Party (PA)1 | 1,886 | 2.45 | +0.49 | 0 | ±0 | |
| The Greens–Andalusian Left (LV–IA) | 595 | 0.77 | New | 0 | ±0 | |
| Almerian Regionalist Union (URAL) | 542 | 0.71 | New | 0 | ±0 | |
| Democratic Party of the New Left–Andalusia (PDNI–A) | 207 | 0.27 | New | 0 | ±0 | |
| Centrist Union–Democratic and Social Centre (UC–CDS) | 134 | 0.17 | New | 0 | ±0 | |
| The Phalanx (FE) | 92 | 0.12 | New | 0 | ±0 | |
| Humanist Party (PH) | 70 | 0.09 | New | 0 | ±0 | |
| Blank ballots | 1,172 | 1.53 | +0.58 | |||
| Total | 76,827 | 27 | ±0 | |||
| Valid votes | 76,827 | 99.45 | –0.27 | |||
| Invalid votes | 422 | 0.55 | +0.27 | |||
| Votes cast / turnout | 77,249 | 57.22 | –8.98 | |||
| Abstentions | 57,754 | 42.78 | +8.98 | |||
| Registered voters | 135,003 | |||||
| Sources[1][5][8] | ||||||
Antequera
- Population: 40,239
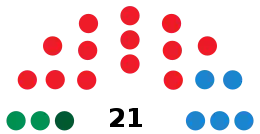 | ||||||
| Parties and coalitions | Popular vote | Seats | ||||
|---|---|---|---|---|---|---|
| Votes | % | ±pp | Total | +/− | ||
| Spanish Socialist Workers' Party of Andalusia (PSOE–A) | 12,627 | 57.60 | +13.61 | 13 | +3 | |
| People's Party (PP) | 5,594 | 25.52 | –7.43 | 5 | –3 | |
| United Left/The Greens–Assembly for Andalusia (IULV–CA) | 2,037 | 9.29 | –6.96 | 2 | –1 | |
| Andalusian Party (PA) | 1,365 | 6.23 | +5.14 | 1 | +1 | |
| Andalusian Nation (NA) | 55 | 0.25 | New | 0 | ±0 | |
| Humanist Party (PH) | 29 | 0.13 | New | 0 | ±0 | |
| Blank ballots | 216 | 0.99 | +0.15 | |||
| Total | 21,923 | 21 | ±0 | |||
| Valid votes | 21,923 | 99.35 | –0.22 | |||
| Invalid votes | 144 | 0.65 | +0.22 | |||
| Votes cast / turnout | 22,067 | 67.00 | –4.55 | |||
| Abstentions | 10,870 | 33.00 | +4.55 | |||
| Registered voters | 32,937 | |||||
| Sources[1][5][9] | ||||||
Benalmádena
- Population: 28,479
 | ||||||
| Parties and coalitions | Popular vote | Seats | ||||
|---|---|---|---|---|---|---|
| Votes | % | ±pp | Total | +/− | ||
| Independent Group of Benalmádena (GIB) | 5,251 | 40.93 | +7.14 | 11 | +3 | |
| Spanish Socialist Workers' Party of Andalusia (PSOE–A) | 2,325 | 18.12 | +0.51 | 4 | ±0 | |
| People's Party (PP) | 2,068 | 16.12 | –11.00 | 4 | –2 | |
| Liberal Independent Group (GIL) | 889 | 6.93 | New | 1 | +1 | |
| United Left/The Greens–Assembly for Andalusia (IULV–CA) | 775 | 6.04 | –9.28 | 1 | –2 | |
| Benalmádena People's Union (UPdB) | 477 | 3.72 | New | 0 | ±0 | |
| Andalusian Party (PA)1 | 457 | 3.56 | +0.24 | 0 | ±0 | |
| The Greens of Benalmádena (LVB) | 415 | 3.23 | New | 0 | ±0 | |
| Blank ballots | 173 | 1.35 | +0.28 | |||
| Total | 12,830 | 21 | ±0 | |||
| Valid votes | 12,830 | 99.70 | ±0.00 | |||
| Invalid votes | 38 | 0.30 | ±0.00 | |||
| Votes cast / turnout | 12,868 | 58.39 | –10.82 | |||
| Abstentions | 9,169 | 41.61 | +10.82 | |||
| Registered voters | 22,037 | |||||
| Sources[1][5][10] | ||||||
Cádiz
- Population: 143,129
 | ||||||
| Parties and coalitions | Popular vote | Seats | ||||
|---|---|---|---|---|---|---|
| Votes | % | ±pp | Total | +/− | ||
| People's Party (PP) | 41,062 | 62.02 | +12.97 | 18 | +3 | |
| Spanish Socialist Workers' Party of Andalusia (PSOE–A) | 14,271 | 21.56 | –1.47 | 6 | –1 | |
| United Left/The Greens–Assembly for Andalusia (IULV–CA) | 5,443 | 8.22 | –10.31 | 2 | –3 | |
| Andalusian Party (PA)1 | 3,357 | 5.07 | +0.42 | 1 | +1 | |
| The Greens–Andalusian Left (LV–IA) | 679 | 1.03 | New | 0 | ±0 | |
| Andalusia Assembly (A) | 165 | 0.25 | New | 0 | ±0 | |
| The Phalanx (FE) | 124 | 0.19 | New | 0 | ±0 | |
| Humanist Party (PH) | 114 | 0.17 | New | 0 | ±0 | |
| Blank ballots | 992 | 1.50 | +0.38 | |||
| Total | 66,207 | 27 | ±0 | |||
| Valid votes | 66,207 | 99.31 | –0.32 | |||
| Invalid votes | 458 | 0.69 | +0.32 | |||
| Votes cast / turnout | 66,665 | 57.16 | –6.78 | |||
| Abstentions | 49,954 | 42.84 | +6.78 | |||
| Registered voters | 116,619 | |||||
| Sources[1][5][11] | ||||||
Chiclana de la Frontera
- Population: 55,494
 | ||||||
| Parties and coalitions | Popular vote | Seats | ||||
|---|---|---|---|---|---|---|
| Votes | % | ±pp | Total | +/− | ||
| Spanish Socialist Workers' Party of Andalusia (PSOE–A) | 11,997 | 62.23 | +26.59 | 19 | +9 | |
| People's Party (PP) | 3,916 | 20.31 | –12.28 | 6 | –4 | |
| Andalusian Party (PA)1 | 906 | 4.70 | –3.00 | 0 | –1 | |
| United Left/The Greens–Assembly for Andalusia (IULV–CA) | 876 | 4.54 | –8.31 | 0 | –3 | |
| Independents for Chiclana (ICh) | 574 | 2.98 | New | 0 | ±0 | |
| Citizen Collective (CLC) | 401 | 2.08 | –2.71 | 0 | ±0 | |
| Platform of Independents of Spain (PIE) | 376 | 1.95 | –3.47 | 0 | –1 | |
| Blank ballots | 232 | 1.20 | +0.19 | |||
| Total | 19,278 | 25 | ±0 | |||
| Valid votes | 19,278 | 99.19 | –0.57 | |||
| Invalid votes | 158 | 0.81 | +0.57 | |||
| Votes cast / turnout | 19,436 | 45.30 | –9.23 | |||
| Abstentions | 23,470 | 54.70 | +9.23 | |||
| Registered voters | 42,906 | |||||
| Sources[1][5][12] | ||||||
Córdoba
- Population: 309,961
 | ||||||
| Parties and coalitions | Popular vote | Seats | ||||
|---|---|---|---|---|---|---|
| Votes | % | ±pp | Total | +/− | ||
| People's Party (PP) | 71,651 | 46.38 | +5.50 | 14 | +1 | |
| United Left/The Greens–Assembly for Andalusia (IULV–CA) | 44,215 | 28.62 | –8.50 | 9 | –2 | |
| Spanish Socialist Workers' Party of Andalusia (PSOE–A) | 29,815 | 19.30 | +1.93 | 6 | +1 | |
| Andalusian Party (PA)1 | 4,614 | 2.99 | +0.20 | 0 | ±0 | |
| The Greens–Andalusian Left (LV–IA) | 1,167 | 0.76 | New | 0 | ±0 | |
| Cordobese Citizen Candidacy (CCC) | 276 | 0.18 | New | 0 | ±0 | |
| The Phalanx (FE) | 156 | 0.10 | New | 0 | ±0 | |
| Humanist Party (PH) | 139 | 0.09 | New | 0 | ±0 | |
| Blank ballots | 2,444 | 1.58 | +0.05 | |||
| Total | 154,477 | 29 | ±0 | |||
| Valid votes | 154,477 | 99.47 | –0.19 | |||
| Invalid votes | 817 | 0.53 | +0.19 | |||
| Votes cast / turnout | 155,294 | 62.48 | –0.43 | |||
| Abstentions | 93,242 | 37.52 | +0.43 | |||
| Registered voters | 248,536 | |||||
| Sources[1][5][13] | ||||||
Dos Hermanas
- Population: 92,506
 | ||||||
| Parties and coalitions | Popular vote | Seats | ||||
|---|---|---|---|---|---|---|
| Votes | % | ±pp | Total | +/− | ||
| Spanish Socialist Workers' Party of Andalusia (PSOE–A) | 21,255 | 57.32 | +7.78 | 16 | +3 | |
| People's Party (PP) | 7,096 | 19.13 | –3.51 | 5 | –1 | |
| United Left/The Greens–Assembly for Andalusia (IULV–CA) | 4,378 | 11.81 | –10.82 | 3 | –3 | |
| Andalusian Party (PA)1 | 2,226 | 6.00 | +2.19 | 1 | +1 | |
| Andalusian Left–The Greens (IA–LV) | 1,330 | 3.59 | New | 0 | ±0 | |
| Humanist Party (PH) | 78 | 0.21 | New | 0 | ±0 | |
| Blank ballots | 721 | 1.94 | +0.56 | |||
| Total | 37,084 | 25 | ±0 | |||
| Valid votes | 37,084 | 99.30 | –0.48 | |||
| Invalid votes | 260 | 0.70 | +0.48 | |||
| Votes cast / turnout | 37,344 | 51.05 | –9.45 | |||
| Abstentions | 35,813 | 48.95 | +9.45 | |||
| Registered voters | 73,157 | |||||
| Sources[1][5][14] | ||||||
Écija
- Population: 37,113
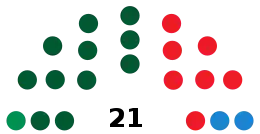 | ||||||
| Parties and coalitions | Popular vote | Seats | ||||
|---|---|---|---|---|---|---|
| Votes | % | ±pp | Total | +/− | ||
| Andalusian Party (PA) | 9,515 | 47.34 | +4.11 | 11 | +1 | |
| Spanish Socialist Workers' Party of Andalusia (PSOE–A) | 6,378 | 31.73 | +2.77 | 7 | +1 | |
| People's Party (PP) | 2,150 | 10.70 | –8.40 | 2 | –2 | |
| United Left/The Greens–Assembly for Andalusia (IULV–CA) | 1,164 | 5.79 | –1.88 | 1 | ±0 | |
| Democratic Party of the New Left–Andalusia (PDNI–A) | 640 | 3.18 | New | 0 | ±0 | |
| Blank ballots | 253 | 1.26 | +0.23 | |||
| Total | 20,100 | 21 | ±0 | |||
| Valid votes | 20,100 | 99.31 | –0.21 | |||
| Invalid votes | 140 | 0.69 | +0.21 | |||
| Votes cast / turnout | 20,240 | 68.94 | –3.06 | |||
| Abstentions | 9,118 | 31.06 | +3.06 | |||
| Registered voters | 29,358 | |||||
| Sources[1][5][15] | ||||||
El Ejido
- Population: 50,170
 | ||||||
| Parties and coalitions | Popular vote | Seats | ||||
|---|---|---|---|---|---|---|
| Votes | % | ±pp | Total | +/− | ||
| People's Party (PP) | 10,178 | 53.18 | +1.43 | 14 | +2 | |
| Spanish Socialist Workers' Party of Andalusia (PSOE–A) | 6,885 | 35.98 | +4.44 | 10 | +3 | |
| United Left/The Greens–Assembly for Andalusia (IULV–CA) | 982 | 5.13 | –3.95 | 1 | –1 | |
| Andalusian Party (PA)1 | 671 | 3.51 | +1.06 | 0 | ±0 | |
| Humanist Party (PH) | 63 | 0.33 | New | 0 | ±0 | |
| Blank ballots | 358 | 1.87 | +0.79 | |||
| Total | 19,137 | 25 | +4 | |||
| Valid votes | 19,137 | 98.92 | –0.71 | |||
| Invalid votes | 208 | 1.08 | +0.71 | |||
| Votes cast / turnout | 19,345 | 53.05 | –5.71 | |||
| Abstentions | 17,122 | 46.95 | +5.71 | |||
| Registered voters | 36,467 | |||||
| Sources[1][5][16] | ||||||
El Puerto de Santa María
- Population: 73,728
 | ||||||
| Parties and coalitions | Popular vote | Seats | ||||
|---|---|---|---|---|---|---|
| Votes | % | ±pp | Total | +/− | ||
| Portuese Independents (IP) | 11,424 | 38.83 | –19.04 | 10 | –6 | |
| People's Party (PP) | 5,605 | 19.05 | +2.19 | 5 | +1 | |
| Spanish Socialist Workers' Party of Andalusia (PSOE–A) | 5,217 | 17.73 | +7.39 | 4 | +2 | |
| United Left/The Greens–Assembly for Andalusia (IULV–CA) | 4,364 | 14.83 | +4.16 | 4 | +1 | |
| Andalusian Party (PA)1 | 2,233 | 7.59 | +5.29 | 2 | +2 | |
| Humanist Party (PH) | 72 | 0.24 | New | 0 | ±0 | |
| Blank ballots | 502 | 1.71 | +0.74 | |||
| Total | 29,417 | 25 | ±0 | |||
| Valid votes | 29,417 | 99.35 | –0.08 | |||
| Invalid votes | 191 | 0.65 | +0.08 | |||
| Votes cast / turnout | 29,608 | 52.14 | –4.71 | |||
| Abstentions | 27,182 | 47.86 | +4.71 | |||
| Registered voters | 56,790 | |||||
| Sources[1][5][17] | ||||||
Fuengirola
- Population: 44,924
 | ||||||
| Parties and coalitions | Popular vote | Seats | ||||
|---|---|---|---|---|---|---|
| Votes | % | ±pp | Total | +/− | ||
| People's Party (PP) | 9,890 | 43.90 | –11.19 | 11 | –3 | |
| Spanish Socialist Workers' Party of Andalusia (PSOE–A) | 6,455 | 28.65 | +9.17 | 7 | +3 | |
| Liberal Independent Group (GIL) | 3,093 | 13.73 | New | 3 | +3 | |
| United Left/The Greens–Assembly for Andalusia (IULV–CA) | 954 | 4.23 | –4.85 | 0 | –2 | |
| Andalusian Party (PA) | 872 | 3.87 | +1.39 | 0 | ±0 | |
| Independent Group of Fuengirola (GIF) | 481 | 2.13 | New | 0 | ±0 | |
| The Greens of Fuengirola (LV) | 369 | 1.64 | New | 0 | ±0 | |
| Andalusian Reformist Alternative (ARA) | 112 | 0.50 | New | 0 | ±0 | |
| Humanist Party (PH) | 20 | 0.09 | New | 0 | ±0 | |
| Platform of Independents of Spain (PIE) | n/a | n/a | –6.54 | 0 | –1 | |
| Blank ballots | 284 | 1.26 | –0.05 | |||
| Total | 22,530 | 21 | ±0 | |||
| Valid votes | 22,530 | 99.19 | –0.28 | |||
| Invalid votes | 184 | 0.81 | +0.28 | |||
| Votes cast / turnout | 22,714 | 65.01 | –5.38 | |||
| Abstentions | 12,226 | 34.99 | +5.38 | |||
| Registered voters | 34,940 | |||||
| Sources[1][5][18] | ||||||
Granada
- Population: 241,471
 | ||||||
| Parties and coalitions | Popular vote | Seats | ||||
|---|---|---|---|---|---|---|
| Votes | % | ±pp | Total | +/− | ||
| People's Party (PP) | 57,422 | 44.94 | –6.74 | 13 | –2 | |
| Spanish Socialist Workers' Party of Andalusia (PSOE–A) | 47,931 | 37.51 | +9.21 | 11 | +3 | |
| United Left/The Greens–Assembly for Andalusia (IULV–CA) | 9,936 | 7.78 | –7.94 | 2 | –2 | |
| Andalusian Party (PA)1 | 6,590 | 5.16 | +2.87 | 1 | +1 | |
| The Greens–Andalusian Left (LV–IA) | 1,181 | 0.92 | New | 0 | ±0 | |
| Centrist Union–Democratic and Social Centre (UC–CDS) | 700 | 0.55 | New | 0 | ±0 | |
| The Phalanx (FE) | 181 | 0.14 | New | 0 | ±0 | |
| Andalusian Nation (NA) | 175 | 0.14 | +0.04 | 0 | ±0 | |
| Humanist Party (PH) | 149 | 0.12 | New | 0 | ±0 | |
| Andalusia Assembly (A) | 121 | 0.09 | New | 0 | ±0 | |
| Blank ballots | 3,402 | 2.66 | +1.17 | |||
| Total | 127,788 | 27 | ±0 | |||
| Valid votes | 127,788 | 99.36 | –0.27 | |||
| Invalid votes | 827 | 0.64 | +0.27 | |||
| Votes cast / turnout | 128,615 | 60.61 | –6.02 | |||
| Abstentions | 83,603 | 39.39 | +6.02 | |||
| Registered voters | 212,218 | |||||
| Sources[1][5][19] | ||||||
Huelva
- Population: 139,991
 | ||||||
| Parties and coalitions | Popular vote | Seats | ||||
|---|---|---|---|---|---|---|
| Votes | % | ±pp | Total | +/− | ||
| People's Party (PP) | 40,215 | 60.82 | +18.46 | 18 | +6 | |
| Spanish Socialist Workers' Party of Andalusia (PSOE–A) | 18,347 | 27.75 | –9.74 | 8 | –3 | |
| United Left/The Greens–Assembly for Andalusia (IULV–CA) | 4,055 | 6.13 | –8.69 | 1 | –3 | |
| Andalusian Party (PA) | 2,183 | 3.30 | –0.54 | 0 | ±0 | |
| The Greens–Andalusian Left (LV–IA) | 395 | 0.60 | New | 0 | ±0 | |
| Humanist Party (PH) | 86 | 0.13 | New | 0 | ±0 | |
| Blank ballots | 841 | 1.27 | +0.15 | |||
| Total | 66,122 | 27 | ±0 | |||
| Valid votes | 66,122 | 99.46 | –0.28 | |||
| Invalid votes | 362 | 0.54 | +0.28 | |||
| Votes cast / turnout | 66,484 | 57.08 | –1.58 | |||
| Abstentions | 49,995 | 42.92 | +1.58 | |||
| Registered voters | 116,479 | |||||
| Sources[1][5][20] | ||||||
Jaén
- Population: 107,184
 | ||||||
| Parties and coalitions | Popular vote | Seats | ||||
|---|---|---|---|---|---|---|
| Votes | % | ±pp | Total | +/− | ||
| People's Party (PP) | 24,835 | 46.94 | –5.72 | 14 | –1 | |
| Spanish Socialist Workers' Party of Andalusia (PSOE–A) | 19,231 | 36.35 | +8.80 | 11 | +3 | |
| United Left/The Greens–Assembly for Andalusia (IULV–CA) | 4,593 | 8.68 | –5.18 | 2 | –2 | |
| Andalusian Party (PA)1 | 2,530 | 4.78 | +0.43 | 0 | ±0 | |
| The Greens–Andalusian Left (LV–IA) | 216 | 0.41 | New | 0 | ±0 | |
| The Phalanx (FE) | 112 | 0.21 | New | 0 | ±0 | |
| Humanist Party (PH) | 98 | 0.19 | New | 0 | ±0 | |
| Blank ballots | 1,290 | 2.44 | +1.23 | |||
| Total | 52,905 | 27 | ±0 | |||
| Valid votes | 52,905 | 99.12 | –0.51 | |||
| Invalid votes | 469 | 0.88 | +0.51 | |||
| Votes cast / turnout | 53,374 | 60.28 | –11.35 | |||
| Abstentions | 35,165 | 39.72 | +11.35 | |||
| Registered voters | 88,539 | |||||
| Sources[1][5][21] | ||||||
Jerez de la Frontera
- Population: 181,602
 | ||||||
| Parties and coalitions | Popular vote | Seats | ||||
|---|---|---|---|---|---|---|
| Votes | % | ±pp | Total | +/− | ||
| Andalusian Party (PA)1 | 32,243 | 40.59 | –1.76 | 12 | ±0 | |
| People's Party (PP) | 19,657 | 24.74 | –0.44 | 7 | ±0 | |
| Spanish Socialist Workers' Party of Andalusia (PSOE–A) | 17,914 | 22.55 | +2.76 | 6 | +1 | |
| United Left/The Greens–Assembly for Andalusia (IULV–CA) | 5,268 | 6.63 | –4.37 | 2 | –1 | |
| Andalusian Left–The Greens (IA–LV) | 2,947 | 3.71 | New | 0 | ±0 | |
| Humanist Party (PH) | 224 | 0.28 | New | 0 | ±0 | |
| Blank ballots | 1,190 | 1.50 | +0.57 | |||
| Total | 79,443 | 27 | ±0 | |||
| Valid votes | 79,443 | 99.50 | –0.14 | |||
| Invalid votes | 398 | 0.50 | +0.14 | |||
| Votes cast / turnout | 79,841 | 55.12 | –0.86 | |||
| Abstentions | 65,018 | 44.88 | +0.86 | |||
| Registered voters | 144,859 | |||||
| Sources[1][5][22] | ||||||
La Línea de la Concepción
- Population: 59,629
 | ||||||
| Parties and coalitions | Popular vote | Seats | ||||
|---|---|---|---|---|---|---|
| Votes | % | ±pp | Total | +/− | ||
| Liberal Independent Group (GIL) | 18,780 | 56.80 | New | 17 | +17 | |
| Spanish Socialist Workers' Party of Andalusia (PSOE–A) | 5,045 | 15.26 | –14.94 | 4 | –5 | |
| People's Party (PP) | 4,541 | 13.73 | –28.95 | 4 | –8 | |
| Linese Alternative (AL) | 1,619 | 4.90 | +0.43 | 0 | ±0 | |
| Linese People's Union (UdPL) | 1,072 | 3.24 | New | 0 | ±0 | |
| Andalusian Party (PA)1 | 1,066 | 3.22 | –7.46 | 0 | –2 | |
| United Left/The Greens–Assembly for Andalusia (IULV–CA) | 671 | 2.03 | –7.77 | 0 | –2 | |
| Blank ballots | 269 | 0.81 | –0.10 | |||
| Total | 33,063 | 25 | ±0 | |||
| Valid votes | 33,063 | 99.20 | –0.51 | |||
| Invalid votes | 268 | 0.80 | +0.51 | |||
| Votes cast / turnout | 33,331 | 72.34 | +13.64 | |||
| Abstentions | 12,747 | 27.66 | –13.64 | |||
| Registered voters | 46,078 | |||||
| Sources[1][5][23] | ||||||
Linares
- Population: 58,410
 | ||||||
| Parties and coalitions | Popular vote | Seats | ||||
|---|---|---|---|---|---|---|
| Votes | % | ±pp | Total | +/− | ||
| Spanish Socialist Workers' Party of Andalusia (PSOE–A) | 11,776 | 41.01 | +16.09 | 11 | +4 | |
| People's Party (PP) | 10,211 | 35.56 | +4.10 | 9 | +1 | |
| United Left/The Greens–Assembly for Andalusia (IULV–CA) | 3,486 | 12.14 | –12.17 | 3 | –3 | |
| Andalusian Party (PA)1 | 2,284 | 7.95 | –9.87 | 2 | –2 | |
| The Greens–Andalusian Left (LV–IA) | 508 | 1.77 | New | 0 | ±0 | |
| Humanist Party (PH) | 30 | 0.10 | New | 0 | ±0 | |
| Blank ballots | 421 | 1.47 | +0.15 | |||
| Total | 28,716 | 25 | ±0 | |||
| Valid votes | 28,716 | 99.12 | –0.32 | |||
| Invalid votes | 254 | 0.88 | +0.32 | |||
| Votes cast / turnout | 28,970 | 63.02 | –5.54 | |||
| Abstentions | 17,001 | 36.98 | +5.54 | |||
| Registered voters | 45,971 | |||||
| Sources[1][5][24] | ||||||
Málaga
- Population: 528,079
 | ||||||
| Parties and coalitions | Popular vote | Seats | ||||
|---|---|---|---|---|---|---|
| Votes | % | ±pp | Total | +/− | ||
| People's Party (PP) | 129,811 | 55.72 | +10.06 | 19 | +4 | |
| Spanish Socialist Workers' Party of Andalusia (PSOE–A) | 64,165 | 27.54 | +6.54 | 9 | +2 | |
| United Left/The Greens–Assembly for Andalusia (IULV–CA) | 21,513 | 9.23 | –19.20 | 3 | –6 | |
| Andalusian Party (PA)1 | 8,534 | 3.66 | +0.98 | 0 | ±0 | |
| The Greens of Andalusia–Greens (LVA–V) | 3,611 | 1.55 | New | 0 | ±0 | |
| Andalusian Nation (NA) | 474 | 0.20 | +0.15 | 0 | ±0 | |
| Humanist Party (PH) | 353 | 0.15 | +0.08 | 0 | ±0 | |
| The Phalanx (FE) | 289 | 0.12 | New | 0 | ±0 | |
| National Union (UN) | 131 | 0.06 | New | 0 | ±0 | |
| Blank ballots | 4,086 | 1.75 | +0.88 | |||
| Total | 232,967 | 31 | ±0 | |||
| Valid votes | 232,967 | 99.48 | –0.28 | |||
| Invalid votes | 1,220 | 0.52 | +0.28 | |||
| Votes cast / turnout | 234,187 | 52.42 | –12.36 | |||
| Abstentions | 212,575 | 47.58 | +12.36 | |||
| Registered voters | 446,762 | |||||
| Sources[1][5][25][26] | ||||||
Marbella
- Population: 98,377
 | ||||||
| Parties and coalitions | Popular vote | Seats | ||||
|---|---|---|---|---|---|---|
| Votes | % | ±pp | Total | +/− | ||
| Liberal Independent Group (GIL) | 21,971 | 52.30 | –13.28 | 15 | –4 | |
| Spanish Socialist Workers' Party of Andalusia (PSOE–A) | 8,519 | 20.28 | +6.60 | 5 | +2 | |
| People's Party (PP) | 5,230 | 12.45 | +5.32 | 3 | +1 | |
| Andalusian Party (PA) | 2,898 | 6.90 | +6.15 | 2 | +2 | |
| United Left/The Greens–Assembly for Andalusia (IULV–CA) | 1,591 | 3.79 | –3.00 | 0 | –1 | |
| The Greens of Marbella and San Pedro de Alcántara (LV) | 1,113 | 2.65 | New | 0 | ±0 | |
| Andalusian Nation (NA) | 126 | 0.30 | +0.12 | 0 | ±0 | |
| Humanist Party (PH) | 48 | 0.11 | New | 0 | ±0 | |
| Blank ballots | 516 | 1.23 | +0.14 | |||
| Total | 42,012 | 25 | ±0 | |||
| Valid votes | 42,012 | 99.52 | ±0.00 | |||
| Invalid votes | 203 | 0.48 | ±0.00 | |||
| Votes cast / turnout | 42,215 | 60.08 | –8.44 | |||
| Abstentions | 28,047 | 39.92 | +8.44 | |||
| Registered voters | 70,262 | |||||
| Sources[1][5][27] | ||||||
Morón de la Frontera
- Population: 28,232
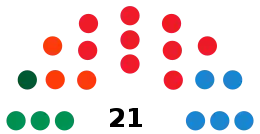 | ||||||
| Parties and coalitions | Popular vote | Seats | ||||
|---|---|---|---|---|---|---|
| Votes | % | ±pp | Total | +/− | ||
| Spanish Socialist Workers' Party of Andalusia (PSOE–A) | 4,864 | 38.42 | +0.14 | 9 | ±0 | |
| People's Party (PP) | 2,944 | 23.25 | +5.67 | 5 | +1 | |
| United Left/The Greens–Assembly for Andalusia (IULV–CA) | 1,967 | 15.54 | –22.09 | 3 | –5 | |
| Democratic Party of the New Left–Andalusia (PDNI–A) | 1,564 | 12.35 | New | 3 | +3 | |
| Andalusian Party (PA) | 944 | 7.46 | +2.56 | 1 | +1 | |
| Blank ballots | 378 | 2.99 | +1.39 | |||
| Total | 12,661 | 21 | ±0 | |||
| Valid votes | 12,661 | 99.05 | –0.55 | |||
| Invalid votes | 121 | 0.95 | +0.55 | |||
| Votes cast / turnout | 12,782 | 55.82 | –3.51 | |||
| Abstentions | 10,116 | 44.18 | +3.51 | |||
| Registered voters | 22,898 | |||||
| Sources[1][5][28] | ||||||
Motril
- Population: 50,025
 | ||||||
| Parties and coalitions | Popular vote | Seats | ||||
|---|---|---|---|---|---|---|
| Votes | % | ±pp | Total | +/− | ||
| Spanish Socialist Workers' Party of Andalusia (PSOE–A) | 8,975 | 39.55 | +3.80 | 11 | +3 | |
| People's Party (PP) | 6,704 | 29.54 | +1.42 | 8 | +2 | |
| United Left/The Greens–Assembly for Andalusia (IULV–CA) | 1,830 | 8.06 | –9.53 | 2 | –2 | |
| Andalusian Party (PA) | 1,788 | 7.88 | +4.02 | 2 | +2 | |
| Independent Motrilenian Democratic Group (ADMI) | 1,742 | 7.68 | –6.09 | 2 | –1 | |
| Independent Group for the Municipal Autonomy of Torrenueva (GRITO) | 922 | 4.06 | New | 0 | ±0 | |
| Democratic Party of the New Left–Andalusia (PDNI–A) | 404 | 1.78 | New | 0 | ±0 | |
| Blank ballots | 330 | 1.45 | +0.54 | |||
| Total | 22,695 | 25 | +4 | |||
| Valid votes | 22,695 | 99.01 | –0.34 | |||
| Invalid votes | 226 | 0.99 | +0.34 | |||
| Votes cast / turnout | 22,921 | 58.40 | –7.11 | |||
| Abstentions | 16,324 | 41.60 | +7.11 | |||
| Registered voters | 39,245 | |||||
| Sources[1][5][29] | ||||||
Ronda
- Population: 33,806
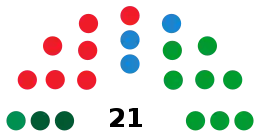 | ||||||
| Parties and coalitions | Popular vote | Seats | ||||
|---|---|---|---|---|---|---|
| Votes | % | ±pp | Total | +/− | ||
| Liberal Independent Group (GIL) | 6,614 | 35.40 | New | 8 | +8 | |
| Spanish Socialist Workers' Party of Andalusia (PSOE–A) | 6,093 | 32.61 | –17.14 | 7 | –4 | |
| People's Party (PP) | 2,471 | 13.22 | –14.95 | 3 | –3 | |
| Andalusian Party (PA) | 1,971 | 10.55 | +0.60 | 2 | ±0 | |
| United Left/The Greens–Assembly for Andalusia (IULV–CA) | 1,350 | 7.23 | –3.04 | 1 | –1 | |
| Blank ballots | 186 | 1.00 | +0.03 | |||
| Total | 18,685 | 21 | ±0 | |||
| Valid votes | 18,685 | 99.57 | –0.01 | |||
| Invalid votes | 80 | 0.43 | +0.01 | |||
| Votes cast / turnout | 18,765 | 68.98 | +0.62 | |||
| Abstentions | 8,437 | 31.02 | –0.62 | |||
| Registered voters | 27,202 | |||||
| Sources[1][5][30] | ||||||
San Fernando
- Population: 84,014
 | ||||||
| Parties and coalitions | Popular vote | Seats | ||||
|---|---|---|---|---|---|---|
| Votes | % | ±pp | Total | +/− | ||
| Andalusian Party (PA)1 | 18,741 | 55.36 | +16.22 | 15 | +4 | |
| People's Party (PP) | 7,518 | 22.21 | –8.18 | 6 | –2 | |
| Spanish Socialist Workers' Party of Andalusia (PSOE–A) | 5,393 | 15.93 | –0.49 | 4 | ±0 | |
| United Left/The Greens–Assembly for Andalusia (IULV–CA) | 1,638 | 4.84 | –5.17 | 0 | –2 | |
| Blank ballots | 560 | 1.65 | +0.53 | |||
| Total | 33,850 | 25 | ±0 | |||
| Valid votes | 33,850 | 99.13 | –0.55 | |||
| Invalid votes | 298 | 0.87 | +0.55 | |||
| Votes cast / turnout | 34,148 | 56.47 | +2.49 | |||
| Abstentions | 26,325 | 43.53 | –2.49 | |||
| Registered voters | 60,473 | |||||
| Sources[1][5][31] | ||||||
Sanlúcar de Barrameda
- Population: 61,382
 | ||||||
| Parties and coalitions | Popular vote | Seats | ||||
|---|---|---|---|---|---|---|
| Votes | % | ±pp | Total | +/− | ||
| Spanish Socialist Workers' Party of Andalusia (PSOE–A) | 6,829 | 26.86 | –9.02 | 7 | –2 | |
| People's Party (PP) | 6,506 | 25.59 | +3.66 | 7 | +1 | |
| Andalusian Party (PA)1 | 5,789 | 22.77 | +5.55 | 6 | +2 | |
| United Left/The Greens–Assembly for Andalusia (IULV–CA) | 2,631 | 10.35 | –13.57 | 3 | –3 | |
| Independent Sanluquenians (SI) | 1,863 | 7.33 | New | 2 | +2 | |
| The Greens–Andalusian Left (LV–IA) | 1,065 | 4.19 | New | 0 | ±0 | |
| United Citizens for Sanlúcar (CUS) | 366 | 1.44 | New | 0 | ±0 | |
| Blank ballots | 374 | 1.47 | +0.41 | |||
| Total | 25,423 | 25 | ±0 | |||
| Valid votes | 25,423 | 99.19 | –0.53 | |||
| Invalid votes | 208 | 0.81 | +0.53 | |||
| Votes cast / turnout | 25,631 | 55.35 | +0.64 | |||
| Abstentions | 20,676 | 44.65 | –0.64 | |||
| Registered voters | 46,307 | |||||
| Sources[1][5][32] | ||||||
Seville
- Population: 701,927
 | ||||||
| Parties and coalitions | Popular vote | Seats | ||||
|---|---|---|---|---|---|---|
| Votes | % | ±pp | Total | +/− | ||
| People's Party (PP) | 118,072 | 35.85 | +5.41 | 13 | +3 | |
| Spanish Socialist Workers' Party of Andalusia (PSOE–A) | 115,968 | 35.21 | +6.67 | 12 | +2 | |
| Andalusian Party (PA)1 | 58,093 | 17.64 | –8.75 | 6 | –3 | |
| United Left/The Greens–Assembly for Andalusia (IULV–CA) | 25,606 | 7.77 | –5.10 | 2 | –2 | |
| The Greens–Andalusian Left (LV–IA) | 2,594 | 0.79 | New | 0 | ±0 | |
| Democratic Party of the New Left–Andalusia (PDNI–A) | 608 | 0.18 | New | 0 | ±0 | |
| Voice of the Andalusian People (VDPA) | 279 | 0.08 | –0.08 | 0 | ±0 | |
| The Phalanx (FE) | 264 | 0.08 | New | 0 | ±0 | |
| Centrist Union–Democratic and Social Centre (UC–CDS) | 235 | 0.07 | New | 0 | ±0 | |
| Humanist Party (PH) | 211 | 0.06 | –0.01 | 0 | ±0 | |
| Andalusia Assembly (A) | 138 | 0.04 | New | 0 | ±0 | |
| Independent Spanish Phalanx (FEI) | 130 | 0.04 | New | 0 | ±0 | |
| Blank ballots | 7,170 | 2.18 | +0.81 | |||
| Total | 329,368 | 33 | ±0 | |||
| Valid votes | 329,368 | 99.49 | –0.12 | |||
| Invalid votes | 1,700 | 0.51 | +0.12 | |||
| Votes cast / turnout | 331,068 | 56.49 | –6.85 | |||
| Abstentions | 254,964 | 43.51 | +6.85 | |||
| Registered voters | 586,032 | |||||
| Sources[1][5][33][34] | ||||||
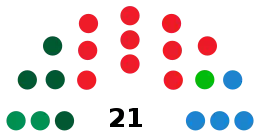
Utrera
- Population: 45,947
 | ||||||
| Parties and coalitions | Popular vote | Seats | ||||
|---|---|---|---|---|---|---|
| Votes | % | ±pp | Total | +/− | ||
| Spanish Socialist Workers' Party of Andalusia (PSOE–A) | 9,547 | 43.75 | –3.92 | 10 | –1 | |
| Andalusian Party (PA)1 | 4,514 | 20.69 | +10.30 | 4 | +2 | |
| People's Party (PP) | 3,928 | 18.00 | –3.88 | 4 | –1 | |
| United Left/The Greens–Assembly for Andalusia (IULV–CA) | 2,090 | 9.58 | –5.17 | 2 | –1 | |
| Independent Group Pro-City Council of El Palmar de Troya (GI–PPT) | 1,164 | 5.33 | New | 1 | +1 | |
| The Greens–Andalusian Left (LV–IA) | 279 | 1.28 | New | 0 | ±0 | |
| Blank ballots | 298 | 1.37 | –0.11 | |||
| Total | 21,820 | 21 | ±0 | |||
| Valid votes | 21,820 | 99.37 | –0.34 | |||
| Invalid votes | 138 | 0.63 | +0.34 | |||
| Votes cast / turnout | 21,958 | 61.57 | –3.73 | |||
| Abstentions | 13,708 | 38.43 | +3.73 | |||
| Registered voters | 35,666 | |||||
| Sources[1][5][35] | ||||||
Vélez-Málaga
- Population: 53,816
 | ||||||
| Parties and coalitions | Popular vote | Seats | ||||
|---|---|---|---|---|---|---|
| Votes | % | ±pp | Total | +/− | ||
| Spanish Socialist Workers' Party of Andalusia (PSOE–A) | 9,977 | 36.29 | +15.91 | 10 | +4 | |
| People's Party (PP) | 5,023 | 18.27 | –2.56 | 5 | –1 | |
| Pro-Torre del Mar Municipality Independent Group (GIPMTM) | 4,535 | 16.49 | –2.53 | 5 | ±0 | |
| Andalusian Party (PA)1 | 3,443 | 12.52 | +0.17 | 3 | +1 | |
| United Left/The Greens–Assembly for Andalusia (IULV–CA) | 2,146 | 7.80 | –6.75 | 2 | –2 | |
| Democratic Party of the New Left–Andalusia (PDNI–A) | 733 | 2.67 | New | 0 | ±0 | |
| La Axarquía Progress (PAX) | 430 | 1.56 | –3.78 | 0 | –1 | |
| The Greens of Andalusia (LVA) | 378 | 1.37 | New | 0 | ±0 | |
| Humanist Party (PH) | 32 | 0.12 | New | 0 | ±0 | |
| Independent Solution (SI) | n/a | n/a | –5.88 | 0 | –1 | |
| Blank ballots | 799 | 2.91 | +2.14 | |||
| Total | 27,496 | 25 | ±0 | |||
| Valid votes | 27,496 | 98.96 | –0.70 | |||
| Invalid votes | 289 | 1.04 | +0.70 | |||
| Votes cast / turnout | 27,785 | 62.78 | –7.03 | |||
| Abstentions | 16,473 | 37.22 | +7.03 | |||
| Registered voters | 44,258 | |||||
| Sources[1][5][36] | ||||||
References
- "Elecciones Municipales en Andalucía (1979 - 2019)". Historia Electoral.com (in Spanish). Retrieved 30 September 2017.
- "Elecciones Municipales. 13 de junio de 1999. Andalucía". eldiario.es (in Spanish). Retrieved 7 June 2019.
- "13J/Elecciones Municipales 1999. Andalucía". Público (in Spanish). Retrieved 3 September 2018.
- "Electoral Results Consultation. Municipal. June 1999. Andalusia". Ministry of the Interior (in Spanish). Retrieved 12 November 2017.
- "Local election results, 13 June 1999" (PDF). Central Electoral Commission (in Spanish). Retrieved 16 February 2018.
- "Electoral Results Consultation. Municipal. June 1999. Alcalá de Guadaíra Municipality". Ministry of the Interior (in Spanish). Retrieved 12 November 2017.
- "Electoral Results Consultation. Municipal. June 1999. Algeciras Municipality". Ministry of the Interior (in Spanish). Retrieved 12 November 2017.
- "Electoral Results Consultation. Municipal. June 1999. Almería Municipality". Ministry of the Interior (in Spanish). Retrieved 12 November 2017.
- "Electoral Results Consultation. Municipal. June 1999. Antequera Municipality". Ministry of the Interior (in Spanish). Retrieved 12 November 2017.
- "Electoral Results Consultation. Municipal. June 1999. Benalmádena Municipality". Ministry of the Interior (in Spanish). Retrieved 12 November 2017.
- "Electoral Results Consultation. Municipal. June 1999. Cádiz Municipality". Ministry of the Interior (in Spanish). Retrieved 12 November 2017.
- "Electoral Results Consultation. Municipal. June 1999. Chiclana de la Frontera Municipality". Ministry of the Interior (in Spanish). Retrieved 12 November 2017.
- "Electoral Results Consultation. Municipal. June 1999. Córdoba Municipality". Ministry of the Interior (in Spanish). Retrieved 12 November 2017.
- "Electoral Results Consultation. Municipal. June 1999. Dos Hermanas Municipality". Ministry of the Interior (in Spanish). Retrieved 12 November 2017.
- "Electoral Results Consultation. Municipal. June 1999. Écija Municipality". Ministry of the Interior (in Spanish). Retrieved 12 November 2017.
- "Electoral Results Consultation. Municipal. June 1999. El Ejido Municipality". Ministry of the Interior (in Spanish). Retrieved 12 November 2017.
- "Electoral Results Consultation. Municipal. June 1999. El Puerto de Santa María Municipality". Ministry of the Interior (in Spanish). Retrieved 12 November 2017.
- "Electoral Results Consultation. Municipal. June 1999. Fuengirola Municipality". Ministry of the Interior (in Spanish). Retrieved 12 November 2017.
- "Electoral Results Consultation. Municipal. June 1999. Granada Municipality". Ministry of the Interior (in Spanish). Retrieved 12 November 2017.
- "Electoral Results Consultation. Municipal. June 1999. Huelva Municipality". Ministry of the Interior (in Spanish). Retrieved 12 November 2017.
- "Electoral Results Consultation. Municipal. June 1999. Jaén Municipality". Ministry of the Interior (in Spanish). Retrieved 12 November 2017.
- "Electoral Results Consultation. Municipal. June 1999. Jerez de la Frontera Municipality". Ministry of the Interior (in Spanish). Retrieved 12 November 2017.
- "Electoral Results Consultation. Municipal. June 1999. La Línea de la Concepción Municipality". Ministry of the Interior (in Spanish). Retrieved 12 November 2017.
- "Electoral Results Consultation. Municipal. June 1999. Linares Municipality". Ministry of the Interior (in Spanish). Retrieved 12 November 2017.
- "Electoral Results Consultation. Municipal. June 1999. Málaga Municipality". Ministry of the Interior (in Spanish). Retrieved 12 November 2017.
- "Elecciones municipales en Málaga (1979 - 2015)". Historia Electoral.com (in Spanish). Retrieved 14 February 2018.
- "Electoral Results Consultation. Municipal. June 1999. Marbella Municipality". Ministry of the Interior (in Spanish). Retrieved 12 November 2017.
- "Electoral Results Consultation. Municipal. June 1999. Morón de la Frontera Municipality". Ministry of the Interior (in Spanish). Retrieved 12 November 2017.
- "Electoral Results Consultation. Municipal. June 1999. Motril Municipality". Ministry of the Interior (in Spanish). Retrieved 12 November 2017.
- "Electoral Results Consultation. Municipal. June 1999. Ronda Municipality". Ministry of the Interior (in Spanish). Retrieved 12 November 2017.
- "Electoral Results Consultation. Municipal. June 1999. San Fernando Municipality". Ministry of the Interior (in Spanish). Retrieved 12 November 2017.
- "Electoral Results Consultation. Municipal. June 1999. Sanlúcar de Barrameda Municipality". Ministry of the Interior (in Spanish). Retrieved 12 November 2017.
- "Electoral Results Consultation. Municipal. June 1999. Seville Municipality". Ministry of the Interior (in Spanish). Retrieved 12 November 2017.
- "Elecciones municipales en Sevilla (1979 - 2015)". Historia Electoral.com (in Spanish). Retrieved 30 September 2017.
- "Electoral Results Consultation. Municipal. June 1999. Utrera Municipality". Ministry of the Interior (in Spanish). Retrieved 12 November 2017.
- "Electoral Results Consultation. Municipal. June 1999. Vélez-Málaga Municipality". Ministry of the Interior (in Spanish). Retrieved 12 November 2017.
This article is issued from Wikipedia. The text is licensed under Creative Commons - Attribution - Sharealike. Additional terms may apply for the media files.