Sibutad
Sibutad, officially the Municipality of Sibutad (Cebuano: Lungsod sa Sibutad; Subanen: Benwa Sibutad; Chavacano: Municipalidad de Sibutad; Tagalog: Bayan ng Sibutad), is a 5th class municipality in the province of Zamboanga del Norte, Philippines. According to the 2015 census, it has a population of 17,645 people. [3]
Sibutad | |
|---|---|
| Municipality of Sibutad | |
| Nickname(s): Mineral Premier Capital of Zamboanga Peninsula | |
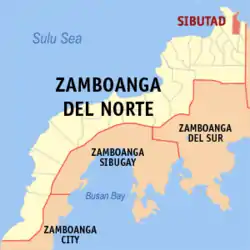 Map of Zamboanga del Norte with Sibutad highlighted | |
OpenStreetMap 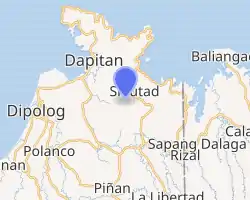
| |
.svg.png.webp) Sibutad Location within the Philippines | |
| Coordinates: 8°36′N 123°28′E | |
| Country | |
| Region | Zamboanga Peninsula (Region IX) |
| Province | Zamboanga del Norte |
| District | 1st District |
| Barangays | 16 (see Barangays) |
| Government | |
| • Type | Sangguniang Bayan |
| • Mayor | Eufracio D. Caidic |
| • Vice Mayor | Genaro A. Obnimaga |
| • Representative | Romeo M. Jalosjos Jr. |
| • Electorate | 13,176 voters (2019) |
| Area | |
| • Total | 65.57 km2 (25.32 sq mi) |
| Elevation | 123 m (404 ft) |
| Population | |
| • Total | 17,645 |
| • Density | 270/km2 (700/sq mi) |
| • Households | 4,308 |
| Economy | |
| • Income class | 5th municipal income class |
| • Poverty incidence | 40.84% (2015)[4] |
| • Revenue | ₱58,690,903.68 (2016) |
| Time zone | UTC+8 (PST) |
| ZIP code | 7103 |
| PSGC | |
| IDD : area code | +63 (0)65 |
| Climate type | tropical climate |
| Native languages | Subanon Cebuano Tagalog |
| Website | sibutad |
Barangays
Sibutad is politically subdivided into 16 barangays.
- Bagacay
- Calilic
- Calube
- Delapa
- Kanim
- Libay
- Magsaysay
- Marapong
- Minlasag
- Oyan
- Panganuran
- Poblacion (Sibutad)
- Sawang
- Bolicon
- Sinipay
- Sipaloc
Climate
| Climate data for Sibutad, Zamboanga del Norte | |||||||||||||
|---|---|---|---|---|---|---|---|---|---|---|---|---|---|
| Month | Jan | Feb | Mar | Apr | May | Jun | Jul | Aug | Sep | Oct | Nov | Dec | Year |
| Average high °C (°F) | 29 (84) |
29 (84) |
30 (86) |
31 (88) |
30 (86) |
29 (84) |
29 (84) |
29 (84) |
30 (86) |
29 (84) |
29 (84) |
29 (84) |
29 (85) |
| Average low °C (°F) | 23 (73) |
23 (73) |
23 (73) |
23 (73) |
24 (75) |
24 (75) |
24 (75) |
24 (75) |
24 (75) |
24 (75) |
24 (75) |
23 (73) |
24 (74) |
| Average precipitation mm (inches) | 104 (4.1) |
76 (3.0) |
92 (3.6) |
97 (3.8) |
199 (7.8) |
238 (9.4) |
195 (7.7) |
193 (7.6) |
178 (7.0) |
212 (8.3) |
171 (6.7) |
110 (4.3) |
1,865 (73.3) |
| Average rainy days | 14.7 | 12.5 | 15.8 | 17.5 | 27.6 | 28.5 | 29.0 | 27.5 | 26.9 | 27.9 | 23.5 | 18.2 | 269.6 |
| Source: Meteoblue [5] | |||||||||||||
Demographics
| Year | Pop. | ±% p.a. |
|---|---|---|
| 1960 | 7,420 | — |
| 1970 | 8,935 | +1.87% |
| 1975 | 10,888 | +4.04% |
| 1980 | 12,676 | +3.09% |
| 1990 | 16,279 | +2.53% |
| 1995 | 16,295 | +0.02% |
| 2000 | 15,635 | −0.88% |
| 2007 | 16,429 | +0.69% |
| 2010 | 16,783 | +0.78% |
| 2015 | 17,645 | +0.96% |
| Source: Philippine Statistics Authority [3] [6] [7][8] | ||
Education
Sibutad has 15 schools, 13 of which are complete elementary schools and 2 are primary schools. All are in the Sibutad School District. Schools are:
- Bagacay Elementary School
- Bolicon Primary School
- Calilic Elementary School
- Calube Elementary School
- Delapa Elementary School
- Kanim Elementary School
- Libay Elementary School
- Magsaysay Elementary School
- Marapong Elementary School
- Minlasag Elementary School
- Oyan Elementary School
- Sibutad Central Elementary School
- Sawang Elementary School
- Sinipay Primary School
- Sipaloc Elementary School
Secondary schools of Sibutad:
- Sibutad National High School (located in Barangay Poblacion)
- Kanim National High School
- Sawang National High School
Notable people
- Most Rev. Severo Caermare, D.D. (b. 1969) - bishop of Dipolog
References
- Municipality of Sibutad | (DILG)
- "Province: Zamboanga del Norte". PSGC Interactive. Quezon City, Philippines: Philippine Statistics Authority. Retrieved 12 November 2016.
- Census of Population (2015). "Region IX (Zamboanga Peninsula)". Total Population by Province, City, Municipality and Barangay. PSA. Retrieved 20 June 2016.
- "PSA releases the 2015 Municipal and City Level Poverty Estimates". Quezon City, Philippines. Retrieved 12 October 2019.
- "Sibutad: Average Temperatures and Rainfall". Meteoblue. Retrieved 30 April 2020.
- Census of Population and Housing (2010). "Region IX (Zamboanga Peninsula)". Total Population by Province, City, Municipality and Barangay. NSO. Retrieved 29 June 2016.
- Censuses of Population (1903–2007). "Region IX (Zamboanga Peninsula)". Table 1. Population Enumerated in Various Censuses by Province/Highly Urbanized City: 1903 to 2007. NSO.
- "Province of Zamboanga del Norte". Municipality Population Data. Local Water Utilities Administration Research Division. Retrieved 17 December 2016.
External links
Places adjacent to Sibutad | ||||||||||
|---|---|---|---|---|---|---|---|---|---|---|
| ||||||||||
Dipolog (capital) | |
| Municipalities | |
| Component cities | |
This article is issued from Wikipedia. The text is licensed under Creative Commons - Attribution - Sharealike. Additional terms may apply for the media files.