Sirawai
Sirawai, officially the Municipality of Sirawai (Cebuano: Lungsod sa Sirawai; Subanen: Benwa Sirawai; Chavacano: Municipalidad de Sirawai; Tagalog: Bayan ng Sirawai), is a 4th class municipality in the province of Zamboanga del Norte, Philippines. According to the 2015 census, it has a population of 28,799 people. [3]
Sirawai | |
|---|---|
| Municipality of Sirawai | |
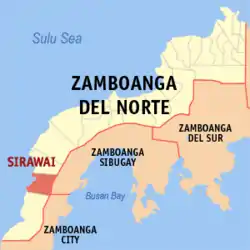 Map of Zamboanga del Norte with Sirawai highlighted | |
OpenStreetMap 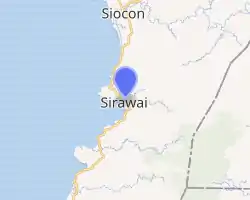
| |
.svg.png.webp) Sirawai Location within the Philippines | |
| Coordinates: 7°35′17″N 122°08′33″E | |
| Country | |
| Region | Zamboanga Peninsula (Region IX) |
| Province | Zamboanga del Norte |
| District | 3rd District |
| Barangays | 34 (see Barangays) |
| Government | |
| • Type | Sangguniang Bayan |
| • Mayor | Gamar A. Janihim |
| • Vice Mayor | Pulman M. Darquez |
| • Representative | Isagani S. Amatong |
| • Electorate | 22,153 voters (2019) |
| Area | |
| • Total | 222.50 km2 (85.91 sq mi) |
| Elevation | 88 m (289 ft) |
| Population | |
| • Total | 28,799 |
| • Density | 130/km2 (340/sq mi) |
| • Households | 5,854 |
| Economy | |
| • Income class | 4th municipal income class |
| • Poverty incidence | 54.37% (2015)[4] |
| • Revenue | ₱87,605,543.25 (2016) |
| Time zone | UTC+8 (PST) |
| ZIP code | 7121 |
| PSGC | |
| IDD : area code | +63 (0)65 |
| Climate type | tropical climate |
| Native languages | Subanon Chavacano Tagalog |
| Website | sirawai |
Barangays
Sirawai is politically subdivided into 34 barangays.
- Balatakan
- Balonkan
- Balubuan
- Bitugan
- Bongon
- Catuyan
- Culasian
- Danganon
- Doña Cecilia
- Guban
- Lagundi
- Libucon
- Lubok
- Macuyon
- Minanga
- Motong
- Napulan
- Panabutan
- Piacan
- Pisa Itom
- Pisa Puti
- Piña
- Pugos
- Pula Bato
- Pulang Lupa
- Saint Mary (Poblacion)
- San Nicolas (Poblacion)
- San Roque (Poblacion)
- San Vicente (Poblacion)
- Sipakit
- Sipawa
- Sirawai Proper (Poblacion)
- Talabiga
- Tapanayan
Climate
| Climate data for Sirawai, Zamboanga del Norte | |||||||||||||
|---|---|---|---|---|---|---|---|---|---|---|---|---|---|
| Month | Jan | Feb | Mar | Apr | May | Jun | Jul | Aug | Sep | Oct | Nov | Dec | Year |
| Average high °C (°F) | 30 (86) |
30 (86) |
31 (88) |
31 (88) |
30 (86) |
29 (84) |
29 (84) |
29 (84) |
29 (84) |
29 (84) |
30 (86) |
30 (86) |
30 (86) |
| Average low °C (°F) | 23 (73) |
23 (73) |
24 (75) |
25 (77) |
25 (77) |
25 (77) |
24 (75) |
24 (75) |
25 (77) |
25 (77) |
24 (75) |
24 (75) |
24 (76) |
| Average precipitation mm (inches) | 98 (3.9) |
78 (3.1) |
116 (4.6) |
115 (4.5) |
222 (8.7) |
281 (11.1) |
272 (10.7) |
282 (11.1) |
237 (9.3) |
258 (10.2) |
180 (7.1) |
108 (4.3) |
2,247 (88.6) |
| Average rainy days | 19.6 | 18.6 | 21.8 | 22.9 | 29.0 | 28.6 | 28.7 | 28.3 | 27.0 | 28.6 | 25.9 | 22.1 | 301.1 |
| Source: Meteoblue [5] | |||||||||||||
Demographics
| Year | Pop. | ±% p.a. |
|---|---|---|
| 1918 | 2,289 | — |
| 1970 | 9,050 | +2.68% |
| 1975 | 9,293 | +0.53% |
| 1980 | 10,662 | +2.79% |
| 1990 | 19,911 | +6.45% |
| 1995 | 22,093 | +1.97% |
| 2000 | 16,534 | −6.02% |
| 2007 | 20,112 | +2.74% |
| 2010 | 24,583 | +7.58% |
| 2015 | 28,799 | +3.06% |
| Source: Philippine Statistics Authority [3] [6] [7][8] | ||
References
- Municipality of Sirawai | (DILG)
- "Province: Zamboanga del Norte". PSGC Interactive. Quezon City, Philippines: Philippine Statistics Authority. Retrieved 12 November 2016.
- Census of Population (2015). "Region IX (Zamboanga Peninsula)". Total Population by Province, City, Municipality and Barangay. PSA. Retrieved 20 June 2016.
- "PSA releases the 2015 Municipal and City Level Poverty Estimates". Quezon City, Philippines. Retrieved 12 October 2019.
- "Sirawai: Average Temperatures and Rainfall". Meteoblue. Retrieved 30 April 2020.
- Census of Population and Housing (2010). "Region IX (Zamboanga Peninsula)". Total Population by Province, City, Municipality and Barangay. NSO. Retrieved 29 June 2016.
- Censuses of Population (1903–2007). "Region IX (Zamboanga Peninsula)". Table 1. Population Enumerated in Various Censuses by Province/Highly Urbanized City: 1903 to 2007. NSO.
- "Province of Zamboanga del Norte". Municipality Population Data. Local Water Utilities Administration Research Division. Retrieved 17 December 2016.
External links
- Sirawai Profile at PhilAtlas.com
- Sirawai Municipality Website
- Philippine Standard Geographic Code
- Philippine Census Information
Places adjacent to Sirawai | |
|---|---|
Dipolog (capital) | |
| Municipalities | |
| Component cities | |
This article is issued from Wikipedia. The text is licensed under Creative Commons - Attribution - Sharealike. Additional terms may apply for the media files.