Sibuco
Sibuco, officially the Municipality of Sibuco, (Cebuano: Lungsod sa Sibuco; Subanen: Benwa Sibuco; Zamboangueño: Municipalidad de Sibuco; Tagalog: Bayan ng Sibuco), is a 1st class municipality in the province of Zamboanga del Norte, Philippines. According to the 2015 census, it has a population of 34,620 people. [3]
Sibuco | |
|---|---|
| Municipality of Sibuco | |
| Nickname(s): Last Frontier of Zamboanga del Norte | |
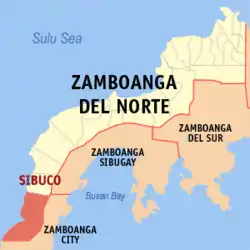 Map of Zamboanga del Norte with Sibuco highlighted | |
OpenStreetMap 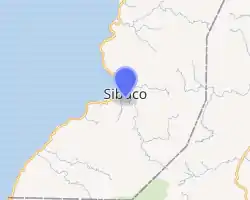
| |
.svg.png.webp) Sibuco Location within the Philippines | |
| Coordinates: 7°17′N 122°04′E | |
| Country | |
| Region | Zamboanga Peninsula (Region IX) |
| Province | Zamboanga del Norte |
| District | 3rd District |
| Barangays | 28 (see Barangays) |
| Government | |
| • Type | Sangguniang Bayan |
| • Mayor | Joel M. Ventura |
| • Vice Mayor | Laurel H. Mahamod |
| • Representative | Isagani S. Amatong |
| • Electorate | 23,467 voters (2019) |
| Area | |
| • Total | 782.54 km2 (302.14 sq mi) |
| Elevation | 183 m (600 ft) |
| Population | |
| • Total | 34,620 |
| • Density | 44/km2 (110/sq mi) |
| • Households | 7,222 |
| Economy | |
| • Income class | 1st municipal income class |
| • Poverty incidence | 67.05% (2015)[4] |
| • Revenue | ₱161,925,407.03 (2016) |
| Time zone | UTC+8 (PST) |
| ZIP code | 7122 |
| PSGC | |
| IDD : area code | +63 (0)65 |
| Climate type | tropical climate |
| Native languages | Northern Subanen Chavacano Cebuano Tagalog Tausug |
| Website | sibuco |
It is also treated like a suburb of neighboring Zamboanga City.
Barangays
Sibuco is politically subdivided into 28 barangays.
Climate
| Climate data for Sibuco, Zamboanga del Norte | |||||||||||||
|---|---|---|---|---|---|---|---|---|---|---|---|---|---|
| Month | Jan | Feb | Mar | Apr | May | Jun | Jul | Aug | Sep | Oct | Nov | Dec | Year |
| Average high °C (°F) | 30 (86) |
30 (86) |
31 (88) |
31 (88) |
30 (86) |
29 (84) |
29 (84) |
29 (84) |
29 (84) |
29 (84) |
30 (86) |
30 (86) |
30 (86) |
| Average low °C (°F) | 23 (73) |
23 (73) |
24 (75) |
25 (77) |
25 (77) |
25 (77) |
24 (75) |
24 (75) |
25 (77) |
25 (77) |
24 (75) |
24 (75) |
24 (76) |
| Average precipitation mm (inches) | 98 (3.9) |
78 (3.1) |
116 (4.6) |
115 (4.5) |
222 (8.7) |
281 (11.1) |
272 (10.7) |
282 (11.1) |
237 (9.3) |
258 (10.2) |
180 (7.1) |
108 (4.3) |
2,247 (88.6) |
| Average rainy days | 19.6 | 18.6 | 21.8 | 22.9 | 29.0 | 28.6 | 28.7 | 28.3 | 27.0 | 28.6 | 25.9 | 22.1 | 301.1 |
| Source: Meteoblue [5] | |||||||||||||
Demographics
| Year | Pop. | ±% p.a. |
|---|---|---|
| 1918 | 3,213 | — |
| 1960 | 6,323 | +1.62% |
| 1970 | 14,257 | +8.46% |
| 1975 | 19,357 | +6.32% |
| 1980 | 21,728 | +2.34% |
| 1990 | 20,839 | −0.42% |
| 1995 | 23,243 | +2.07% |
| 2000 | 24,411 | +1.06% |
| 2007 | 28,101 | +1.96% |
| 2010 | 31,982 | +4.82% |
| 2015 | 34,620 | +1.52% |
| Source: Philippine Statistics Authority [3] [6] [7][8] | ||
References
- Municipality of Sibuco | (DILG)
- "Province: Zamboanga del Norte". PSGC Interactive. Quezon City, Philippines: Philippine Statistics Authority. Retrieved 12 November 2016.
- Census of Population (2015). "Region IX (Zamboanga Peninsula)". Total Population by Province, City, Municipality and Barangay. PSA. Retrieved 20 June 2016.
- "PSA releases the 2015 Municipal and City Level Poverty Estimates". Quezon City, Philippines. Retrieved 12 October 2019.
- "Sibuco: Average Temperatures and Rainfall". Meteoblue. Retrieved 30 April 2020.
- Census of Population and Housing (2010). "Region IX (Zamboanga Peninsula)". Total Population by Province, City, Municipality and Barangay. NSO. Retrieved 29 June 2016.
- Censuses of Population (1903–2007). "Region IX (Zamboanga Peninsula)". Table 1. Population Enumerated in Various Censuses by Province/Highly Urbanized City: 1903 to 2007. NSO.
- "Province of Zamboanga del Norte". Municipality Population Data. Local Water Utilities Administration Research Division. Retrieved 17 December 2016.
External links
Places adjacent to Sibuco | |
|---|---|
Dipolog (capital) | |
| Municipalities | |
| Component cities | |
This article is issued from Wikipedia. The text is licensed under Creative Commons - Attribution - Sharealike. Additional terms may apply for the media files.