Gutalac
Gutalac, officially the Municipality of Gutalac (Cebuano: Lungsod sa Gutalac; Subanen: Benwa Gutalac; Chavacano: Municipalidad de Gutalac; Tagalog: Bayan ng Gutalac), is a 2nd class municipality in the province of Zamboanga del Norte, Philippines. According to the 2015 census, it has a population of 34,654 people. [3]
Gutalac | |
|---|---|
| Municipality of Gutalac | |
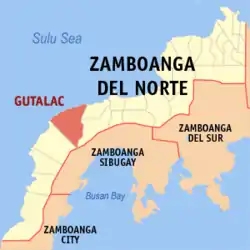 Map of Zamboanga del Norte with Gutalac highlighted | |
OpenStreetMap 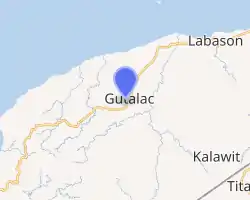
| |
.svg.png.webp) Gutalac Location within the Philippines | |
| Coordinates: 7°59′N 122°24′E | |
| Country | |
| Region | Zamboanga Peninsula (Region IX) |
| Province | Zamboanga del Norte |
| District | 3rd District |
| Barangays | 33 (see Barangays) |
| Government | |
| • Type | Sangguniang Bayan |
| • Mayor | Onesimo L. Coma Jr. |
| • Vice Mayor | Joel R. Tendero |
| • Representative | Isagani S. Amatong |
| • Electorate | 23,130 voters (2019) |
| Area | |
| • Total | 492.86 km2 (190.29 sq mi) |
| Elevation | 130 m (430 ft) |
| Population | |
| • Total | 34,654 |
| • Density | 70/km2 (180/sq mi) |
| • Households | 7,562 |
| Economy | |
| • Income class | 2nd municipal income class |
| • Poverty incidence | 61.4% (2015)[4] |
| • Revenue | ₱72,452,191.08 (2016) |
| Time zone | UTC+8 (PST) |
| ZIP code | 7108 |
| PSGC | |
| IDD : area code | +63 (0)65 |
| Climate type | tropical climate |
| Native languages | Subanon Cebuano Chavacano Tagalog |
| Website | gutalac |
Barangays
Gutalac is politically subdivided into 33 barangays.
- Bacong
- Bagong Silang
- Banganon
- Bayanihan
- Buenavista
- Canupong
- Cocob
- Datagan
- Imelda
- Immaculada Concepcion
- La Libertad
- Loay
- Lower Lux
- Lux
- Malian
- Mamawan
- Map
- Matunoy
- New Dapitan
- Panganuran
- Pitawe
- Pitogo
- Poblacion (Gutalac)
- Salvador
- San Isidro
- San Juan
- San Roque
- San Vicente
- Santo Niño
- Sas
- Sibalic
- Tipan
- Upper Gutalac
Climate
| Climate data for Gutalac, Zamboanga del Norte | |||||||||||||
|---|---|---|---|---|---|---|---|---|---|---|---|---|---|
| Month | Jan | Feb | Mar | Apr | May | Jun | Jul | Aug | Sep | Oct | Nov | Dec | Year |
| Average high °C (°F) | 29 (84) |
29 (84) |
30 (86) |
30 (86) |
29 (84) |
28 (82) |
28 (82) |
28 (82) |
28 (82) |
28 (82) |
28 (82) |
29 (84) |
29 (83) |
| Average low °C (°F) | 22 (72) |
22 (72) |
23 (73) |
24 (75) |
24 (75) |
24 (75) |
23 (73) |
23 (73) |
24 (75) |
24 (75) |
23 (73) |
23 (73) |
23 (74) |
| Average precipitation mm (inches) | 98 (3.9) |
78 (3.1) |
116 (4.6) |
115 (4.5) |
222 (8.7) |
281 (11.1) |
272 (10.7) |
282 (11.1) |
237 (9.3) |
258 (10.2) |
180 (7.1) |
108 (4.3) |
2,247 (88.6) |
| Average rainy days | 19.6 | 18.6 | 21.8 | 22.9 | 29.0 | 28.6 | 28.7 | 28.3 | 27.0 | 28.6 | 25.9 | 22.1 | 301.1 |
| Source: Meteoblue [5] | |||||||||||||
Demographics
| Year | Pop. | ±% p.a. |
|---|---|---|
| 1980 | 10,405 | — |
| 1990 | 17,589 | +5.39% |
| 1995 | 25,022 | +6.83% |
| 2000 | 28,215 | +2.61% |
| 2007 | 29,883 | +0.80% |
| 2010 | 32,153 | +2.70% |
| 2015 | 34,654 | +1.44% |
| Source: Philippine Statistics Authority [3] [6] [7][8] | ||
References
- Municipality of Gutalac | (DILG)
- "Province: Zamboanga del Norte". PSGC Interactive. Quezon City, Philippines: Philippine Statistics Authority. Retrieved 12 November 2016.
- Census of Population (2015). "Region IX (Zamboanga Peninsula)". Total Population by Province, City, Municipality and Barangay. PSA. Retrieved 20 June 2016.
- "PSA releases the 2015 Municipal and City Level Poverty Estimates". Quezon City, Philippines. Retrieved 12 October 2019.
- "Gutalac: Average Temperatures and Rainfall". Meteoblue. Retrieved 30 April 2020.
- Census of Population and Housing (2010). "Region IX (Zamboanga Peninsula)". Total Population by Province, City, Municipality and Barangay. NSO. Retrieved 29 June 2016.
- Censuses of Population (1903–2007). "Region IX (Zamboanga Peninsula)". Table 1. Population Enumerated in Various Censuses by Province/Highly Urbanized City: 1903 to 2007. NSO.
- "Province of Zamboanga del Norte". Municipality Population Data. Local Water Utilities Administration Research Division. Retrieved 17 December 2016.
External links
Places adjacent to Gutalac | |
|---|---|
Dipolog (capital) | |
| Municipalities | |
| Component cities | |
This article is issued from Wikipedia. The text is licensed under Creative Commons - Attribution - Sharealike. Additional terms may apply for the media files.
