Solar power in Texas
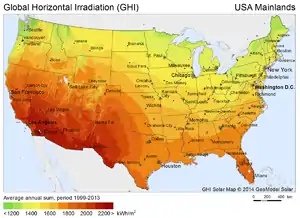
Solar power in Texas, along with wind power, has the potential to allow Texas to remain an energy-exporting state over the long term. The western portion of the state especially has abundant open land areas, with some of the greatest solar and wind potential in the country.[2][3] Development activities there are also encouraged by relatively simple permitting and significant available transmission capacity.[4][5]
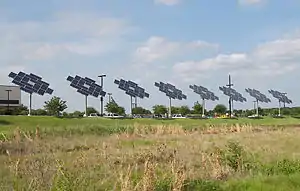
Solar farms
The capacity of large solar farms in Texas has increased substantially in recent years. Facilities sized between 5 and 50 MW began to come online throughout the state between about 2010 and 2015.[6][7][8][9] Since then, progressively larger farms have been constructed in the western counties, with the electricity being contracted by utilities which serve the more populated central and eastern regions.[10][11][12][13] The three largest operating facilities as of 2018 are the 180 MW Upton[10] farm in Upton County, and the 157 MW Roserock[11] and 154 MW Buckthorn[12] farms in Pecos County. Smaller installations by individuals, cooperatives, and businesses are also continuing to add significant capacity, with some of top contractors in the state including Meridian Solar, Longhorn Solar, Axium Solar and Native.[14]
Statistic
Installed capacity
| Grid-Connected PV Capacity (MW)[15][16][17][18][19][20] | |||
|---|---|---|---|
| Year | Capacity | Change | % Change |
| 2007 | 3.2 | ||
| 2008 | 4.4 | 1.2 | 38% |
| 2009 | 8.6 | 4.2 | 95% |
| 2010 | 34.5 | 25.9 | 301% |
| 2011 | 85.6 | 51.1 | 148% |
| 2012 | 140.3 | 54.7 | 64% |
| 2013 | 215.9 | 75.6 | 54% |
| 2014 | 387 | 129 | 79% |
| 2015 | 594 | 207 | 53% |
| 2016 | 1,269 | 675 | 113% |
| 2017 | 1,982 | 713 | 56% |
| 2018 | 2,925 | 943 | 48% |
| 2019 | 4,324.3 | 1,399.3 | 48% |
Utility-scale
Using data available from the U.S. Energy Information Agency's Electric Power Annual 2017[21] and "Electric Power Monthly Data Browser",[22][23][24][25] the following table summarizes Texas's solar energy posture.

Capacity factor for each year was computed from the end-of-year summer capacity. 2018 data is from Electric Power Monthly and is subject to change.
| Year | Facilities | Summer capacity (MW) | Electric energy (GWh or M kWh) | Capacity factor | Yearly growth of generating capacity | Yearly growth of produced energy | % of TX renewable electric energy | % of TX generated electric energy | % of U.S. Solar electric energy |
|---|---|---|---|---|---|---|---|---|---|
| 2018 | 52 | 1948.2 | 3348 | 0.196 | 57.1% | 52.9% | 4.1% | 0.70% | 5.0% |
| 2017 | 39 | 1240.2 | 2189 | 0.201 | 114% | 199% | 3.0% | 0.48% | 4.1% |
| 2016 | 578.9 | 731 | 0.144 | 82% | 1.2% | 32.9% | 0.16% | 2.0% | |
| 2015 | 317.9 | 401 | 0.144 | 71% | 42% | 0.8% | 0.09% | 1.6% | |
| 2014 | 185.7 | 282 | 0.173 | 73% | 0.70% | 0.06% | 1.5% | ||
Distributed
Beginning with the 2014 data year, the Energy Information Administration (EIA) has estimated the distributed solar generation and distributed solar capacity.[26] These non-utility-scale appraisals evaluate that Texas generated the following amounts of additional solar energy:
| Year | Summer capacity (MW) | Electric energy (GWh or M kWh) |
|---|---|---|
| 2018 | 474.7 | 715 |
| 2017 | 309.1 | 476 |
| 2016 | 277.1 | 391 |
| 2015 | 147.2 | 223 |
| 2014 | 96 | 141 |
Potential
Covering half of the roof with 10% efficient photovoltaics is sufficient to generate all of the electricity used by an average family in Texas. Solar farms are more cost effective in West Texas, where insolation levels are greater.[28] The US uses about 100 quadrillion British thermal units (29,000 TWh) of energy each year.[29] This number is expected to be reduced by 50% by 2050, due to efficiency increases.[30] Texas has the potential to generate 22,787 TWh/year, more than any other state, from 7.743 TW of concentrated solar power plants, using 34% of Texas,[31] and 131.2 TWh/year from 97.8 GW of rooftop photovoltaic panels, 34.6% of the electricity used in the state in 2013.[32] The 1,310-megawatt Samson Solar farm is under construction in northeastern Texas.[33]
Texas electricity consumption in 2010 was 358.458 TWh, more than any other state, and 9.5% of the US total.[34]
References
- Output data
- "A State-By-State View Of U.S. Renewable Energy In 2017". solarindustrymag.com. Retrieved 7 February 2019.
- "Comparison of Solar Power Potential by State". neo.ne.gov. Retrieved 7 February 2019.
- "Is a Solar Development Boom About to Begin in Texas?". greentechmedia.com. Retrieved 7 February 2019.
- Accounts, Texas Comptroller of Public. "State Energy Conservation Office". www.seco.cpa.state.tx.us. Retrieved 23 April 2018.
- , OCI Solar Power
- "City of Austin Activates Largest Texas Solar Farm - CleanTechnica". cleantechnica.com. Retrieved 23 April 2018.
- "FAQ". cpsenergy.com. Archived from the original on 9 November 2013. Retrieved 23 April 2018.
- "Blue Wing Solar Farm". juwisolar.com. Archived from the original on 26 April 2012. Retrieved 23 April 2018.
- Upton Solar, Vistra Energy, 2018
- Roserock Solar, Recurrent Energy, 2016
- Georgetown’s energy 100 percent renewable with solar plant, georgetown.org, June, 2018
- Midway Solar, 174 Power Global, 2018
- "The Solar Power World Top 250: The Top Solar Contractors In Texas". www.solarpowerworldonline.com. Retrieved 23 April 2018.
- Sherwood, Larry (August 2012). "U.S. Solar Market Trends 2011" (PDF). Interstate Renewable Energy Council (IREC). p. 17. Archived from the original (PDF) on 2012-09-06. Retrieved 2012-08-16.
- Sherwood, Larry (June 2011). "U.S. Solar Market Trends 2010" (PDF). Interstate Renewable Energy Council (IREC). Retrieved 2011-06-29.
- Sherwood, Larry (July 2010). "U.S. Solar Market Trends 2009" (PDF). Interstate Renewable Energy Council (IREC). Archived from the original (PDF) on 2010-09-25. Retrieved 2010-07-28.
- Sherwood, Larry (July 2009). "U.S. Solar Market Trends 2008" (PDF). Interstate Renewable Energy Council (IREC). p. 16. Archived from the original (PDF) on 2009-11-23. Retrieved 2010-07-24.
- Sherwood, Larry (July 2012). "U.S. Solar Market Trends 2012" (PDF). Interstate Renewable Energy Council (IREC). p. 16. Retrieved 2013-10-11.
- "Texas Solar". SEIA. Retrieved 2016-04-23.
- "Electric Power Annual State Data" 1990-2017 Existing Name Plate and Summer Capacity by Energy Source and State retrieved 2019-3-17
- "Electric Power Monthly Data Browser" Table 1.17B retrieved 2019-3-15
- "Electric Power Monthly Data Browser " Report 1.14 retrieved 2017-6-17
- "Electric Power Monthly Data Browser " Report 1.13 retrieved 2017-6-17
- "Electric Power Monthly Data Browser " Report 1.6 retrieved 2019-3-17
- "Electric Power Annual" retrieved 2017 6 17
- "Electric Power Monthly" retrieved 2019 3 12
- "Texas' renewable energy resources". infinitepower.org. Archived from the original on 8 April 2012. Retrieved 23 April 2018.
- "US Energy Consumption". wilcoxen.maxwell.insightworks.com. Retrieved 23 April 2018.
- Makhijani, Arjun Carbon-Free and Nuclear-Free, A Roadmap for U.S. Energy Policy 2007 ISBN 978-1-57143-173-8
- "Renewable Energy Technical Potential". nrel.gov. Archived from the original on 15 September 2012. Retrieved 23 April 2018.
- "Rooftop Solar Photovoltaic Technical Potential in the United States: A Detailed Assessment" (PDF). nrel.gov. Retrieved 23 April 2018.
- Lewis, Michelle (20 November 2020). "Texas will host the largest solar project in the US". Electrek.
- Office of Energy Efficiency and Renewable Energy (2015-03-12). "Electric Power and Renewable Energy in Texas". United States Department of Energy. Retrieved 2016-04-25.
External links
| Wikimedia Commons has media related to Solar power in Texas. |