Energy in California
Energy in California is a major area of the economy of California. California is the state with the largest population and the largest economy in the United States. However, it is second in energy consumption[2] after Texas.[3] As of 2018, per capita consumption was the fourth-lowest in the United States partially because of the mild climate and energy efficiency programs.[4]

Energy consumption in California is dominated by transportation, due to high number of motor vehicles and long commutes. California also is responsible for about 20% of total jet fuel consumption in the United States. The second largest energy sector is industry. Energy consumption of the state's residential sector per capita is lower than that of any other state except Hawaii thanks to relatively mild climate.[5]
California has large energy resources, being among the top producers of oil, hydroelectricity, solar, biomass, and geothermal energy in the United States.
Electricity
Natural gas-fired power plants typically account for almost one-half of in-state electricity generation. California is one of the largest hydroelectric power producers in the United States, and with adequate rainfall, hydroelectric power typically accounts for close to one-fifth of State electricity generation. Due to strict emission laws only one coal-fired power plant remains operating in California, the 63-megawatt Argus Cogeneration Plant in Trona (San Bernardino County).[6]
California's peak electricity demand occurred on July 24, 2006, at 2:44 pm, with 50,270 megawatts. Since then measures to reduce peak load have resulted in decreased peak demand, even as the state's population has continued to grow.[7] On September 1 2017, the peak load was 50,116 MW.[8]
Although California's population increased by 13% during the 1990s, the state did not build any new major power plants during that time, although existing in-state power plants were expanded and power output was increased nearly 30% from 1990 to 2001. However, between 2000 and 2015, California built nearly 500 new power plants to supplement the 700 operating in 2000, boosting power supplies by 43%.[9]
In 2016, California Public Utilities Commission (CPUC) announced new rules for connecting coming generation sources to grid. Connection costs must be estimated by the utility, and the developer is limited to paying within ±25% change of the estimate. CPUC expects the rules to lower overall costs for ratepayers.[10][11][12] California requires 1.3 GW of utility storage[13] and studies long duration bulk energy storage. The state allocates US$83 million per year during 2017-2019 for behind-the-meter storage.[14] The plan was amended in 2020 to a combined $613 million by 2024.[15]
California's electricity rates are among the highest in the United States as a result of the changing energy mix within the state, including aggressive construction of new natural gas power plants.[9] As of 2016 California's electricity costs were 17.4 cents per kWh for residential customers and 14.8 cents per kWh for commercial.[16] Due to high electricity demand, California imports more electricity than any other state,[17] (32% of its consumption in 2018[1]) primarily wind and hydroelectric power from states in the Pacific Northwest (via Path 15 and Path 66) and nuclear, coal, and natural gas-fired production from the desert Southwest via Path 46.[18] Imported coal-fired electricity is expected to decline as power agreements expire and the city of Los Angeles phases out its use of such electricity by 2025.[19][20] In 2018, curtailment was 460 GWh, or 0.2% of generation,[21] but increased since.[22][23]
In August 2020, during a heat wave which affected the entire West coast, air conditioning usage caused the peak load to hit 47 GW, and CAISO issued rolling blackouts to avoid a larger system shutdown. The state did not have enough generation ready to fulfill demand, and it was unable to import sufficient electricity from neighboring states who had no surplus themselves.[24][25] A 4 GW demand reduction alleviated the grid in the days after the blackouts.[26][27]
Transmission grid
The electric grid is made of up electric transmission and electric distribution, with electric production by itself averaging about 44% of the cost nationally.[28] As of 2019, transmission costs are the fastest-growing part of the bill, and Transmission Access Charges (TAC) are applied regardless of how far electricity travels across the grid.[29]
California is part of the Western Interconnection, with transmission lines connecting to the Pacific Northwest including the California Oregon Intertie (with a capacity of almost 5 GW) as well as the Pacific DC Intertie, an HVDC line with a capacity of 3.1 GW which brings (predominantly hydroelectric) power from the Pacific Northwest to the Los Angeles area. From Utah, another HVDC line, Path 27, provides coal generated electricity to Los Angeles. From the Southeast, Path 46 brings up to 10.6 GW of electricity from sources including hydroelectric, fossil fuels, nuclear, and solar from generating stations in Nevada and Arizona.
Transmission lines under construction as of 2019 include the TransWest Express, which would connect Wyoming to Nevada, which is already connected to Southern California via Path 46.
While experts have stated that more grid connections to other states would allow California to export its excess solar and wind generated electricity to other states during sunny times of the day, and to import wind generated electricity when wind is blowing in other Western states but not in California, the legislature has resisted allowing more connections for fear of losing sovereignty over the state's electricity supply.[30][31][32]
Generation
As of 2018, California had 80 GW of installed generation capacity encompassing more than 1,500 power plants; with 41 GW of natural gas, 26.5 GW of renewable (12 GW solar, 6 GW wind), 12 GW large hydroelectric, and 2.4 GW nuclear.[1]:1
Legal renewables requirement
In 2006, the California legislature passed the Global Warming Solutions Act of 2006 which set a goal for 33% of electricity consumption in California to be generated by renewable sources by 2020.[33]
In 2015, SB350 mandated that electric utilities purchase 50% of their electricity from renewable sources by 2030.[34]
Then in 2018, Senate Bill 100 was passed which increased the renewables requirement for electric utilities to 50% by 2026, 60% by 2030, and 100% by 2045.[35]
Natural Gas
As of 2019, California natural gas plants supplied a third of the state's total demand for electricity, (almost half of the state's in-state generation[1]) and supply the state with 41,000 megawatts of installed capacity.[36] Because renewables cannot generate power 24/7, and it is cost prohibitive to install enough solar panels, wind turbines and batteries to supply sufficient electricity to ensure "resource adequacy" during extended cloudy or windless periods, researchers have estimated that the state will still need between 17,000 and 35,000 megawatts of natural gas fueled generation in 2050.[37][36]:1
Renewables
California leads the nation in electricity generation from non-hydroelectric renewable energy sources, including geothermal power, wind power, and solar power. California has some of the most aggressive renewable energy goals in the United States.[38] The state is required to obtain at least 33% of its electricity from renewable resources by 2020, and 50% by 2030, excluding large hydro.[39][40] On May 13, 2017, the California Independent System Operator (ISO) reported that the state had broken a new instantaneous renewable energy record, with non-hydro renewables providing 67.2% of the total electricity on the ISO's grid, with another 13.5% being provided by hydro.[41] Intermittent solar power has led to a peak demand and peak production imbalance creating a "duck curve", where traditional power plants produce little generation at noon, ramping fast to high generation at dusk.[21]
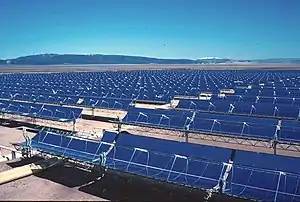
Solar Energy Generating Systems (SEGS) is the name given to nine solar power plants in the Mojave Desert which were built in the 1980s. These plants have a combined capacity of 354 megawatts (MW) making them at one time the largest solar power installation in the world.[42] Other large solar plants in the Mojave Desert include the 392 MW Ivanpah Solar Power Facility,[43] opened in 2014, and the 550 MW Desert Sunlight Solar Farm and 579 MW Solar Star, both completed in 2015. The Beacon Solar Project, which generates 250 MW for the LADWP, was completed in 2017 in the northwestern Mojave Desert.[44]
The Alta Wind Energy Center in the Tehachapi Mountains is the largest wind power plant in the United States with 1,548 MW installed capacity.[45] A facility known as "The Geysers," located in the Mayacamas Mountains north of San Francisco, is the largest group of geothermal power plants in the world, with more than 750 MW of installed capacity. California's hydroelectric power potential ranks second in the United States (behind Washington State), and substantial geothermal and wind power resources are found along the coastal mountain ranges and the eastern border with Nevada. High solar power potential is found in southeastern California's deserts.
Energy storage
California has several large pumped-storage hydroelectric powerplants.
|Assembly Bill 2514 directed the California Public Utilities Commission (CPUC) to adopt an energy storage program and procurement target.[46] As a result, the CPUC established an energy storage target of 1,325 MW by 2020.[47] In 2014, Southern California Edison commissioned the Tehachapi Energy Storage Project, which was the largest lithium-ion battery system operating in North America and one of the largest in the world at the time of commissioning.[48][49] The 1-hour 230 MW Gateway Energy Storage project near San Diego became the biggest Lithium-ion grid storage in 2020.[50]
Nuclear
California's single remaining operational nuclear power plant, Diablo Canyon Power Plant, accounts for less than one-tenth of total generation. California used to have multiple other nuclear power plants, including the Rancho Seco Nuclear Generating Station, the San Onofre Nuclear Generating Station, the Vallecitos Nuclear Center,[51] and the Humboldt Bay Nuclear Power Plant,[52] in addition to various other smaller experimental or prototype reactors which intermittently supplied power to the grid, such as the Sodium Reactor Experiment. However all of these reactors have been shut down due to both economic[53] and social[54] factors. Currently, the owner of the Diablo Canyon plant, Pacific Gas & Electric, has plans to shut down the two reactors at the site in 2025.[55] The plant produces about 18 TWh per year.[56]
The 3937 MW Palo Verde Nuclear Generating Station in Tonopah, Arizona exports power to California via Path 46 and is over 27% owned by California utility companies.
Hydroelectric
- California has several large conventional and pumped-storage hydroelectric powerplants.
- California receives 55.9% of the power generated by the Hoover Dam, on the Arizona/Nevada border, about 2236.38 GW⋅h on average.[57]
Coal
- The 63 MW Argus Cogeneration Plant in San Bernardino County is the only coal-fired power station still operating within the state of California.
- The 1,900 MW Intermountain Power Plant in Delta, Utah is operated by the Los Angeles Department of Water and Power. Power is transmitted to California via Path 27.
- The 1,540 MW Four Corners Generating Station in the San Juan County, New Mexico is 19.2% owned by Southern California Edison.
Regulatory policy
The California Energy Commission is the primary energy policy and planning agency. As of 2017, California is a deregulated electricity market.[58] It has a number of electric load-serving entities, including as of 2015 six investor-owned utilities (IOU), 46 publicly owned utilities, 4 electric cooperatives, 3 community choice aggregators, and 22 electric service providers.[58] Major investor-owned utilities, regulated by the California Public Utilities Commission, include Southern California Edison, Pacific Gas & Electric, and San Diego Gas & Electric.[59] The remaining 3 IOUs are Pacificorp, Bear Valley Electric, and Liberty Utilities.[60]
California has a regional transmission organization called CAISO covering its state, but is not merged with the rest of the Western United States; merging has been a major policy discussion with proposals considered in 2017 and 2018.[61]
California's investor-owned utilities were transitioning to time-of-use pricing, with SD&E slated to roll it out in 2019 and the others rolling it out in 2020.[62]
Electricity system data
As of 2018, 31.7% of electricity was imported out of which 33.2% was of unspecified origin and 29.2% were renewables.
| Year | Natural gas | Total Renewables | Solar | Wind | Small hydro | Geothermal | Biomass | Large hydro | Coal | Nuclear | Unspecified | Imported | References |
|---|---|---|---|---|---|---|---|---|---|---|---|---|---|
| 2009 | 42.0% | 12.0% | 0.3% | 3.1% | 1.7% | 4.6% | 2.3% | 9.1% | 8.1% | 13.1% | 15.7% | ||
| 2010 | 41.9% | 13.9% | 0.3% | 4.7% | 1.9% | 4.6% | 2.4% | 10.5% | 7.7% | 13.9% | 12.0% | ||
| 2011 | 35.3% | 14.1% | 0.4% | 5.0% | 2.1% | 4.5% | 2.1% | 13.0% | 8.2% | 15.2% | 14.2% | ||
| 2012 | 43.4% | 15.4% | 0.9% | 6.3% | 1.5% | 4.4% | 2.3% | 8.3% | 7.5% | 9.0% | 16.4% | ||
| 2013 | 44.3% | 18.8% | 1.8% | 8.6% | 1.3% | 4.5% | 2.7% | 7.8% | 7.8% | 8.8% | 12.5% | ||
| 2014 | 44.5% | 20.1% | 4.2% | 8.1% | 1.0% | 4.4% | 2.5% | 5.4% | 6.4% | 8.5% | 15.0% | 32.9% | [63] |
| 2015 | 44.0% | 21.9% | 6.0% | 8.2% | 0.9% | 4.4% | 2.6% | 5.4% | 6.0% | 9.2% | 13.5% | 33.6% | [64] |
| 2016 | 36.5% | 25.5% | 8.1% | 9.1% | 1.7% | 4.4% | 2.3% | 10.2% | 4.1% | 9.2% | 14.4% | 31.8% | [65] |
| 2017 | 33.7% | 29.0% | 10.2% | 9.4% | 2.7% | 4.4% | 2.4% | 14.7% | 4.1% | 9.1% | 9.3% | 29.3% | [66] |
| 2018 | 34.9% | 31.4% | 11.4% | 11.5% | 1.6% | 4.5% | 2.4% | 10.7% | 3.3% | 9.1% | 10.5% | 31.8% | [67] |
| 2019 | 34.2% | 31.7% | 12.3% | 10.2% | 2.0% | 4.8% | 2.4% | 14.6% | 3.0% | 9.0% | 7.3% | 27.8% | [68] |
| Year | Wind | Solar | Small hydro | Geothermal | Biomass | Large hydro | Coal | Nuclear | Natural gas | Renewable |
|---|---|---|---|---|---|---|---|---|---|---|
| 2009 | 3.0% | 0.4% | 2.0% | 6.2% | 2.9% | 12.1% | 1.8% | 15.2% | 56.3% | 14.5% |
| 2010 | 3.0% | 0.4% | 2.4% | 6.2% | 2.8% | 14.3% | 1.7% | 15.7% | 53.4% | 14.9% |
| 2011 | 3.8% | 0.5% | 3.1% | 6.3% | 2.9% | 18.2% | 1.6% | 18.2% | 45.4% | 16.6% |
| 2012 | 4.6% | 0.9% | 2.1% | 6.4% | 3.0% | 11.7% | 0.8% | 9.3% | 61.1% | 17.1% |
| 2013 | 6.4% | 2.2% | 1.7% | 6.3% | 3.2% | 10.4% | 0.5% | 9.0% | 60.5% | 19.6% |
| 2014 | 6.5% | 5.3% | 1.2% | 6.1% | 3.4% | 7.1% | 0.5% | 8.6% | 61.3% | 22.8% |
| 2015 | 6.2% | 7.7% | 1.2% | 6.1% | 3.2% | 5.9% | 0.3% | 9.5% | 59.9% | 24.5% |
| 2016 | 6.8% | 10.0% | 2.3% | 5.8% | 3.0% | 12.3% | 0.2% | 9.6% | 49.9% | 27.9% |
| 2017 | 6.2% | 11.8% | 3.1% | 5.7% | 2.8% | 17.9% | 0.2% | 8.7% | 43.4% | 29.7% |
| 2018 | 7.2% | 14% | 2.1% | 5.9% | 3.0% | 11.3% | 0.15% | 9.4% | 46.5% | 32.3% |
| Year | Wind | Solar | Small hydro | Geothermal | Biomass | Large hydro | Coal | Nuclear | Natural gas | Total |
|---|---|---|---|---|---|---|---|---|---|---|
| 2002 | 3.5 | 0.9 | 4.4 | 13.9 | 7.1 | 26.9 | 27.6 | 34.4 | 90.9 | 209.7 |
| 2003 | 3.5 | 0.8 | 5.1 | 13.8 | 5.6 | 30.9 | 27.2 | 35.6 | 92.4 | 214.8 |
| 2004 | 4.3 | 0.7 | 4.7 | 14.0 | 5.9 | 29.7 | 28.6 | 30.2 | 105.0 | 223.1 |
| 2005 | 4.4 | 0.7 | 5.4 | 14.4 | 6.0 | 34.5 | 28.1 | 36.2 | 96.1 | 225.8 |
| 2006 | 4.9 | 0.6 | 5.8 | 13.5 | 5.7 | 43.1 | 17.6 | 32.0 | 107.0 | 230.1 |
| 2007 | 5.7 | 0.7 | 3.7 | 13.0 | 5.4 | 23.3 | 4.2 | 35.7 | 118.3 | 209.9 |
| 2008 | 5.7 | 0.7 | 3.7 | 12.9 | 5.7 | 21.0 | 4.0 | 32.5 | 122.2 | 208.5 |
| 2009 | 6.3 | 0.9 | 4.0 | 12.9 | 5.9 | 25.1 | 3.7 | 31.5 | 116.7 | 207.2 |
| 2010 | 6.2 | 0.9 | 5.0 | 12.7 | 5.8 | 29.3 | 3.4 | 32.2 | 109.8 | 205.4 |
| 2011 | 7.6 | 1.1 | 6.1 | 12.7 | 5.8 | 36.6 | 3.1 | 36.7 | 91.2 | 200.9 |
| 2012 | 9.2 | 1.8 | 4.3 | 12.7 | 6.0 | 23.2 | 1.6 | 18.5 | 121.7 | 199.1 |
| 2013 | 12.7 | 4.3 | 3.3 | 12.5 | 6.4 | 20.8 | 1.0 | 17.9 | 120.9 | 199.8 |
| 2014 | 13.1 | 10.6 | 2.7 | 12.2 | 6.8 | 13.7 | 1.0 | 17.0 | 122.0 | 199.2 |
| 2015 | 12.2 | 15.0 | 2.4 | 12.0 | 6.4 | 11.6 | 0.5 | 18.5 | 117.5 | 196.5 |
| 2016 | 13.5 | 19.8 | 4.6 | 11.6 | 5.9 | 24.2 | 0.3 | 18.9 | 98.8 | 198.2 |
| 2017 | 12.9 | 24.3 | 6.4 | 11.7 | 5.8 | 36.9 | 0.3 | 17.9 | 89.6 | 206.3 |
| 2018 | 14.0 | 27.3 | 4.2 | 11.5 | 5.9 | 22.1 | 0.3 | 18.3 | 90.7 | 194.8 |
Petroleum production
| Year | Gallons | m3 | Change |
|---|---|---|---|
| 2000 | 14,544,627,116 | 55.1×10⁶ | |
| 2001 | 15,117,143,010 | 57.2×10⁶ | +3.9% |
| 2002 | 15,513,415,849 | 58.7×10⁶ | +2.6% |
| 2003 | 15,661,671,712 | 59.3×10⁶ | +1.0% |
| 2004 | 15,908,278,251 | 60.2×10⁶ | +1.6% |
| 2005 | 15,937,855,020 | 60.3×10⁶ | +0.2% |
| 2006 | 15,825,386,719 | 59.9×10⁶ | −0.7% |
| 2007 | 15,672,334,029 | 59.3×10⁶ | −1.0% |
| 2008 | 15,032,229,963 | 56.9×10⁶ | −4.1% |
| 2009 | 14,811,281,527 | 56.1×10⁶ | −1.5% |
| 2010 | 14,868,892,787 | 56.3×10⁶ | +0.4% |
| 2011 | 14,600,133,763 | 55.3×10⁶ | −1.8% |
| 2012 | 14,504,794,174 | 54.9×10⁶ | −0.7% |
| 2013 | 14,532,944,431 | 55.0×10⁶ | +0.2% |
| 2014 | 14,702,632,422 | 55.7×10⁶ | +1.2% |
| 2015 | 15,105,348,840 | 57.2×10⁶ | +2.7% |
| 2016 | 15,487,956,872 | 58.6×10⁶ | +2.5% |
California's crude oil and natural gas deposits are located in six geological basins in the Central Valley and along the coast. California has more than a dozen of the United States' largest oil fields, including the Midway-Sunset Oil Field, the second largest oil field in the contiguous United States.
As of 2012, California's crude oil output accounted for about 8.3% of total U.S. production.[72] Drilling operations are concentrated primarily in Kern County and the Los Angeles basin.[72] With twenty seven platforms along the coast as of 2020, there is substantial offshore oil and gas production.[73] There is a permanent moratorium on new offshore oil and gas leasing in California waters and a deferral of leasing in Federal waters.
California ranks third in the United States in petroleum refining capacity, behind Texas and Louisiana, and accounts for about 11% of total U.S. capacity, as of 2012.[72] In addition to oil from California, California's refineries process crude oil from Alaska and foreign suppliers. The refineries are configured to produce cleaner fuels, including reformulated motor gasoline and low-sulfur diesel, to meet strict Federal and State environmental regulations. As of 2017, California has 18 refineries with a capacity to process nearly 2,000,000 US barrels (240,000 m3) per day.[74][75]
Transportation
Transportation is a major use of energy, driven in part by long commuting distances.[76] In 2017, transportation accounted for 40% of total energy use,[77] and in 2015, transportation was estimated to be the largest source of greenhouse gas emissions.[78]
Gasoline consumption fluctuates with economic conditions and gas prices, but has generally remained flat since 2000, despite increasing population.[79] In 2017, Texas surpassed California in gasoline consumption, despite California having 6 million more vehicles.[80] Most California motorists are required to use a special motor gasoline blend called California Clean Burning Gasoline (CA CBG).[81] By 2004, California completed a transition from methyl tertiary butyl-ether (MTBE) to ethanol as a gasoline oxygenate additive, making California the largest ethanol fuel market in the United States. There are four ethanol production plants in central and southern California, but most of California's ethanol supply is transported from other states or abroad.
As of 2018, California is a leader in the United States in electric vehicles.[82] California has the second highest rate of plug-in cars in the world, trailing behind Norway, and making up half of the electric car market in the US. The Alternative and Renewable Fuel and Vehicle Technology Program,[83] also called the Clean Transportation Program, arose out of 2007 law and is intended to drive growth in electric vehicles.[84] California faces a potential shortage in charging stations,[85] and setup California Electric Vehicle Infrastructure Project (CALeVIP) program to build more chargers.[86] In September 2020, California Gov. Gavin Newsom issued an executive order requiring all passenger cars and trucks (not delivery, long-haul, or construction vehicles) sold after 2035 be fully electric.[87] Experts have estimated that this will increase California's consumption of electric energy by 25%.[88] California operates Vehicle-to-grid (V2G) programs to let electric vehicles supply power to the grid when feasible, and to increase consumption when supply is ample. As of 2020, California's EVs have a combined charging capacity of 4.67 GW.[89][24][90]
Building energy
Buildings use energy for lighting, heating, ventilation, and air conditioning (HVAC) systems, escalators, elevators and water heating. In addition, municipalities pump water which requires energy; by one estimate, about 19% of electricity is used to treat, pump, and discharge water.[91]
The California Building Standards Code has targeted residential energy efficiency since 1978;[92] Part 11 of the code is the California Green Building Standards Code.
Natural gas
California natural gas production typically is less than 2 percent of total annual U.S. production and satisfies less than one-sixth of state demand.[93][94] California receives most of its natural gas by pipeline from production regions in the Rocky Mountains, the Southwest, and western Canada.[94] Some of this is seasonally stored in the Aliso Canyon Oil Field, and its 2015 leak caused California to install grid batteries to compensate.[95]
Sustainable
California has led the United States from 2010 to 2013 with its sustainable energy plans (also known as "clean energy"), with Clean Edge's Clean Energy Index for 2013 rating it at 91.7, with the second ranked state being Massachusetts, at 77.8, and Mississippi the lowest at 4.2. California is the only state with extensive deployment of wind, solar, and geothermal energy. California's venture capital investments in sustainable energy are greater than the other 49 states combined, at $2.2 billion in 2012.[96] In August 2018, California's legislature passed legislation that mandates completely carbon-free electricity generation by 2045.[97][98]
Energy-efficient lighting regulations
In September 2019, the Energy Department announced the reversal of a 2014 regulation that would have taken effect on January 1, 2020 and implemented the last round of energy-saving light bulb regulations outlined by the Energy Independence and Security Act of 2007.[99][100] The ruling would allow some types of incandescent bulbs to remain in service. California, along with Colorado, Nevada, Washington, and Vermont, adopted its own energy standards.[101] The California regulations were challenged in court by light bulb manufacturers but a judge ruled it was proper under the congressional exemption previously granted.[102]
See also
References
- "2018 Total System Electric Generation". California Energy Commission. Retrieved 2020-08-27.
Source: CEC-1304 Power Plant Owners Reporting Form and SB 1305 Reporting Regulations. In-state generation is reported generation from units one megawatt and larger. Data as of June 24, 2019 ... In 2018, total generation for California was 285,488 gigawatt-hours (GWh), ... in-state generation dropped by 6 percent (11,494 GWh) to 194,842 GWh. ... Net imports increased by 6 percent (4,944 GWh) to 90,648 GWh,
- "California - State Energy Profile Overview - U.S. Energy Information Administration (EIA)". www.eia.gov. Retrieved 2021-01-06.
- "Texas - State Energy Profile Overview - U.S. Energy Information Administration (EIA)". www.eia.gov. Retrieved 2021-01-06.
- "California - Profile Overview". Energy Information Administration. 2020-01-16. Retrieved 2020-09-01.
California's total energy consumption is second-highest in the nation, but, in 2018, the state's per capita energy consumption was the fourth-lowest, due in part to its mild climate and its energy efficiency programs.
- "California, State Energy Profile". Official Energy Statistics from the U.S. Government. Energy Information Administration. Archived from the original on 2010-12-29. Retrieved 2007-10-02.
- Nikolewski, Rob (20 January 2020). "Closing coal power plants has saved thousands of lives, study says". Los Angeles Times. Retrieved 17 August 2020.
- Martinez, Sierra (November 1, 2011). "California Is Making History by Eliminating Its Growth in Peak Demand". Natural Resources Defense Council.
- "California ISO Peak Load History" (PDF). Caiso.com. Retrieved 22 June 2018.
- Penn, Ivan; Menezes, Ryan (February 5, 2017). "A runaway energy industry is costing California billions". Los Angeles Times.
- "New California Interconnection Ruling Increases Transparency and Limits Costs". Greentechmedia.com. Retrieved 14 August 2016.
- "How California Created a New System for Determining the Costs of Grid Connection". Greentechmedia.com. Retrieved 14 August 2016.
- "Archived copy" (PDF). Archived from the original (PDF) on 2016-08-28. Retrieved 2016-08-14.CS1 maint: archived copy as title (link)
- "AB-2868 Energy storage. (2015-2016)". Leginfo.legislaturte.ca.gov. Retrieved 14 October 2016.
- California Ramps Up Energy Storage Plans with Enactment of Four New Bills September 28, 2016
- John, Jeff St (21 January 2020). "California Finalizes Plan Shifting Key Energy Storage Incentive Toward Blackout Resilience". www.greentechmedia.com.
- The Opportunity of Energy Group-Buying EnPowered, April 18, 2016,
- "California imports the most electricity from other states; Pennsylvania exports the most". Energy Information Administration. 2019-04-04. Retrieved 2020-09-02.
From 2013 to 2017, Pennsylvania was the largest net exporter of electricity, sending an annual average of 58 million megawatthours (MWh) outside the state. California was the largest net importer, receiving an average of 89 million MWh annually.
- "California - State Energy Profile Overview - U.S. Energy Information Administration (EIA)". Tonto.eia.doe.gov. Archived from the original on 29 December 2010. Retrieved 6 November 2017.
- Peterson, Molly (February 26, 2013). "Los Angeles to end use of coal by 2025, says Mayor Antonio Villaraigosa". Southern California Public Radio.
- "Current and Expected Energy From Coal for California" (PDF). California Energy Commission. November 3, 2016.
- Victor, David G. (21 May 2019). "Pumped Energy Storage: Vital to California's Renewable Energy Future" (PDF). p. 4, 12-15.
- Specht, Mark (25 June 2019). "Renewable Energy Curtailment 101: The Problem That's Actually Not a Problem At All". Union of Concerned Scientists. Archived from the original on 1 September 2020.
In most cases, it simply does not make economic sense to build all the infrastructure (e.g. transmission lines or energy storage) that would be required to utilize every last drop of renewable electricity
- "California ISO - Managing Oversupply". www.caiso.com. Archived from the original on 14 October 2020.
- Hiltzik, Michael (1 October 2020). "Column: Will California have enough electricity for all its EVs? Yes — but it will take work". Los Angeles Times. Archived from the original on 15 October 2020.
"experts say the rare confluence of circumstances that caused those outages don’t have anything to do with" {EV expansion}. The outages the California ISO ordered during a heat wave Aug. 14 and 15 were the product of an unusual combination of circumstances. These included the unexpected shutdown of a natural gas-fueled generating plant, an unexpected delay in returning a second plant to service, smoke from wildfires that reduced the generating capacity of solar units, and the regional nature of the heat wave, which increased air conditioner use in states that ordinarily would be exporting electricity to California.
- "Preliminary Root Cause Analysis Rotating Outages August 2020.pdf" (PDF). CAISO. Archived (PDF) from the original on 12 October 2020.
- Balaraman, Kavya (22 October 2020). "Heat storm and insufficient planning caused August rolling blackouts, California regulators say". Utility Dive. Archived from the original on 12 October 2020.
heat storm, inadequate resource planning targets, as well as some aspects of the day-ahead energy market contributed to the rolling blackouts
- Penn, Ivan (20 August 2020). "Poor Planning Left California Short of Electricity in a Heat Wave". The New York Times.
Almost a week after the blackouts began, neither the grid operator nor state energy regulators have offered a clear and detailed explanation of why California was so short of power even though peak demand was lower than it had been during other hot days in recent years. They have broadly attributed the energy shortage on their inability to secure more electricity from other states and sources. ... When utilities cut power to their customers, the peak demand had reached 47,000 megawatts on Friday and 45,000 on Saturday. Those were far below the highest day — 50,270 on July 24, 2006 — or the 50,116 clocked three years ago.
- Murray, Brian. "The Paradox of Declining Renewable Costs and Rising Electricity Prices". Forbes. Retrieved 2019-10-14.
- "How to protect California ratepayers, expand clean local energy and avoid bailing out PG&E". Utility Dive. Retrieved 2019-10-14.
- Roth, Sammy (2019-06-05). "California has too much solar power. That might be good for ratepayers". Los Angeles Times. Retrieved 2020-08-20.
Rothleder said overbuilding and curtailment are no substitute for the types of steps California will eventually need to take to fully replace fossil fuels with clean energy, such as investing in big energy storage projects, sharing more solar and wind power with neighboring states, ... Last year, for instance, the Legislature once again rejected then-Gov. Jerry Brown’s plan for greater sharing of renewable energy across the West. The proposal would have unified the region’s disparate power grids, reducing [solar] curtailment by allowing greater sharing of renewable energy across state lines, but lawmakers feared California could lose its sovereignty over its energy supply.
- Penn, Ivan (2016-06-15). "Brown wants to resurrect a plan to expand the state's power grid, but some say it's not that simple". Los Angeles Times. Retrieved 2020-08-20.
In addition, Senate leader Kevin de León and Assembly Speaker Anthony Rendon said they did not want California to lose authority to regulate the utility industry. ... Supporters of grid expansion say that a more regional approach to electricity will help manage the variable nature of solar and wind.
- Roth, Sammy (2020-08-19). "Here's how California can keep the lights on while meeting its clean energy goals". Los Angeles Times.
Critics, including the Sierra Club and labor unions, have argued the “big grid” concept would give red-state politicians too much sway over California’s energy supply and could lead to jobs building solar and wind farms getting shipped out of state. Supporters counter that a coordinated regional grid would reduce the costs of phasing out fossil fuels, partly by giving California easier access to powerful winds that blow across the plains of New Mexico and Wyoming. A single western grid might also make it easier for power managers across the region to coordinate supplies during a heat wave like the one this week, without having to scramble to find available resources.
- "CALIFORNIA'S CLIMATE PLAN". California Air Resources Board. Archived from the original on 2016-03-27.
Electricity and Energy (imported included): Improved appliance efficiency standards and other aggressive energy efficiency measures; 33% renewables by 2020;
- Megerian, Chris; Panzar, Javier (2015-10-07). "Gov. Brown signs climate change bill to spur renewable energy, efficiency standards". Los Angeles Times. Retrieved 2020-08-27.
Under the legislation, which builds upon standards already on the books, California will need to generate half of its electricity from renewable sources such as solar and wind by 2030. ... Even though the goal of reducing gasoline use was not included in the final legislation, SB 350, Brown plans to use his executive power to keep working on the issue.
- Dillon, Laim (2018-09-10). "California to rely on 100% clean electricity by 2045 under bill signed by Gov. Jerry Brown". Los Angeles Times. Retrieved 2020-08-27.
Senate Bill 100 by state Sen. Kevin de León (D-Los Angeles) requires the state to obtain all of its electricity from clean sources — such as solar, wind and hydropower — by 2045. The bill also requires electric utilities and other service providers to generate 60% of their power from renewable sources by 2030, up from the 50% goal previously set for that date.
- Roth, Sammy (2019-12-12). "California faces a crossroads on the path to 100% clean energy". Los Angeles Times. Retrieved 2020-08-20.
But natural gas, a planet-warming fossil fuel, still generates one-third of the state’s power ... The consulting firm released a study in June finding California might still need between 17,000 and 35,000 megawatts of gas capacity in 2050. At the high end, that’s not far from the 41,000 megawatts of gas installed today.
- Ming, Zach; Olson, Arne (2019-06-01). "Long-Run Resource Adequacy under Deep Decarbonization Pathways for California" (PDF). Energy and Environmental Economics, Inc. Retrieved 2020-08-22.
Some form of firm generation capacity is needed to ensure reliable electric load service on a deeply decarbonized electricity system. ... Natural gas generation capacity is currently the most economic source of firm capacity. The least-cost electricity portfolio to meet the 2050 economy-wide GHG goals for California includes 17-35 GW of natural gas generation capacity for reliability. This firm capacity is needed even while adding very large quantities of solar and electric energy storage. ... It would be extremely costly and impractical to replace all natural gas generation capacity with solar, wind and storage, due to the very large quantities of these resources that would be required.
- California OKs new transmission for renewables Reuters, December 17, 2009.
- "California ISO - Clean, green grid". Caiso.com.
- "California Renewables Portfolio Standard". California Public Utilities Commission.
- Fracassa, Dominic (May 18, 2017). "California grid sets record, with 67% of power from renewables". San Francisco Chronicle.
- SunLab (1998).Solar Trough Systems Retrieved December 18, 2008.
- Sacrificing the desert to save the Earth LA Times February 5, 2012.
- https://www.energy.ca.gov/sitingcases/beacon/Description.pdf
- "California Clean Energy Tour: Alta Wind Farm Powers Homes". California Energy Commission.
- "AB 2514 - Energy Storage System Procurement Targets from Publicly Owned Utilities". California Public Utilities Commission.
- "California Energy Storage Showcase". California Public Utilities Commission.
- BakersfieldNow Staff (2014-09-23). "Large battery-energy storage project unveiled in Tehachapi". KBAK – BakersfieldNow – Channel 58. Retrieved 2020-05-11.
- "VIDEO: LG Chem switches on 32 MWh energy storage system in California". POWERGrid International. 2014-09-26. Retrieved 2020-05-13.
- Spector, Julian (19 August 2020). "LS Power Energizes World's Biggest Battery, Just in Time for California's Heat Wave". www.greentechmedia.com. Archived from the original on 21 August 2020.
- SchdyInventTech (15 January 2013). "Vallecitos Boiling Water Reactor - 1958". YouTube.
- "NRC: Humboldt Bay". Nrc.gov. Retrieved 6 November 2017.
- "SCE Publishes 3,200 Pages of Documentation on Faulty SONGS Steam Generators - News - Nuclear Power News - Nuclear Street - Nuclear Power Plant News, Jobs, and Careers". Nuclearstreet.com.
- "Voters, in a First, Shut Down Nuclear Reactor". The New York Times. 8 June 1989.
- "PG&E To Close Diablo Canyon In 2025 - News - Nuclear Power News - Nuclear Street - Nuclear Power Plant News, Jobs, and Careers". Nuclearstreet.com. Retrieved 6 November 2017.
- "Total System Electric Generation". California Energy Commission. 2019-06-24. Retrieved 6 June 2020.
- "Hoover Dam: Frequently Asked Questions and Answers". Hoover Dam. United States Bureau of Reclamation. 1 August 2018.
- "Energy policy in California". Ballotpedia. Retrieved 2019-08-23.
- "California is set to hit its green-energy goals a decade early". Engadget. Retrieved 2019-08-23.
- "Electric Utilities in California". ww2.energy.ca.gov. Retrieved 2020-05-16.
- Roberts, David (2018-07-31). "California's huge energy decision: link its grid to its neighbors, or stay autonomous?". Vox. Retrieved 2019-10-06.
- "California utilities prep nation's biggest time-of-use rate rollout". Utility Dive. Retrieved 2019-10-14.
- "2014 Total System Electric Generation". California Energy Commission. 2016-06-30. Retrieved 2020-09-13.
In 2014, total system power for California was 293,268 gigawatt-hours (GWh), about 1 percent lower than 2013. California's in-state electricity production remained virtually unchanged from 2013 levels at 198,908 GWh, a difference of less than 1 percent compared to the year before.
- "2015 Total System Electric Generation". California Energy Commission. 2016-07-11. Retrieved 2020-09-13.
In 2015, total system electric generation for California was 295,405 gigawatt-hours (GWh), down about 0.5 percent from 2014’s total system electric generation of 297,062 GWh1. California's in-state electricity production was down by 1.5 percent at 196,195 GWh compared to 199,193 GWh.
- "2016 Total System Electric Generation". California Energy Commission. 2017-06-23. Retrieved 2020-09-06.
In 2016, total system electric generation for California was 290,567 gigawatt-hours (GWh), ... While California's in-state electric generation was up by 1.0 percent at 198,227 GWh compared to 196,195 GWh in 2015, net imports were down by 6,869 GWh to 92,341 GWh
- "2017 Total System Electric Generation". California Energy Commission. 2018-06-01. Retrieved 2020-09-06.
In 2017, total system electric generation for California was 292,039 gigawatt-hours (GWh), ... California's in-state electric generation was up by 4 percent to 206,336 GWh compared to 198,227 GWh in 2016 while net imports were down by 7 percent or 6,638 GWh to 85,703 GWh.
- "2018 Total System Electric Generation". California Energy Commission. 2019-06-24. Retrieved 2020-09-06.
In 2018, total generation for California was 285,488 gigawatt-hours (GWh), ... in-state generation dropped by 6 percent (11,494 GWh) to 194,842 GWh. ... Net imports increased by 6 percent (4,944 GWh) to 90,648 GWh
- "2019 Total System Electric Generation". California Energy Commission. 2019-06-24. Retrieved 2020-09-06.
Total system electric generation is the sum of all utility-scale in-state generation plus net electricity imports. In 2019, total generation for California was 277,704 gigawatt-hours (GWh), ... decrease in net imports to 77,229 GWh
- "California Electrical Energy Generation". California Energy Commission. Archived from the original on 23 June 2018. Retrieved 22 June 2018.
- "Net Taxable Gasoline Gallons" (PDF). California Board of Equalization. 2000–2009. Archived from the original (PDF) on April 2, 2010.
- "Net Taxable Gasoline Gallons" (PDF). California Board of Equalization. 2010–2016. Archived from the original (PDF) on June 13, 2017.
- "Oil and Gas in California: The Industry and Its Economic Contribution in 2012" (PDF). Western States Petroleum Association. Los Angeles County Economic Development Corporation. Archived from the original (PDF) on 2017-05-25. Retrieved 2017-01-23.
- Kornei, Katherine (March 5, 2020). "The Ecological Costs of Removing California's Offshore Oil Rigs". Eos. Retrieved 2020-10-22.
- "California Number and Capacity of Petroleum Refineries". U.S. Energy Information Administration. January 1, 2017.
- "California's Oil Refineries". California Energy Commission.
- "California Profile". www.eia.gov. Retrieved 2019-10-06.
- "California - State Energy Profile Overview - U.S. Energy Information Administration (EIA)". www.eia.gov. Retrieved 2019-10-06.
- Roberts, David (2017-08-22). "California has a climate problem, and its name is cars". Vox. Retrieved 2019-10-06.
- "Economic Perspective" (PDF). California Board of Equalization. February 2013.
- Kohlman, Matt (March 31, 2017). "Pickup vs. Prius: Texas passes California as gasoline consumption king". S&P Global Platts.
- Board, California Air Resources. "Cleaner-Burning Gasoline: An Update". Arb.ca.gov. Retrieved 2017-02-16.
- "The continued transition to electric vehicles in U.S. cities | International Council on Clean Transportation". theicct.org. Retrieved 2019-10-13.
- "ARTICLE 2. Alternative and Renewable Fuel and Vehicle Technology Program [44272 - 44273]". leginfo.legislature.ca.gov. Retrieved 2019-10-13.
- "Alternative and Renewable Fuel and Vehicle Technology Program Proceedings". ww2.energy.ca.gov. Retrieved 2019-10-13.
- "Quantifying the electric vehicle charging infrastructure gap across U.S. markets | International Council on Clean Transportation". theicct.org. Retrieved 2019-10-13.
- "California Electric Vehicle Infrastructure Project | Center for Sustainable Energy". energycenter.org. Retrieved 2019-10-13.
- Lazo, Alejandro (2020-09-23). "California to Ban Sales of New Gas-Powered Cars Starting in 2035". The Wall Street Journal. Retrieved 2020-10-21.
California Gov. Gavin Newsom signed an order Wednesday that aims to end the sale of new gasoline and diesel-powered passenger cars in the state by 2035. ... The order also says that, “where feasible,” medium- and heavy-duty vehicles such as trucks and construction equipment should be zero-emission by 2045.
- Gold, Russell (2020-09-25). "California Wants Cars to Run on Electricity. It's Going to Need a Much Bigger Grid". The Wall Street Journal. Retrieved 2020-10-21.
Energy consultants and academics say converting all passenger cars and trucks to run on electricity in California could raise power demand by as much as 25%.
- "V2G company Nuvve participating in California's wholesale energy markets to help balance the grid". Green Car Congress. Archived from the original on 3 October 2020.
- "Vehicle-Grid integration (VGi) roadmap: Enabling vehicle-based grid services" (PDF). CAISO. February 2014.
- "Energy-Water Nexus: The Water Sector's Energy Use" (PDF). Congressional Research Service.
- Levinson, Arik (2016). "How Much Energy Do Building Energy Codes Save? Evidence from California Houses". The American Economic Review. 106 (10): 2867–2894. doi:10.1257/aer.20150102. ISSN 0002-8282. JSTOR 43956938.
- "Natural Gas Annual 2006" (PDF). US Department of Energy. October 2007. pp. 1, 70. Archived from the original (PDF) on 2009-01-14. Retrieved 2009-01-11.
- "Overview of Natural Gas in California". Energy Almanac. California Energy Commission. Archived from the original on 2009-04-30. Retrieved 2009-01-11.
- "Tesla, Greensmith, AES Deploy Aliso Canyon Battery Storage in Record Time". GTM. 31 January 2017. Retrieved 6 February 2017.
- "Archived copy". Archived from the original on 2013-09-01. Retrieved 2015-08-03.CS1 maint: archived copy as title (link)
- Ailworth, Erin; Lazo, Alejandro (2018-08-29). "California Lawmakers Vote to Mandate Carbon-Free Electricity Generation". Wall Street Journal. ISSN 0099-9660. Retrieved 2018-08-29.
- "California Lawmakers Set Goal for Carbon-Free Energy by 2045". Retrieved 2018-08-29.
- Energy Conservation Program: Energy Conservation Standards for General Service Incandescent Lamps 10 CFR Part 430, EERE-2019-BT-STD-0022, RIN 1904-AE76
- Mufson, Steven. "Energy Department to prolong the lives of incandescent lightbulbs". The Washington Post. Retrieved October 10, 2019.
- Eilperin, Juliet; Mufson, Steven (December 20, 2019). "The Trump administration just overturned a ban on old-fashioned lightbulbs". Washington Post. Retrieved January 2, 2020.
- "Judge allows California's shift to energy saving light bulbs". Associated Press. 2020-01-02. Retrieved 2020-01-02 – via KSBY.
External links
- Today's Outlook, California ISO
- Yesterday's Renewables Production, California ISO
- Energy Flow Chart (2000)
- Grid maps: South, Central, North