Tea production in Sri Lanka
Tea production is one of the main sources of foreign exchange for Sri Lanka (formerly called Ceylon), and accounts for 2% of GDP, contributing over US$1.5 billion in 2013 to the economy of Sri Lanka.[1] It employs, directly or indirectly, over 1 million people, and in 1995 directly employed 215,338 on tea plantations and estates. In addition, tea planting by smallholders is the source of employment for thousands whilst it is also the main form of livelihoods for tens of thousands of families. Sri Lanka is the world's fourth-largest producer of tea. In 1995, it was the world's leading exporter of tea (rather than producer), with 23% of the total world export, but it has since been surpassed by Kenya. The highest production of 340 million kg was recorded in 2013, while the production in 2014 was slightly reduced to 338 million kg.[2]
The humidity, cool temperatures, and rainfall of the country's central highlands provide a climate that favors the production of high-quality tea. On the other hand, tea produced in low-elevation areas such as Matara, Galle and Ratanapura districts with high rainfall and warm temperature has high level of astringent properties. The tea biomass production itself is higher in low-elevation areas. Such tea is popular in the Middle East. The industry was introduced to the country in 1867 by James Taylor, a British planter who arrived in 1852.[3][4][5][6][7][8][9] Tea planting under smallholder conditions has become popular in the 1970s.
History

The total population of Sri Lanka according to the census of 1871 was 2,584,780. The 1871 demographic distribution and population in the plantation areas is given below:[10]
| District | Total population | No. of estates | Estate population | % of population on estates |
|---|---|---|---|---|
| Kandy District | 258,432 | 625 | 81,476 | 31.53 |
| Badulla District | 129,000 | 130 | 15,555 | 12.06 |
| Matale District | 71,724 | 111 | 13,052 | 18.2 |
| Kegalle District | 105,287 | 40 | 3,790 | 3.6 |
| Sabaragamuwa | 92,277 | 37 | 3,227 | 3.5 |
| Nuwara Eliya District | 36,184 | 21 | 308 | 0.85 |
| Kurunegala District | 207,885 | 21 | 2,393 | 1.15 |
| Matara District | 143,379 | 11 | 1,072 | 0.75 |
| Total | 1,044,168 | 996 | 123,654 | 11.84 |
Growth and history of commercial production
Registered tea production by elevation
Registered tea production in hectares and total square miles by elevation category in Sri Lanka, 1959–2000:[10]
| Year | High altitude hectares | Medium altitude hectares | Low altitude hectares | Total hectares | Total square miles |
|---|---|---|---|---|---|
| 1959 | 74,581 | 66,711 | 46,101 | 187,393 | 723.5 |
| 1960 | 79,586 | 69,482 | 48,113 | 197,181 | 761.3 |
| 1961 | 76,557 | 97,521 | 63,644 | 237,722 | 917.8 |
| 1962 | 76,707 | 97,857 | 64,661 | 239,225 | 923.7 |
| 1963 | 76,157 | 95,691 | 65,862 | 237,710 | 917.8 |
| 1964 | 81,538 | 92,281 | 65,759 | 239,578 | 925.0 |
| 1965 | 87,345 | 92,806 | 60,365 | 240,516 | 928.6 |
| 1966 | 87,514 | 93,305 | 60,563 | 241,382 | 932.0 |
| 1967 | 87,520 | 93,872 | 60,945 | 242,337 | 935.7 |
| 1968 | 81,144 | 99,359 | 61,292 | 241,795 | 933.6 |
| 1969 | 81,092 | 98,675 | 61,616 | 241,383 | 932.0 |
| 1970 | 77,549 | 98,624 | 65,625 | 241,798 | 933.6 |
| 1971 | 77,936 | 98,624 | 65,625 | 242,185 | 935.1 |
| Year | High altitude hectares | Medium altitude hectares | Low altitude hectares | Total hectares | Total square miles |
|---|---|---|---|---|---|
| 1972 | 77,639 | 98,252 | 65,968 | 241,859 | 933.8 |
| 1973 | 77,793 | 98,165 | 66,343 | 242,301 | 935.5 |
| 1974 | 77,693 | 97,875 | 66,622 | 242,190 | 935.1 |
| 1975 | 79,337 | 98,446 | 64,099 | 241,882 | 933.9 |
| 1976 | 79,877 | 94,338 | 66,363 | 240,578 | 928.9 |
| 1977 | 79,653 | 94,835 | 67,523 | 242,011 | 934.4 |
| 1978 | 79,628 | 95,591 | 68,023 | 243,242 | 939.2 |
| 1979 | 78,614 | 97,084 | 68,401 | 244,099 | 942.5 |
| 1980 | 78,786 | 96,950 | 68,969 | 244,705 | 944.8 |
| 1981 | 78,621 | 96,853 | 69,444 | 244,918 | 945.6 |
| 1982 | 77,769 | 96,644 | 67,728 | 242,141 | 934.9 |
| 1983 | 71,959 | 90,272 | 67,834 | 230,065 | 888.3 |
| 1984 | 74,157 | 90,203 | 63,514 | 227,874 | 879.8 |
| Year | High altitude hectares | Medium altitude hectares | Low altitude hectares | Total hectares | Total square miles |
|---|---|---|---|---|---|
| 1985 | 74,706 | 89,175 | 67,769 | 231,650 | 894.4 |
| 1986 | 73,206 | 85,216 | 64,483 | 222,905 | 860.6 |
| 1987 | 72,773 | 84,445 | 64,280 | 221,498 | 855.2 |
| 1988 | 72,901 | 84,227 | 64,555 | 221,683 | 855.9 |
| 1989 | 73,110 | 84,062 | 64,938 | 222,110 | 857.6 |
| 1990 | 73,138 | 83,223 | 65,397 | 221,758 | 856.2 |
| 1991 | 73,331 | 82,467 | 65,893 | 221,691 | 856.0 |
| 1992 | 74,141 | 85,510 | 62,185 | 221,836 | 856.5 |
| 1994 | 51,443 | 56,155 | 79,711 | 187,309 | 723.2 |
| 1995 | 51,443 | 56,155 | 79,711 | 187,309 | 723.2 |
| 1996 | 52,272 | 56,863 | 79,836 | 188,971 | 729.6 |
| 1997 | 51,444 | 58,155 | 79,711 | 189,310 | 730.9 |
| 1998 | 51,444 | 58,155 | 79,711 | 189,310 | 730.9 |
| 2000 | 52,272 | 56,863 | 79,836 | 188,971 | 729.6 |
Main destination of Sri Lankan teas
The most important foreign markets for Sri Lankan tea are the former Soviet bloc countries of the CIS, the United Arab Emirates, Russia, Syria, Turkey, Iran, Saudi Arabia, Iraq, the UK, Egypt, Libya and Japan.[11]
The most important foreign markets for Sri Lankan tea are as follows, in terms of millions of kilograms and millions of pounds imported. The figures were recorded in 2000:[10]
Country | Million kilograms | Million pounds | Percent of total |
|---|---|---|---|
| CIS Countries | 57.6 | 127.0 | 20 |
| UAE | 48.1 | 106.0 | 16.7 |
| Russia | 46.1 | 101.6 | 16.01 |
| Syria | 21.5 | 47.4 | 7.47 |
| Turkey | 20.3 | 44.8 | 7.05 |
| Iran | 12.5 | 27.6 | 4.34 |
| Saudi Arabia | 11.4 | 25.1 | 3.96 |
| Iraq | 11.1 | 24.5 | 3.85 |
| UK | 10.2 | 22.5 | 3.54 |
| Egypt | 10.1 | 22.3 | 3.51 |
| Libya | 10.0 | 22.0 | 3.47 |
| Japan | 8.3 | 18.3 | 2.88 |
| Germany | 5.0 | 11.0 | 1.74 |
| Others | 23.7 | 52.2 | 8.23 |
| Total | 288 | 634.9 | 100 |
The Tea Research Institute
The Tea Research Ordinance was enacted by Parliament in 1925 and the Tea Research Institute (TRI) was founded. It is at present the only national body in the country that generates and disseminates new research and technology related to the processing and cultivation of tea.[12]
Beginning in the early 1970s, two researchers from the National Institute of Dental Research in Bethesda, Maryland, USA conducted a series of research projects in which they arranged a longitudinal study group of a large number of Tamil tea labourers who worked at the Dunsinane and Harrow Tea Estates, 80 kilometres (50 mi) from Kandy. This landmark study was possible because the population of tea labourers were known to have never employed any conventional oral hygiene measures, thereby providing some insight into the natural history of periodontal disease in man.[13]
Sustainability standards and certifications
There are a number of organisations, both international and local, that promote and enforce sustainability standards and certifications pertaining to tea in Sri Lanka.
Among the international organisations that operate within Sri Lanka are Rainforest Alliance, Fairtrade, UTZ Certified and Ethical Tea Partnership. The Small Organic Farmers’ Association (SOFA) is a local organisation dedicated to organic farming.
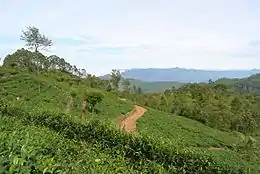
Gallery
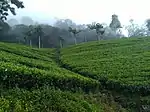 Tea plantations in Wewalthalawa
 Tea plantations near Haputale, Uva
 Tea plantations in Nuwara Eliya
 Picking tea leaves
 Tea leaves
See also
- Dilmah
- James Taylor (Ceylon)
- George Steuart Group (Steuarts Tea, 1835 Steuarts Ceylon)
- Loolecondera
- Thomas Lipton
- Handunugoda Tea Estate
- Orange Field Tea Factory
References
- Sri Lanka Export Development Board, 2014, Industry Capability Report: Tea Sector, http://www.srilankabusiness.com/pdf/industrycapabilityreport_tea_sector.pdf Archived 2015-09-24 at the Wayback Machine
- Central Bank of Sri Lanka, 2014, Annual Report, http://www.cbsl.gov.lk/pics_n_docs/10_pub/_docs/efr/annual_report/AR2014/English/content.htm Archived 2015-08-03 at the Wayback Machine
- "TED Case Studies – Ceylon Tea". American University, Washington, DC. Archived from the original on 23 February 2015. Retrieved 27 November 2013.
- "Sri Lanka tops tea sales". BBC. 1 February 2002. Archived from the original on 3 May 2008. Retrieved 28 April 2008.
- "Sri Lanka Tea Tour". The Tea Association of the USA. 11–17 August 2003. Archived from the original on 17 April 2011. Retrieved 5 April 2008.
- "Role of Tea in Development in Sri Lanka". United Nations Economic and Social Commission for Asia and the Pacific. Archived from the original on 6 October 2008.
- "South Asia Help for Sri Lanka's tea industry". BBC News. 4 April 1999. Archived from the original on 30 June 2009. Retrieved 5 April 2008.
- "Sri Lanka moves to protect tea industry". BBC News. 19 February 2003. Archived from the original on 7 April 2008. Retrieved 5 April 2008.
- "Just 64p a day for tea pickers in Sri Lanka". BBC News. 20 September 2005. Archived from the original on 30 June 2009. Retrieved 5 April 2008.
- Holsinger, Monte (2002). "Thesis on the History of Ceylon Tea". History of Ceylon Tea. Archived from the original on 19 June 2009. Retrieved 25 April 2009.
- "Sri Lanka tops tea sales". BBC. 1 February 2002. Archived from the original on 2 May 2004. Retrieved 25 April 2009.
- Who we are Archived 2017-04-27 at the Wayback Machine, Tea Research Institute - Sri Lanka, Retrieved April 2017
- Löe, H, et al. Natural history of periodontal disease in humans. J Clin Perio 1986;13:431–440.
Further reading
- George Thornton Pett (1899). The Ceylon Tea-Makers' Handbook. The Times of Ceylon Steam Press, Colombo.
External links
| Wikimedia Commons has media related to Tea plantations in Sri Lanka. |
- Official web site of the Sri Lanka Tea Board
- Introduction about Ceylon Tea
- Taylor, Lipton and the Birth of Ceylon Tea
| Common varieties |
| ||||||||||||||||
|---|---|---|---|---|---|---|---|---|---|---|---|---|---|---|---|---|---|
| General | |||||||||||||||||
| Culture |
| ||||||||||||||||
| History | |||||||||||||||||
| Production and distribution |
| ||||||||||||||||
| Preparation | |||||||||||||||||
| Health | |||||||||||||||||
| Tea-based drinks | |||||||||||||||||
| See also |
| ||||||||||||||||
| |||||||||||||||||
| |||||||||||
|---|---|---|---|---|---|---|---|---|---|---|---|
British Ceylon 1815 – 1948 | |||||||||||
| Background | |||||||||||
| History | |||||||||||
| Politics and government |
| ||||||||||
| Economy |
| ||||||||||
| Society |
| ||||||||||
| Other |
| ||||||||||
| |||||||||||
Tea production in Asia | |
|---|---|
| Sovereign states |
|
| States with limited recognition |
|
| Dependencies and other territories |
|
| |