Timeline of the 2018 Pacific hurricane season
The 2018 Pacific hurricane season was an event in the annual cycle of tropical cyclone formation, in which tropical cyclones form in the eastern Pacific Ocean. The season officially started on May 15 in the eastern Pacific—east of 140°W—and began on June 1 in the central Pacific—between the International Date Line and 140°W, and ended on November 30. These dates typically cover the period of each year when most tropical cyclones form in the eastern Pacific basin.[1] The season's first storm, Tropical Depression One-E, developed on May 10; the season's final storm, Tropical Storm Xavier, dissipated as a tropical cyclone on November 5.
| Timeline of the 2018 Pacific hurricane season | |||||
|---|---|---|---|---|---|
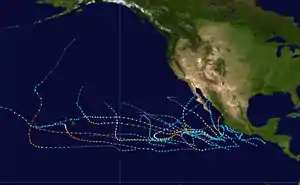 Season summary map | |||||
| Season boundaries | |||||
| First system formed | May 10, 2018 | ||||
| Last system dissipated | November 5, 2018 | ||||
| Strongest system | |||||
| Name | Walaka | ||||
| Maximum winds | 160 mph (260 km/h) (1-minute sustained) | ||||
| Lowest pressure | 921 mbar (hPa; 27.2 inHg) | ||||
| Longest lasting system | |||||
| Name | Sergio | ||||
| Duration | 13.50 days | ||||
| |||||
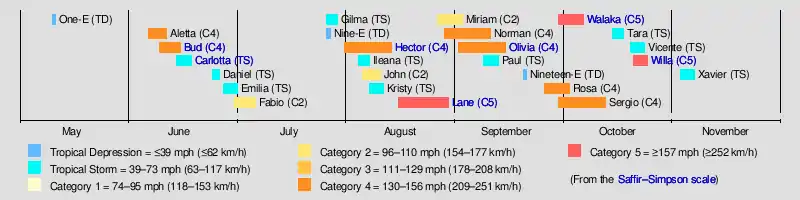
The 2018 hurricane season was exceptionally active and featured the highest Accumulated Cyclone Energy since reliable records began in 1971.[2] Throughout the season, 26 tropical depressions developed, 23 of which became tropical storms, 13 of them reached hurricane strength, and 10 achieved major hurricane intensity.[3][nb 1] The basin saw above-average activity across all regions from the International Dateline to the west coast of Mexico and Central America. Activity peaked during a 10-week period from early August to early October, with several long-lived and powerful hurricanes developing. Several storms had significant land impacts, including Hurricane Lane in Hawaii and Hurricane Willa in Mexico. In contrast to the similarly active 2015 Pacific hurricane season, 2018 was not significantly influenced by the El Niño–Southern Oscillation. Instead, low pressures and increased sea surface temperatures associated with the Pacific Meridional Mode supported the development intense and long-lived storms.[2]
Four time zones are utilized in the basin: Central for storms east of 106°W, Mountain between 114.9°W and 106°W, Pacific between 140°W and 115°W,[5] and Hawaii–Aleutian for storms between the International Date Line and 140°W. However, for convenience, all information is listed by Coordinated Universal Time (UTC) first with the respective local time included in parentheses. This timeline includes information that was not operationally released, meaning that data from post-storm reviews by the National Hurricane Center is included. This timeline documents tropical cyclone formations, strengthening, weakening, landfalls, extratropical transitions, and dissipations during the season.
Timeline of events
| Storm | Formation[nb 2] | Dissipation[nb 3] | Peak Saffir–Simpson scale category | Ref. | |
|---|---|---|---|---|---|
| Number | Name | ||||
| 01−E | One-E | May 10 | May 11 | Tropical Depression | [6] |
| 02−E | Aletta | June 6 | June 11 | Category 4 hurricane | [7] |
| 03−E | Bud | June 9 | June 15 | Category 4 hurricane | [8] |
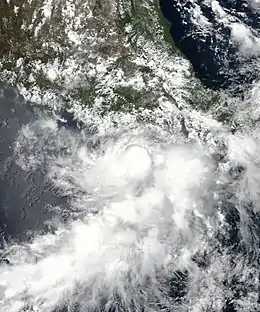
| 04−E | Carlotta | June 14 | June 18 | Tropical Storm | [9] |
| 05−E | Daniel | June 24 | June 26 | Tropical Storm | [10] |
| 06−E | Emilia | June 27 | July 1 | Tropical Storm | [11] |
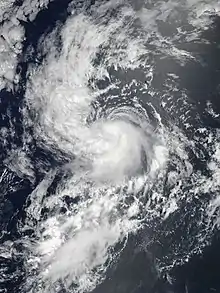
| 07−E | Fabio | June 30 | July 6 | Category 2 hurricane | [12] |
| 08−E | Gilma | July 26 | July 29 | Tropical Storm | [13] |
| 09−E | Nine-E | July 26 | July 27 | Tropical Depression | [14] |
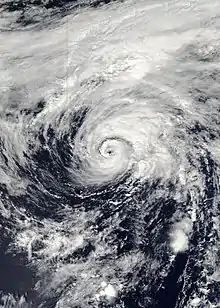
| 10−E | Hector | July 31 | August 16[nb 4] | Category 4 hurricane | [15] |
| 11−E | Ileana | August 4 | August 7 | Tropical Storm | [16] |
| 12−E | John | August 5 | August 10 | Category 2 hurricane | [17] |
| 13−E | Kristy | August 6 | August 12 | Tropical Storm | [18] |
| 14−E | Lane | August 15 | August 28 | Category 5 hurricane | [19] |
| 15−E | Miriam | August 26 | September 2 | Category 2 hurricane | [20] |
| 16−E | Norman | August 28 | September 8 | Category 4 hurricane | [21] |
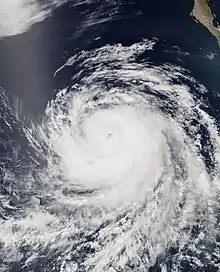
| 17−E | Olivia | August 28 | September 8 | Category 4 hurricane | [22] |
| 96C[nb 5] | Disturbance | September 1 | September 3 | Subtropical Storm | [23][24][25] |
| 18−E | Paul | September 8 | September 11 | Tropical Storm | [26] |
| 19−E | Nineteen-E | September 19 | September 20 | Tropical Depression | [27] |
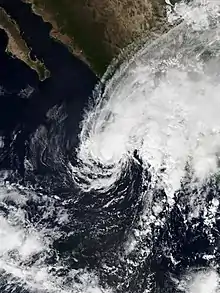
| 20−E | Rosa | September 25 | October 2 | Category 4 hurricane | [28] |
| 21−E | Sergio | September 29 | October 12 | Category 4 hurricane | [29] |
| 01−C | Walaka | September 29 | October 6 | Category 5 hurricane | [30] |
| 22−E | Tara | October 14 | October 16 | Tropical Storm | [31] |
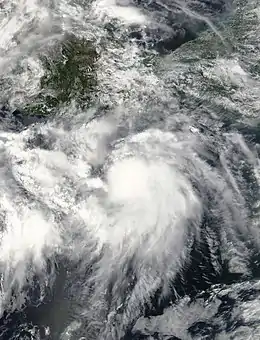
| 23−E | Vicente | October 19 | October 23 | Tropical Storm | [32] |
| 24−E | Willa | October 20 | October 24 | Category 5 hurricane | [33] |
| 25−E | Xavier | November 2 | November 5 | Tropical Storm | [34] |
May
May 10
- 12:00 UTC (5:00 a.m. PDT) at 12.1°N 125.4°W – Tropical Depression One-E forms from an area of low pressure roughly 1,225 mi (1,970 km)[nb 6] southwest of Cabo San Lázaro, Baja California Sur.[6] At the time, this was the second-earliest formation of a tropical cyclone in the Eastern Pacific proper behind Tropical Storm Adrian a year prior.[35][nb 7]
- 18:00 UTC (11:00 a.m. PDT) at 12.3°N 126.2°W – Tropical Depression One-E reaches peak intensity with maximum sustained winds of 35 mph (55 km/h) and a minimum pressure of 1007 mbar (29.74 inHg), approximately 1,250 mi (2,010 km) southwest of Cabo San Lázaro, Baja California Sur.[6]
May 11
- 18:00 UTC (11:00 a.m. PDT) at 12.7°N 129.3°W – Tropical Depression One-E degenerates into a remnant low roughly 1,390 mi (2,235 km) west-southwest of Cabo San Lázaro, Baja California Sur.[6]
May 13
- 18:00 UTC (11:00 a.m. PDT) – One-E's remnants dissipate roughly 1,390 mi (2,235 km) southwest of Punta Eugenia, Baja California Sur.[6]
May 15
- The 2018 Eastern Pacific hurricane season officially begins.[1]
June
June 1

- The 2018 Central Pacific hurricane season officially begins.[1]
June 6
- 00:00 UTC (7:00 p.m. CDT, June 5) at 14.0°N 105.4°W – Tropical Depression Two-E develops from an area of low pressure roughly 325 mi (525 km) south-southwest of Punta San Telmo, Michoacán.[7]
- 06:00 UTC (12:00 a.m. MDT) at 14.2°N 106.1°W – Tropical Depression Two-E intensifies into Tropical Storm Aletta roughly 335 mi (540 km) south-southwest of Punta San Telmo, Michoacán.[7]
June 7
- 18:00 UTC (12:00 p.m. MDT) at 15.1°N 109.6°W – Tropical Storm Aletta intensifies into a Category 1 hurricane roughly 425 mi (685 km) southwest of Punta Pérula, Jalisco.[7]
June 8
- 00:00 UTC (6:00 p.m. MDT, June 7) at 15.4°N 110.1°W – Hurricane Aletta intensifies into a Category 2 hurricane roughly 435 mi (700 km) southwest of Punta Pérula, Jalisco.[7]
- 06:00 UTC (12:00 a.m. MDT) at 15.6°N 110.6°W – Hurricane Aletta intensifies into a Category 3 hurricane about roughly 450 mi (725 km) southwest of Punta Pérula, Jalisco.[7]
- 12:00 UTC (6:00 a.m. MDT) at 15.7°N 111.0°W – Hurricane Aletta intensifies into a Category 4 hurricane roughly 470 mi (755 km) southwest of Punta Pérula, Jalisco. Simultaneously, the storm reaches peak intensity with winds of 140 mph (220 km/h) and a minimum pressure of 943 mbar (27.8 inHg).[7]
June 9
- 00:00 UTC (6:00 p.m. MDT, June 8) at 16.0°N 112.0°W – Hurricane Aletta weakens into a Category 3 hurricane roughly 490 mi (790 km) south-southwest of Cabo San Lucas, Baja California Sur.[7]
- 12:00 UTC (6:00 a.m. MDT) at 16.2°N 113.0°W – Hurricane Aletta weakens into a Category 2 hurricane roughly 500 mi (805 km) south-southwest of Cabo San Lucas, Baja California Sur.[7]
- 18:00 UTC (12:00 p.m. MDT) at 16.1°N 113.5°W – Hurricane Aletta weakens into a Category 1 hurricane roughly 520 mi (835 km) south-southwest of Cabo San Lucas, Baja California Sur.[7]
- 18:00 UTC (1:00 p.m. CDT) at 12.1°N 100.5°W – Tropical Depression Three-E forms about 330 mi (530 km) south of Acapulco.[8]
June 10
- 00:00 UTC (6:00 p.m. MDT, June 9) at 15.9°N 114.0°W – Hurricane Aletta weakens into a tropical storm roughly 545 mi (875 km) south-southwest of Cabo San Lucas, Baja California Sur.[7]
- 00:00 UTC (7:00 p.m. CDT, June 9) at 12.7°N 101.3°W – Tropical Depression Three-E strengthens into Tropical Storm Bud about 305 mi (490 km) south of Acapulco.[8]
- 18:00 UTC (1:00 p.m. CDT) at 15.1°N 103.8°W – Tropical Storm Bud intensifies into a Category 1 hurricane about 280 mi (450 km) south of Manzanillo, Colima.[8]
June 11
- 06:00 UTC (12:00 a.m. MDT) at 16.1°N 105.6°W – Hurricane Bud intensifies into a Category 2 hurricane about 225 miles (360 km) south-southwest of Manzanillo, Colima.[8]
- 12:00 UTC (8:00 a.m. PDT) at 15.9°N 114.0°W – Tropical Storm Aletta degenerates into a remnant low roughly 640 mi (1,030 km) south-southwest of Cabo San Lázaro, Baja California Sur.[7]
- 12:00 UTC (6:00 a.m. MDT) at 16.4°N 106.4°W – Hurricane Bud intensifies into a Category 3 hurricane about 280 miles (450 km) south-southwest of Cabo Corrientes, Mexico.[8]
June 12
- 00:00 UTC (6:00 p.m. MDT, June 11) at 17.3°N 107.4°W – Hurricane Bud reaches peak intensity with winds of 140 mph (220 km/h) and a pressure of 943 mbar (hPa; 27.85 inHg), while located about 240 miles (390 km) south-southwest of Cabo Corrientes, Mexico.[8]
- 12:00 UTC (6:00 a.m. MDT) at 18.0°N 108.1°W – Hurricane Bud weakens into a Category 3 hurricane about 230 miles (365 km) southwest of Cabo Corrientes, Mexico.[8]
June 13
- 00:00 UTC (6:00 p.m. MDT June 12) at 18.5°N 108.5°W – Hurricane Bud weakens into a Category 1 hurricane about 310 miles (500 km) south-southeast of Cabo San Lucas, Mexico.[8]
- 12:00 UTC (6:00 a.m. MDT) at 19.2°N 108.7°W – Hurricane Bud weakens into a tropical storm about 265 miles (430 km) south-southeast of Cabo San Lucas, Mexico.[8]
June 14
- 18:00 UTC (1:00 p.m. CDT) at 14.9°N 100.0°W – Tropical Depression Four-E develops from an area of low pressure about 140 miles (220 km) south of Acapulco, Mexico.[9]
June 15
- 02:00 UTC (8:00 p.m. MDT, June 14) at 23.0°N 109.7°W – Tropical Storm Bud makes landfall near San José del Cabo, about 15 miles (25 km) east-northeast of Cabo San Lucas, Mexico.[8]
- 12:00 UTC (6:00 a.m. MDT) at 25.3°N 110.0°W – Tropical Storm Bud weakens into a post-tropical cyclone about 140 miles (220 km) south-southwest of Huatabampito, Mexico.[8]
- 18:00 UTC (1:00 p.m. CDT) at 15.8°N 99.6°W – Tropical Depression Four-E intensifies into Tropical Storm Carlotta about 80 miles (125 km) south of Acapulco, Mexico.[9]
June 16
June 17
- 00:00 UTC (7:00 p.m. CDT, June 16) at 16.4°N 99.5°W – Tropical Storm Carlotta reaches peak intensity with winds of 65 mph (100 km/h) and a minimum pressure of 997 mbar (hPa; 29.44 inHg), located around 45 miles (70 km) southeast of Acapulco, Mexico.[9]
- 18:00 UTC (1:00 p.m. CDT) at 17.0°N 101.7°W – Tropical Storm Carlotta weakens into a tropical depression about 45 miles (70 km) south of Zihuatanejo, Mexico.[9]
June 19
- 00:00 UTC (7:00 p.m. CDT, June 18) at 18.1°N 103.5°W – Tropical Depression Carlotta degenerates into a remnant low roughly 85 miles (135 km) west of Lázaro Cárdenas, Mexico.[9]
- 06:00 UTC (1:00 a.m. CDT) – Carlotta's remnants dissipate approximately 85 miles (135 km) west of Lázaro Cárdenas, Mexico.[9]
June 24
- 00:00 UTC (5:00 p.m. CDT, June 22) at 13.7°N 115.5°W – Tropical Depression Five-E develops from an area of low pressure about 730 miles (1,175 km) southwest of the southern tip of Baja California.[10]
- 12:00 UTC (5:00 a.m. PDT) at 15.5°N 115.8°W – Tropical Depression Five-E intensifies into Tropical Storm Daniel approximately 635 miles (1,020 km) southwest of the southern tip of Baja California.[10]
- 18:00 UTC (11:00 a.m. PDT) at 16.6°N 116.0°W – Tropical Storm Daniel reaches peak intensity with winds of 45 mph (75 km/h) and a minimum pressure of 1004 mbar (hPa; 29.65 inHg), approximately 585 miles (940 km) southwest of the southern tip of Baja California.[10]
June 25
- 18:00 UTC (11:00 a.m. PDT) at 19.2°N 117.8°W – Tropical Storm Daniel weakens to a tropical depression roughly 565 miles (905 km) west-southwest of the southern tip of Baja California.[10]
June 26
- 06:00 UTC (11:00 p.m. PDT, June 25) at 19.8°N 119.0°W – Tropical Depression Daniel degenerates to a remnant low roughly 615 miles (990 km) west-southwest of the southern tip of Baja California.[10]
June 27
- 18:00 UTC (12:00 p.m. MDT) at 12.8°N 108.1°W – Tropical Depression Six-E forms approximately 505 miles (810 km) southwest of Manzanillo, Colima.[11]
June 28
- 12:00 UTC (5:00 a.m. PDT) – Daniel's remnants dissipate more than 1,015 miles (1,635 km) west-southwest of the southern tip of Baja California.[10]
- 12:00 UTC (6:00 a.m. MDT) at 14.2°N 111.8°W – Tropical Depression Six-E strengthens into Tropical Storm Emilia approximately 610 miles (985 km) south of the southern tip of Baja California.[11]
June 29
- 12:00 UTC (5:00 a.m. PDT) at 16.0°N 115.8°W – Tropical Storm Emilia attains peak intensity with winds of 60 mph (95 km/h) and a minimum pressure of 997 mbar (hPa; 29.44 inHg), roughly 610 miles (980 km) from the southern tip of Baja California.[11]
June 30
- 12:00 UTC (5:00 a.m. PDT) at 17.4°N 118.8°W – Tropical Storm Emilia weakens into a tropical depression roughly 685 miles (1,100 km) west-southwest of the southern tip of Baja California.[11]
- 18:00 UTC (1:00 p.m. CDT) at 11.0°N 103.8°W – Tropical Depression Seven develops from an area of low pressure approximately 560 miles (900 km) south-southwest of Manzanillo, Colima.[12]
July
July 1
- 06:00 UTC (12:00 a.m. MDT) at 11.6°N 105.8°W – Tropical Depression Seven intensifies into Tropical Storm Fabio about 525 miles (850 km) south-southwest of Manzanillo, Mexico.[12]
July 2
- 00:00 UTC (5:00 p.m. PDT, July 1) at 20.0°N 124.7°W – Tropical Depression Emilia weakens into a remnant low roughly 965 miles (1,555 km) west of the southern tip of Baja California.[11]
- 12:00 UTC (6:00 a.m. MDT) at 12.9°N 110.4°W – Tropical Storm Fabio intensifies into a Category 1 hurricane roughly 690 miles (1110 km) south of the southern tip of the Baja California Peninsula.[12]
July 3
- 06:00 UTC (11:00 p.m. PDT, July 2) at 14.7°N 113.6°W – Hurricane Fabio intensifies into a Category 2 hurricane approximately 610 miles (985 km) southwest of the southern tip of the Baja California Peninsula.[12]
- 18:00 UTC (11:00 a.m. PDT) at 15.5°N 116.0°W – Hurricane Fabio attains its peak intensity with maximum sustained winds of 110 mph (175 km/h) and a minimum barometric pressure of 964 mbar (hPa; 28.47 inHg) about 640 miles (1,035 km) southwest of the southern tip of the Baja California Peninsula.[12]
July 4
- 06:00 UTC (11:00 p.m. PDT, July 3) – Emilia's remnants dissipate more than 1,495 miles (2,410 km) west of the southern tip of Baja California.[11]
- 18:00 UTC (11:00 a.m. PDT) at 17.4°N 121.0°W – Hurricane Fabio weakens to a Category 1 hurricane roughly 810 miles (1,300 km) west-southwest of the southern tip of the Baja California Peninsula.[12]
July 5
- 06:00 UTC (11:00 p.m. PDT, July 4) at 19.0°N 123.4°W – Hurricane Fabio weakens to a tropical storm approximately 905 miles (1,455 km) west-southwest of the southern tip of the Baja California Peninsula.[12]
July 6
- 06:00 UTC (11:00 p.m. PDT, July 5) at 21.3°N 128.5°W – Tropical Storm Fabio degenerates to a post-tropical cyclone about 1,190 miles (1,910 km) west of the southern tip of the Baja California Peninsula.[12]
July 9
- 12:00 UTC (5:00 a.m. PDT) – Fabio's remnants dissipate more than 1,840 miles (2,960 km) west of the southern tip of the Baja California Peninsula.[12]
July 26
- 12:00 UTC (5:00 a.m. PDT) at 13.0°N 121.6°W – Tropical Depression Eight-E forms roughly 1,035 miles (1,665 km) southwest of the southern tip of Baja California.[13]
- 18:00 UTC (11:00 a.m. PDT) at 13.4°N 123.2°W – Tropical Depression Eight-E intensifies into Tropical Storm Gilma approximately 1,085 miles (1,745 km) west-southwest of the southern tip of Baja California.[13]
- 18:00 UTC (11:00 a.m. PDT) at 10.9°N 135.0°W – Tropical Depression Nine-E forms roughly 1,435 miles (2,315 km) east-southeast of Hilo, Hawaii.[14]
July 27
- 06:00 UTC (11:00 p.m. PDT, July 26) at 14.2°N 126.3°W – Tropical Storm Gilma reaches peak intensity with winds of 45 mph (75 km/h) and a pressure of 1005 mbar (hPa; 29.68 inHg), while located approximately 1,210 miles (1,945 km) west-southwest of the southern tip of Baja California.[13]
- 18:00 UTC (11:00 a.m. PDT) at 14.7°N 129.2°W – Tropical Storm Gilma weakens into a tropical depression approximately 1,375 miles (2,215 km) west-southwest of the southern tip of Baja California.[13]
July 28
- 00:00 UTC (5:00 p.m. PDT, July 27) – Tropical Depression Nine-E dissipates roughly 1,210 miles (1,945 km) southeast of Hilo, Hawaii.[14]
July 29
- 12:00 UTC (5:00 a.m. PDT) at 16.1°N 137.9°W – Tropical Depression Gilma degenerates to a remnant low roughly 1,150 miles (1,850 km) east of Hilo, Hawaii.[13]
July 31
- 12:00 UTC (5:00 a.m. PDT) at 12.3°N 115.1°W – Tropical Depression Ten-E develops from an area of low pressure about 805 miles (1,295 km) southwest of the southern tip of Baja California.[15]
August
August 1
- 00:00 UTC (5:00 p.m. PDT, July 31) – Gilma's remnants dissipate while located roughly 405 miles (650 km) southeast of Hilo, Hawaii.[13]
- 00:00 UTC (5:00 p.m. PDT, July 31) at 13.0°N 117.6°W – Tropical Depression Ten-E intensifies into Tropical Storm Hector approximately 845 miles (1,360 km) southwest of the southern tip of Baja California.[15]
August 2
- 12:00 UTC (5:00 a.m. PDT) at 14.2°N 123.9°W – Tropical Storm Hector intensifies into a Category 1 hurricane approximately 1,090 miles (1,750 km) west-southwest of the southern tip of Baja California.[15]
- 18:00 UTC (11:00 a.m. PDT) at 14.1°N 125.8°W – Hurricane Hector intensifies into a Category 2 hurricane while located roughly 1,155 miles (1,860 km) west-southwest of the southern tip of Baja California.[15]
August 3
- 12:00 UTC (5:00 a.m. PDT) at 14.1°N 128.3°W – Hurricane Hector weakens to a Category 1 hurricane while located roughly 1,340 miles (2,160 km) west-southwest of the southern tip of Baja California.[15]
- 18:00 UTC (11:00 a.m. PDT) at 14.1°N 129.3°W – Hurricane Hector re-intensifies into a Category 2 hurricane while located roughly 1,400 miles (2,255 km) west-southwest of the southern tip of Baja California.[15]
August 4
- 00:00 UTC (5:00 p.m. PDT, August 3) at 14.2°N 130.3°W – Hurricane Hector intensifies into a Category 3 hurricane approximately 1,455 miles (2,345 km) west-southwest of the southern tip of Baja California.[15]
- 18:00 UTC (1:00 p.m. CDT) at 12.3°N 94.5°W – Tropical Depression Eleven-E forms from an area of low pressure approximately 270 miles (435 km) south-southeast of Puerto Angel, Oaxaca.[16]
August 5
- 12:00 UTC (5:00 a.m. CDT) at 13.3°N 97.1°W – Tropical Depression Eleven-E intensifies into Tropical Storm Ileana approximately 170 miles (275 km) south-southeast of Puerto Angel, Oaxaca.[16]
- 12:00 UTC (7:00 a.m. CDT) at 13.7°N 105.0°W – Tropical Depression Twelve-E forms while located roughly 335 mi (540 km) south-southwest of Punta San Telmo, Michoacán.[17]
- 18:00 UTC (11:00 a.m. PDT) at 14.4°N 138.0°W – Hurricane Hector intensifies into a Category 4 hurricane approximately 1,250 miles (2,015 km) east-southeast of South Point, Hawaii.[15]
August 6
- 00:00 UTC (6:00 p.m. MDT, August 5) at 14.5°N 106.3°W – Tropical Depression Twelve-E intensifies into Tropical Storm John while located roughly 325 mi (525 km) southwest of Punta San Telmo, Michoacán.[17]
- 06:00 UTC (08:00 p.m. HST August 5) at 14.7°N 139.9°W – Hurricane Hector enters the Central Pacific Hurricane Center's (CPHC) area of responsibility.[15]
- 12:00 UTC (5:00 a.m. CDT) at 15.8°N 101.2°W – Tropical Storm Ileana peaks with winds of 65 mph (100 km/h) and a pressure of 998 mbar (29.47 inHg) approximately 170 miles (490 km) southeast of Manzanillo, Mexico.[16]
- 18:00 UTC (08:00 a.m. PDT) at 15.1°N 142.5°W – Hurricane Hector reaches peak intensity with winds of 155 mph (250 km/h) and a pressure of 936 mbar (27.64 inHg) approximately 890 miles (1,430 km) east-southeast of Hilo, Hawaii.[15]
- 18:00 UTC (11:00 a.m. PDT) at 15.9°N 107.9°W – Tropical Storm John intensifies into a Category 1 hurricane while located roughly 310 mi (500 km) southwest of Punta Pérula, Jalisco.[17]
- 18:00 UTC (11:00 p.m. PDT) at 14.8°N 122.6°W – Tropical Depression Thirteen-E forms while located roughly 960 mi (1,545 km) southwest of Cabo San Lázaro, Baja California Sur.[18]
August 7
- 00:00 UTC (5:00 p.m. PDT, August 6) at 14.6°N 123.6°W – Tropical Depression Thirteen-E intensifies into Tropical Storm Kristy while located roughly 1,015 mi (1,635 km) southwest of Cabo San Lázaro, Baja California Sur.[18]
- 12:00 UTC (5:00 a.m. CDT) – Tropical Storm Ileana is absorbed by Hurricane John.[16]
- 12:00 UTC (6:00 a.m. MDT) at 17.7°N 109.5°W – Hurricane John intensifies into a Category 2 hurricane while located roughly 310 mi (500 km) southwest of Cabo Corrientes, Jalisco.[17]
- 18:00 UTC (12:00 p.m. MDT) at 18.3°N 110.1°W – Hurricane John reaches peak intensity with maximum sustained winds of 110 mph (175 km/h) and a minimum pressure of 964 mbar (28.5 inHg) while located roughly 315 mi (505 km) south of Cabo San Lucas, Baja California Sur.[17]
August 8
- 06:00 UTC (12:00 a.m. MDT) at 19.6°N 111.5°W – Hurricane John weakens into a Category 1 hurricane while located roughly 245 mi (395 km) south-southwest of Cabo San Lucas, Baja California Sur.[17]
- 12:00 UTC (02:00 a.m. HST) at 16.4°N 153.2°W – Hurricane Hector weakens into a Category 3 hurricane approximately 260 miles (420 km) south-southeast of Hilo, Hawaii.[15]
August 9
- 12:00 UTC (5:00 a.m. PDT) at 23.9°N 116.7°W – Hurricane John weakens into a tropical storm while located roughly 275 mi (445 km) southwest of Punta Abreojos, Baja California Sur.[17]
August 10
- 06:00 UTC (11:00 p.m. PDT, August 9) at 17.8°N 129.9°W – Tropical Storm Kristy reaches peak intensity with maximum sustained winds of 70 mph (110 km/h) and a minimum pressure of 991 mbar (29.3 inHg) while located roughly 1,170 mi (1,885 km) west-southwest of Punta Eugenia, Baja California Sur.[18]
- 06:00 UTC (08:00 p.m. HST, August 9) at 17.2°N 163.7°W – Hurricane Hector re-strengthens into a Category 4 hurricane approximately 385 miles (620 km) east of Johnston Island.[15]
- 18:00 UTC (11:00 p.m. PDT) at 26.3°N 120.3°W – Tropical Storm John degenerates into a remnant low while located roughly 340 mi (545 km) west-southwest of Punta Eugenia, Baja California Sur.[17]
.jpg.webp)
August 11
- 06:00 UTC (08:00 p.m. HST, August 10) at 17.2°N 163.7°W – Hurricane Hector weakens into a Category 3 hurricane approximately 130 miles (215 km) north-northeast of Johnston Island.[15]
- 12:00 UTC (5:00 a.m. PDT) at 21.7°N 131.2°W – Tropical Storm Kristy weakens into a tropical depression while located roughly 1,095 mi (1,760 km) southwest of Point Conception, California.[18]
- 18:00 UTC (08:00 a.m. HST) at 19.6°N 170.4°W – Hurricane Hector weakens into a Category 2 hurricane approximately 210 miles (335 km) north-northwest of Johnston Island.[15]
August 12
- 12:00 UTC (02:00 a.m. HST) at 22.4°N 173.6°W – Hurricane Hector weakens into a Category 1 hurricane approximately 320 miles (520 km) southeast of Midway Island.[15]
- 12:00 UTC (5:00 a.m. PDT) at 22.4°N 132.4°W – Tropical Depression Kristy degenerates into a remnant low while located roughly 1,100 mi (1,770 km) southwest of Point Conception, California.[18]
August 13
- 00:00 UTC (02:00 p.m. HST, August 12) at 24.2°N 176.4°W – Hurricane Hector weakens into a tropical storm approximately 285 miles (455 km) south-southeast of Midway Island.[15]
- 00:00 UTC (5:00 p.m. PDT August 6) at 22.4°N 133.4°W – Kristy's remnants dissipate roughly 1,140 mi (1,835 km) southwest of Point Conception, California.[18]
- 18:00 UTC (11:00 p.m. PDT) at 26.3°N 120.3°W – John's remnants dissipate roughly 365 mi (585 km) west-southwest of San Quintín, Baja California.[17]
- 18:00 UTC (08:00 a.m. HST) at 25.1°N 179.5°W – Hurricane Hector crosses the International Dateline and enters the Japan Meteorological Agency's area of responsibility.[15]
August 14
- 00:00 UTC (5:00 p.m. PDT) at 11.0°N 120.6°W – Tropical Depression Fourteen-E forms 1,075 mi (1,730 km) southwest of the southern tip of the Baja California peninsula.[19]
- 12:00 UTC (5:00 a.m. PDT) at 10.7°N 122.8°W – Tropical Depression Fourteen-E strengthens into Tropical Storm Lane 1,195 miles (1,925 km) southwest of the southern tip of the Baja California peninsula.[19]
September
September 1
- 00:00 UTC (5:00 p.m. PDT, August 31) at 14.3°N 107.8°W – Tropical Depression Seventeen-E forms about 365 mi (590 km) southeast of Socorro Island.[22]
- 17:30 UTC (7:30 a.m. HST) at 37.2°N 177.8°W – An upper-level low—designated Invest 96C[23]—that absorbed the remnants of Hurricane Lane transitions into a tropical or subtropical cyclone approximately 1,015 mi (1,635 km) south of Adak, Alaska.[24][23] While the system was assessed as subtropical by the Central Pacific Hurricane Center,[24] the National Oceanic and Atmospheric Administration's Satellite Products and Service Division analyzed it as a tropical storm through the Dvorak technique.[23]
- 23:30 UTC (1:30 p.m. HST) at 38.7°N 178.1°W – Scatterometer data reveals Invest 96C to have attained peak winds of 45 mph (75 km/h) about 980 mi (1,575 km) south of Adak, Alaska.[37]
September 2
- 00:00 UTC (5:00 p.m. PDT, September 1) at 15.4°N 111.2°W – Tropical Depression Seventeen-E strengthens into Tropical Storm Olivia about 230 mi (370 km) south of Socorro Island.[22]
- 17:30 UTC (7:30 a.m. HST) at 40.6°N 177.1°W – Dvorak assessments of Invest 96C indicate it to have weakened to a tropical depression about 780 mi (1,255 km) south of Adak, Alaska.[38]
September 3
- 5:30 UTC (7:30 p.m. HST, September 2) at 42.6°N 178.3°W – The Satellite Products and Service Division issues its final bulletin on Invest 96C as Dvorak assessments indicate the system to be too weak to classify as a tropical cyclone about 645 mi (1,040 km) south of Adak, Alaska.[25]
September 4
- 00:00 UTC (5:00 p.m. PDT, September 3) at 16.8°N 115.6°W – Tropical Storm Olivia intensifies into a Category 1 hurricane approximately 120 mi (195 km) southwest of Clarion Island.[22]
- 12:00 UTC (5:00 a.m. PDT) at 16.9°N 117.6°W – Hurricane Olivia rapidly intensifies into a Category 2 hurricane about 215 mi (345 km) west-southwest of Clarion Island.[22]
- 18:00 UTC (11:00 a.m. PDT) at 16.8°N 118.6°W – Hurricane Olivia rapidly intensifies into a Category 3 hurricane about 275 mi (440 km) west-southwest of Clarion Island.[22]
September 5
- 00:00 UTC (5:00 p.m. PDT, September 4) at 16.8°N 119.6°W – Hurricane Olivia reaches its initial peak intensity with winds of 125 mph (205 km/h) and a pressure of 954 mbar (hPa; 28.17 inHg) approximately 335 mi (540 km) west-southwest of Clarion Island.[22]
- 12:00 UTC (5:00 a.m. PDT) at 17.0°N 121.8°W – Increasing wind shear causes Hurricane Olivia to weaken to a Category 2 hurricane approximately 470 mi (760 km) west-southwest of Clarion Island.[22]
September 6
- 12:00 UTC (5:00 a.m. PDT) at 18.1°N 126.6°W – Hurricane Olivia unexpectedly re-intensifies into a Category 3 hurricane approximately 780 mi (1,255 km) west of Clarion Island.[22]
September 7
- 00:00 UTC (5:00 p.m. PDT, September 6) at 18.9°N 129.2°W – Hurricane Olivia further intensifies into a Category 4 hurricane and reaches its peak intensity with maximum winds of 130 mph (215 km/h) and a pressure of 951 mbar (hPa; 28.08 inHg) about 950 mi (1,525 km) west of Clarion Island.[22]
- 06:00 UTC (11:00 p.m. PDT, September 6) at 19.4°N 130.5°W – Hurricane Olivia weakens to a Category 3 hurricane about 1,035 mi (1,665 km) west-northwest of Clarion Island.[22]
- 12:00 UTC (5:00 a.m. PDT) at 19.9°N 131.8°W – Hurricane Olivia further weakens to a Category 2 hurricane approximately 1,120 mi (1,800 km) west-northwest of Clarion Island.[22]
September 8
- 06:00 UTC (11:00 p.m. PDT, September 7) at 21.1°N 135.9°W – Hurricane Olivia weakens to a Category 1 hurricane about 1,250 mi (2,010 km) east-northeast of Hilo, Hawaii.[22]
- 06:00 UTC (12:00 a.m. MDT) at 15.5°N 114.5°W – Tropical Depression Eighteen-E develops from an area of low pressure about 680 mi (1,095 km) south-southwest of the southern tip of Baja California Sur.[26]
September 9
- 00:00 UTC (2:00 p.m. HST, September 8) at 21.8°N 140.2°W – Hurricane Olivia enters the Central Pacific Hurricane Center's area of responsibility.[22]
- 00:00 UTC (5:00 p.m. PDT, September 8) at 16.0°N 117.0°W – Tropical Depression Eighteen-E strengthens into Tropical Storm Paul roughly 220 mi (355 km) southwest of Clairon Island.[26]
- 18:00 UTC (11:00 a.m. PDT) at 18.1°N 118.6°W – Tropical Storm Paul achieves its peak intensity with winds of 45 mph (75 km/h) and a pressure of 1002 mbar (29.59 inHg) about 250 mi (400 km) west of Clairon Island.[26]
September 11
- 06:00 UTC (8:00 p.m. HST, September 10) at 21.9°N 149.8°W – Hurricane Olivia weakens to a tropical storm approximately 375 mi (605 km) northeast of Hilo, Hawaii.[22]
- 06:00 UTC (11:00 a.m. PDT, September 10) at 21.8°N 122.6°W – Tropical Storm Paul weakens to a tropical depression about 560 mi (900 km) northwest of Clairon Island.[26]
September 12
- 00:00 UTC (5:00 p.m. PDT, September 11) at 22.3°N 126.0°W – Tropical Depression Paul degenerates into a remnant low approximately 780 mi (1,255 km) west-northwest of Clairon Island.[26]
- 19:10 UTC (9:10 a.m. HST) at 21.0°N 156.6°W – Tropical Storm Olivia makes landfall on the Hawaiian island of Maui, just northwest of Kahului, with winds of 45 mph (75 km/h).[22] This marks the first known instance of a tropical cyclone making landfall on the island.[2][39]
- 19:54 UTC (9:54 a.m. HST) at 20.9°N 157.0°W – After crossing the ʻAuʻau Channel, Tropical Storm Olivia makes a second landfall just northwest of Lanai City, Lanai with winds of 45 mph (75 km/h).[22] This is also marks the first time a tropical cyclone made landfall on the island.[2][39]
September 13
- 06:00 UTC (8:00 p.m. HST, September 12) at 20.1°N 159.8°W – Tropical Storm Olivia weakens to a tropical depression about 150 mi (240 km) southwest of Honolulu, Hawaii.[22]
- 18:00 UTC (8:00 a.m. HST) at 19.0°N 162.5°W – Tropical Depression Olivia briefly reorganizes into a tropical storm about 340 mi (550 km) southwest of Honolulu, Hawaii.[22]
September 14
- 06:00 UTC (8:00 p.m. HST, September 13) at 18.9°N 164.9°W – Tropical Storm Olivia degenerates into a remnant low about 485 mi (785 km) southwest of Honolulu, Hawaii.[22]
- 18:00 UTC (8:00 a.m. HST) – The remnants of Olivia degenerate into a trough, marking its dissipation.[22]
September 15
- 00:00 UTC (5:00 p.m. PDT, September 14) – The remnants of Tropical Storm Paul dissipate over the open ocean.[26]
September 19
- 12:00 UTC (6:00 a.m. MDT) at 26.1°N 111.3°W – Tropical Depression Nineteen-E develops from an elongated trough just east of Loreto, Baja California Sur over the Gulf of California. This marks the first known instance of a tropical cyclone forming within the Gulf of California since the National Hurricane Center's records began in 1949.[27]
September 20
- 00:00 UTC (8:00 p.m. MDT, September 19) at 27.3°N 110.9°W – Tropical Depression Nineteen-E reaches its peak intensity with winds of 35 mph (55 km/h) and a pressure of 1002 mbar (29.6 inHg) about 60 mi (95 km) west-southwest of Ciudad Obregón. The National Hurricane Center noted in its final report that the system may have briefly become a tropical storm before landfall but data were inconclusive.[27]
- 03:00 UTC (11:00 p.m. MDT, September 19) at 27.6°N 110.6°W – Tropical Depression Nineteen-E makes landfall at peak strength between Ciudad Obregón and Guaymas.[27]
- 06:00 UTC (2:00 a.m. MDT) – Tropical Depression Nineteen-E rapidly dissipates over mountainous terrain about 50 mi (80 km) east of Guaymas.[27]
September 29
- 12:00 UTC (2:00 a.m. HST) at 11.7°N 157.1°W – A tropical depression develops approximately 505 mi (815 km) south-southwest of Ka Lae, Hawaii.[30][nb 8]
- 18:00 UTC (8:00 a.m. HST) at 11.6°N 158.6°W – The tropical depression intensifies into Tropical Storm Walaka about 540 mi (870 km) south-southwest of Ka Lae, Hawaii.[30]
September 30
- 18:00 UTC (8:00 a.m. HST) at 11.6°N 164.5°W – Tropical Storm Walaka strengthens into a Category 1 hurricane about 800 mi (1,285 km) south-southwest of Honolulu, Hawaii.[30]
October
October 1
- 06:00 UTC (8:00 p.m. HST, September 30) at 11.8°N 167.1°W – Hurricane Walaka rapidly intensifies into a Category 2 hurricane about 895 mi (1,440 km) southwest of Honolulu, Hawaii.[30]
- 12:00 UTC (2:00 a.m. HST) at 12.0°N 168.0°W – Hurricane Walaka rapidly intensifies into a Category 3 hurricane about 925 mi (1,490 km) southwest of Honolulu, Hawaii.[30]
- 18:00 UTC (8:00 a.m. HST) at 12.5°N 168.8°W – Hurricane Walaka rapidly intensifies into a Category 4 hurricane about 885 mi (1,425 km) southwest of Kauai, Hawaii.[30]
October 2
- 00:00 UTC (2:00 p.m. HST, October 1) at 12.9°N 169.6°W – Hurricane Walaka's rapid intensification culminates with it becoming a Category 5 hurricane about 905 mi (1,455 km) southwest of Kauai, Hawaii. Concurrently, it reaches its peak intensity with maximum winds of 160 mph (260 km/h) and a minimum pressure of 921 mbar (hPa; 27.20 inHg).[30]
October 14
- 12:00 UTC (7:00 a.m. CDT) at 17.0°N 102.8°W – Tropical Depression Twenty-Two-E forms while located roughly 75 mi (120 km) south-southwest of Lázaro Cárdenas, Michoacán.[31]
October 15
- 06:00 UTC (1:00 a.m. CDT) at 17.6°N 104.1°W – Tropical Depression Twenty-Two-E intensifies into Tropical Storm Tara while located roughly 65 mi (105 km) southwest of Punta San Telmo, Michoacán.[31]
October 16
- 00:00 UTC (7:00 p.m. CDT, October 15) at 18.4°N 104.3°W – Tropical Storm Tara reaches peak intensity with maximum sustained winds of 65 mph (100 km/h) and a minimum pressure of 995 mbar (29.4 inHg) while located roughly 45 mi (70 km) south of Manzanillo, Colima.[31]
- 18:00 UTC (1:00 p.m. CDT) at 18.9°N 104.9°W – Tropical Storm Tara dissipates roughly 40 mi (65 km) west-southwest of Manzanillo, Colima.[31]
October 19
- 06:00 UTC (1:00 a.m. CDT) at 13.1°N 91.7°W – Tropical Depression Twenty-Three-E forms while located roughly 90 mi (145 km) west-southwest of Puerto San Jose, Guatemala.[32]
- 18:00 UTC (1:00 p.m. CDT) at 13.3°N 92.0°W – Tropical Depression Twenty-Three-E intensifies into Tropical Storm Vicente while around 85 mi (135 km) west-southwest of Puerto San Jose, Guatemala.[32]
October 20

- 00:00 UTC (7:00 p.m. CDT, October 19) at 14.8°N 103.6°W – Tropical Depression Twenty-Four-E develops from a broad area of low pressure about roughly 265 mi (425 km) south of Manzanillo, Colima.[33]
- 12:00 UTC (7:00 a.m. CDT) at 14.9°N 105.1°W – Tropical Depression Twenty-Four-E intensifies into Tropical Storm Willa about 290 mi (465 km) south of Manzanillo, Colima.[33]
October 21
- 06:00 UTC (12:00 a.m. MDT) at 16.0°N 106.3°W – Tropical Storm Willa rapidly intensifies into a Category 1 hurricane roughly 245 mi (395 km) south-southwest of Manzanillo, Colima.[33]
- 12:00 UTC (6:00 a.m. MDT) at 16.4°N 106.6°W – Hurricane Willa rapidly intensifies into a Category 2 hurricane roughly 235 mi (380 km) southwest of Manzanillo, Colima.[33]
- 18:00 UTC (12:00 p.m. MDT) at 16.8°N 106.9°W – Hurricane Willa rapidly intensifies into a Category 3 hurricane roughly 230 mi (370 km) southwest of Manzanillo, Colima.[33]
October 22
- 00:00 UTC (6:00 p.m. MDT, October 21) at 17.5°N 107.1°W – Hurricane Willa rapidly intensifies into a Category 4 hurricane roughly 210 mi (340 km) southwest of Manzanillo, Colima.[33]
- 06:00 UTC (12:00 a.m. MDT) at 17.9°N 107.1°W – Hurricane Willa's rapid intensification culminates with it becoming a Category 5 hurricane roughly 200 mi (320 km) west-southwest of Manzanillo, Colima. It reaches its peak intensity at this time with maximum winds of 160 mph (260 km/h) and a pressure of 925 mbar (27.32 inHg).[33] This marks the third time a Pacific hurricane season featured three Category 5 hurricanes since reliable records began, tying the record set in 1994 and 2002.[41]
- 12:00 UTC (6:00 a.m. MDT) at 18.7°N 107.2°W – Hurricane Willa weakens to a Category 4 hurricane approximately 185 mi (300 km) southwest of Puerto Vallarta, Jalisco.[33]
October 23
- 06:00 UTC (12:00 a.m. MDT) at 20.6°N 107.2°W – Hurricane Willa weakens to a Category 3 hurricane roughly 130 mi (210 km) west of Puerto Vallarta, Jalisco.[33]
- 17:45 UTC (11:45 a.m. MDT) – Hurricane Willa passes over the Islas Marías archipelago with maximum winds of 115 mph (185 km/h); its eyewall traverses the islands of San Juanito and María Madre.[33]
October 24
- 01:20 UTC (8:20 p.m. CDT, October 23) at 22.7°N 105.8°W – Hurricane Willa makes landfall with winds of 115 mph (185 km/h) and a pressure of 968 mbar (28.59 inHg) near Palmito del Verde, Sinaloa.[33]
- 06:00 UTC (1:00 a.m. CDT) at 23.8°N 104.6°W – Hurricane Willa rapidly weakens to a tropical storm due to a combination of mountainous terrain and strong wind shear while located about 10 mi (15 km) southeast of Durango City, Durango.[33]
- 12:00 UTC (7:00 a.m. CDT) – Tropical Storm Willa dissipates over northeastern Mexico.[33]
November
November 2
- 12:00 UTC (6:00 a.m. MDT) at 14.2°N 109.9°W – Tropical Depression Twenty-Five-E forms from an area of low pressure about 520 mi (835 km) southwest of Manzanillo, Colima.[34]
November 3
- 00:00 UTC (6:00 p.m. MDT, November 2) at 14.4°N 108.5°W – Tropical Depression Twenty-Five-E strengthens into Tropical Storm Xavier about 425 mi (685 km) southwest of Manzanillo, Colima.[34]
November 4
- 12:00 UTC (6:00 a.m. CST) at 17.4°N 105.3°W – Tropical Storm Xavier reaches peak intensity with winds of 65 mph (100 km/h) and a pressure of 996 mbar (29.41 inHg), about 130 mi (210 km) southwest of Manzanillo, Colima.[34]
November 6
- 00:00 UTC (5:00 p.m. MST, November 5) at 18.9°N 107.2°W – Tropical Storm Xavier degenerates into a remnant low about 250 mi (400 km) east of Socorro Island.[34]
November 9
- 06:00 UTC (11:00 p.m. MST, November 8) – Xavier's remnants dissipate while located more than 345 mi (555 km/h) west-southwest of Socorro Island.[34]
November 30
- The 2018 Pacific hurricane season officially ends.[1]
Notes
- A major hurricane is a storm that ranks as Category 3 or higher on the Saffir–Simpson hurricane wind scale.[4]
- Formation indicates the date when a system became a tropical or subtropical cyclone.
- Dissipation indicates the date when a system ceased being a tropical or subtropical cyclone by way of dissipation, degeneration into a remnant low, or transition into an extratropical cyclone.
- Hurricane Hector moved west of the International Dateline on August 13 and exited the Central Pacific Hurricane Center's area of responsibility. The system ultimately dissipated on August 16.[15]
- Although not officially warned upon, Invest 96C was analyzed as a subtropical cyclone by the Central Pacific Hurricane Center and a tropical cyclone by the National Oceanic and Atmospheric Administration's Satellite Products and Service Division.
- The figures for maximum sustained winds and position estimates are rounded to the nearest 5 units (miles per hour, kilometers per hour, miles, or kilometers), following the convention used in the National Hurricane Center's operational products for each storm. All other units are rounded to the nearest digit.
- The record for earliest tropical cyclone formation in the Eastern Pacific proper as of 2021 is 2020's Tropical Depression One-E on April 25.[36]
- Operationally, the depression that became Hurricane Walaka was not warned upon until 21:00 UTC (11 a.m. HST) by which time it was already a tropical storm.[40] It would have received the designation "One-C" prior to being named.[30]
See also
References
- Christopher W. Landsea; Neal Dorst; Erica Rule (June 2, 2011). "G: Tropical Cyclone Climatology". Hurricane Research Division: Frequently Asked Questions. Atlantic Oceanographic and Meteorological Laboratory. National Oceanic and Atmospheric Administration. G1) When is hurricane season ?. Retrieved May 28, 2018.
- Wood, Kimberly M.; Klotzbach, Philip J.; Collins, Jennifer M.; Schreck, Carl J. (August 2019). "The Record‐Setting 2018 Eastern North Pacific Hurricane Season". Geophysical Research Letters. 46 (16): 10, 072–10, 081. Bibcode:2019GeoRL..4610072W. doi:10.1029/2019GL083657.
- National Hurricane Center; Hurricane Research Division; Central Pacific Hurricane Center. "The Northeast and North Central Pacific hurricane database 1949–2019". United States National Oceanic and Atmospheric Administration's National Weather Service. Retrieved October 1, 2020. A guide on how to read the database is available here.
- Stan Goldenberg (June 1, 2017). "TCFAQ A3) What is a super-typhoon? What is a major hurricane? What is an intense hurricane?". Atlantic Oceanographic and Meteorological Laboratory. Archived from the original on April 26, 2014. Retrieved May 24, 2018.
- Robbie J. Berg (May 28, 2015). Tropical Depression One-E Discussion Number 1 (Report). Miami, Florida: National Hurricane Center. Retrieved May 28, 2018.
- Berg, Robbie (July 12, 2018). Tropical Depression One-E (EP012018) (PDF) (Report). Tropical Cyclone Report. National Hurricane Center. Retrieved March 26, 2019.
- Avila, Lixion A. (July 31, 2018). Hurricane Aletta (EP022018) (PDF) (Report). Tropical Cyclone Report. National Hurricane Center. Retrieved March 26, 2019.
- Blake, Eric S. (October 24, 2018). Hurricane Bud (EP032018) (PDF) (Report). Tropical Cyclone Report. National Hurricane Center. Retrieved March 27, 2019.
- Pasch, Richard J. (December 19, 2018). Tropical Storm Carlotta (EP042018) (PDF) (Report). Tropical Cyclone Report. National Hurricane Center. Retrieved March 28, 2019.
- Beven II, John L. (February 11, 2019). Tropical Storm Daniel (EP052018) (PDF) (Report). Tropical Cyclone Report. National Hurricane Center. Retrieved March 28, 2019.
- Stewart, Stacy R. (August 21, 2018). Tropical Storm Emilia (EP062018) (PDF) (Report). Tropical Cyclone Report. National Hurricane Center. Retrieved March 28, 2019.
- Brown, Daniel P. (November 14, 2018). Hurricane Fabio (EP072018) (PDF) (Report). Tropical Cyclone Report. National Hurricane Center. Retrieved March 28, 2019.
- Cangialosi, John P. (November 6, 2018). Tropical Storm Gilma (EP092018) (PDF) (Report). Tropical Cyclone Report. National Hurricane Center. Retrieved March 28, 2019.
- Zelinsky, David A. (August 24, 2018). Tropical Depression Nine-E (EP092018) (PDF) (Report). Tropical Cyclone Report. National Hurricane Center. Retrieved March 28, 2019.
- Berg, Robbie; Houston, Sam; Birchard, Thomas (July 1, 2019). Hurricane Hector (EP102018) (PDF) (Report). Tropical Cyclone Report. National Hurricane Center and Central Pacific Hurricane Center. Retrieved December 21, 2020.
- Avila, Lixion A. (November 9, 2018). Tropical Storm Ileana (EP112018) (PDF) (Report). Tropical Cyclone Report. National Hurricane Center. Retrieved March 28, 2019.
- Blake, Eric S. (November 20, 2018). Hurricane John (EP120218) (PDF) (Report). Tropical Cyclone Report. National Hurricane Center. Retrieved March 22, 2020.
- Latto, Andrew S.; Pasch, Richard J. (March 6, 2019). Tropical Storm Kristy (EP132018) (PDF) (Report). Tropical Cyclone Report. National Hurricane Center. Retrieved March 22, 2020.
- Beven II, John L.; Wroe, Derek (December 16, 2019). Hurricane Lane (EP142018) (PDF) (Report). Tropical Cyclone Report. National Hurricane Center and Central Pacific Hurricane Center. Retrieved December 21, 2020.
- Stewart, Stacy R.; Jacobson, Chris; Houston, Sam (March 21, 2019). Hurricane Miriam (EP152018) (PDF) (Report). Tropical Cyclone Report. National Hurricane Center and Central Pacific Hurricane Center. Retrieved December 21, 2020.
- Brown, Daniel P.; Powell, Jeff (August 8, 2019). Hurricane Norman (EP162018) (PDF) (Report). Tropical Cyclone Report. National Hurricane Center and Central Pacific Hurricane Center. Retrieved December 21, 2020.
- Cangialosi, John P.; Jelsema, Jon (July 25, 2019). Hurricane Olivia (EP172018) (PDF) (Report). Tropical Cyclone Report. National Hurricane Center and Central Pacific Hurricane Center. Retrieved December 14, 2020.
- Turk, Michael (September 1, 2020). [96C Tropical Cyclone Position at 17:30 UTC on September 1] (Report). National Oceanic and Atmospheric Administration Satellite Products and Service Division. Retrieved December 28, 2020.
- National Weather Service Office in Honolulu, Hawaii [@NWSHonolulu] (August 31, 2018). "Thanks for pointing this out. The circulation that was associated with Lane dissipated several days ago and was absorbed by the same upper level low responsible for this feature. This feature is now a sub-tropical gale low, but we will continue to keep an eye on it!" (Tweet). Retrieved December 28, 2020 – via Twitter.
- Kibler, Jamie (September 3, 2020). [96C Tropical Cyclone Position at 5:30 UTC on September 3] (Report). National Oceanic and Atmospheric Administration Satellite Products and Service Division. Retrieved December 28, 2020.
- Zelinsky, David A. (October 4, 2018). Tropical Storm Paul (EP182018) (PDF) (Report). Tropical Cyclone Report. National Hurricane Center. Retrieved December 21, 2020.
- Berg, Robbie (November 29, 2018). Tropical Depression Nineteen-E (EP192018) (PDF) (Report). Tropical Cyclone Report. National Hurricane Center. Retrieved December 21, 2020.
- Avila, Lixion A. (July 23, 2019). Hurricane Rosa (EP202018) (PDF) (Report). Tropical Cyclone Report. National Hurricane Center. Retrieved December 21, 2020.
- Blake, Eric S. (February 26, 2019). Hurricane Sergio (EP212018) (PDF) (Report). Tropical Cyclone Report. National Hurricane Center. Retrieved December 21, 2020.
- Birchard, Thomas; Houston, Sam (June 9, 2020). Hurricane Walaka (CP012018) (PDF) (Report). Tropical Cyclone Report. Central Pacific Hurricane Center. Retrieved December 16, 2020.
- Pasch, Richard J. (March 28, 2019). Tropical Storm Tara (EP222018) (PDF) (Report). Tropical Cyclone Report. National Hurricane Center. Retrieved December 21, 2020.
- Latto, Andrew S.; Beven II, John L. (April 10, 2019). Tropical Storm Vicente (EP232018) (PDF) (Report). Tropical Cyclone Report. National Hurricane Center. Retrieved December 21, 2020.
- Brennan, Michael J. (April 2, 2019). Hurricane Willa (EP242018) (PDF) (Report). Tropical Cyclone Report. National Hurricane Center. Retrieved December 21, 2020.
- Brown, Daniel P. (February 8, 2019). Tropical Storm Xavier (EP252018) (PDF) (Report). Tropical Cyclone Report. National Hurricane Center. Retrieved March 27, 2019.
- "Tropical Depression One-E Has Started the 2018 Eastern Pacific Hurricane Season Early, But it Won't Threaten Land". The Weather Channel. May 11, 2018. Retrieved December 14, 2018.
- Cangialosi, John (June 30, 2020). Tropical Depression One-E (EP012020) (PDF) (Report). Tropical Cyclone Report. Retrieved December 14, 2020.
- Turk, Michael (September 1, 2020). [96C Tropical Cyclone Position at 23:30 UTC on September 1] (Report). National Oceanic and Atmospheric Administration Satellite Products and Service Division. Retrieved December 28, 2020.
- Fisher (September 2, 2020). [96C Tropical Cyclone Position at 17:30 UTC on September 2] (Report). National Oceanic and Atmospheric Administration Satellite Products and Service Division. Retrieved December 28, 2020.
- Gomes, Andrew (September 13, 2018). "Olivia makes brief but historic landfall on Maui". Honolulu Star Advertiser. Archived from the original on September 14, 2018. Retrieved December 14, 2020.
- Wroe, Derek R. (September 29, 2018). Tropical Storm Walaka Advisory Number 1 (Report). Central Pacific Hurricane Center. Retrieved December 28, 2020.
- Sullivan, Brian K. (October 22, 2020). "Hurricane Willa Becomes Category 5 Storm Off Coast of Mexico". Bloomberg News. Retrieved January 1, 2021.
External links
| Wikimedia Commons has media related to 2018 Pacific hurricane season. |
- The National Hurricane Center's advisory archive for 2018
Tropical cyclones of the 2018 Pacific hurricane season | ||
|---|---|---|
| ||
| ||
| Preceded by 2017 |
Pacific hurricane season timelines 2018 |
Succeeded by 2019 |