Urban Employment Area
Urban Employment Area (都市雇用圏, Toshi Koyō-ken) is a definition of metropolitan areas used in Japan, defined by the Center for Spatial Information Service of the University of Tokyo. Japan's Ministry of Economy, Trade and Industry defined 233 areas for the UEAs of Japan.[1] It is different from the definition of metropolitan areas defined in census by the Ministry of Internal Affairs and Communications. For the latter scheme, see the List of metropolitan areas in Japan article.


The basic principle of UEA is similar to that of the Statistics Bureau definition; a central city and its associated outlying municipalities with certain numbers of commuters. A UEA with at least 50,000 DID (Densely Inhabited District) population is called Metropolitan Employment Area (大都市雇用圏, Dai-toshi Koyō-ken) or MEA for short in English. A UEA with at least 10,000 and less than 50,000 DID population is called Micropolitan Employment Area (小都市雇用圏, Shō-toshi Koyō-ken) or McEA for short in English.
Definition
- Central city
- If a municipality has at least 10,000 DID population, and is not a suburb of any other municipalities, it is defined as a central city.
- Even if a municipality is a suburb of another, it can still be defined as a central city. In this case, a municipality must have workers working there more than those living there. It must also have the DID population of at least 10,000, or a third of the population of the central city.
- Suburb
- If a municipality A has more than 10% of its population commuting to a central city B, A is defined as a (primary) suburb of B.
- If there are multiple such cities for a suburb A, the one with the most commuters from A is defined as A's central city.
- If a municipality A has more than 10% of its population commuting to another suburb B, and if no other municipalities have more commuters from A, A is defined as a secondary suburb or lower of B.
- If a municipality A has more than 10% of its population commuting to B and vice versa, the one with the higher percentage of commuters is defined as a suburb of another.
- If a central city comprises multiple municipalities, numbers of commuters to all those municipalities are counted for the calculations above.
Top 100 Urban Employment Areas in Japan
.jpg.webp)

.jpg.webp)


Source: Urban Employment Area (UEA) Code Table, "地域経済の将来動向分析に関する調査研究" [A study on the future trend analysis of the regional economy] (in Japanese).
- W/L here is jūgyō jōjū jinkōhi (従業常住人口比), the ratio of workers in the area, against the number of workers living in the area.
- DID population here is a population of central city. If an area has multiple central cities, only the most populous one among them is counted.
- A 2015 population decrease from 2005 is written in red figures.
- Metropolitan Employment Area (MEA) is listed on white background. Micropolitan Employment Area (McEA) is listed on yellow background.
- Prefectural capital is numbered with blue background.
- 1980 ranks include Kurashiki MEA, which was merged with Okayama MEA in 2000. Those under No. 100 are marked as "-".
| 2015 | 1980 | Name | Pop. (2015) |
Pop. (1980) |
W/L (2015) |
GDP (in billion US$) (2010)[2][3] |
|---|---|---|---|---|---|---|
| 1 | 1 | Tokyo MEA | 35,303,778 | 26,624,003 | 1.72 | 1,797.9 |
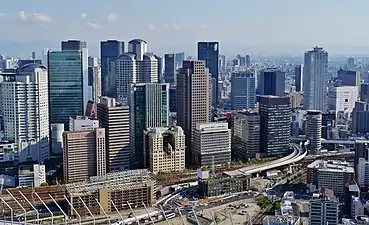
| 2 | 2 | Osaka MEA | 12,078,820 | 11,170,018 | 1.82 | 516.8 |
| 3 | 3 | Nagoya MEA | 6,871,632 | 4,538,832 | 1.23 | 256.3 |
| 4 | 4 | Kyoto MEA | 2,801,044 | 2,361,205 | 1.14 | 115.3 |
| 5 | 6 | Fukuoka MEA | 2,565,501 | 1,773,129 | 1.22 | 101.6 |
| 6 | 5 | Kobe MEA | 2,419,973 | 2,047,561 | 1.03 | 96.0 |
| 7 | 7 | Sapporo MEA | 2,362,914 | 1,751,996 | 1.01 | 84.7 |
| 8 | 10 | Sendai MEA | 1,612,499 | 1,248,616 | 1.11 | 61.7 |
| 9 | 14 | Okayama MEA | 1,526,503 | 750,188 | 1.05 | 63.1 |
| 10 | 9 | Hiroshima MEA | 1,431,634 | 1,327,198 | 1.02 | 61.3 |
| 11 | 8 | Kitakyushu MEA | 1,314,276 | 1,524,747 | 1.04 | 55.7 |
| 12 | 54 | Maebashi MEA | 1,263,034 | 341,331 | 1.07 | 59.8 |
| 13 | 13 | Hamamatsu MEA | 1,129,296 | 825,503 | 0.98 | 54.3 |
| 14 | 12 | Kumamoto MEA | 1,111,596 | 836,892 | 1.02 | 39.8 |
| 15 | 25 | Utsunomiya MEA | 1,103,745 | 547,545 | 1.06 | 50.7 |
| 16 | 32 | Toyama MEA | 1,066,328 | 504,353 | 1.10 | 49.5 |
| 17 | 15 | Niigata MEA | 1,060,013 | 726,983 | 1.01 | 43.3 |
| 18 | 11 | Shizuoka MEA | 988,056 | 966,074 | 1.05 | 45.8 |
| 19 | 79 | Tsukuba MEA | 843,402 | 216,337 | 1.18 | 37.1 |
| 20 | 20 | Naha MEA | 830,532 | 616,010 | 1.24 | 26.8 |
| 21 | 16 | Gifu MEA | 823,219 | 711,981 | 1.03 | 32.2 |
| 22 | 22 | Takamatsu MEA | 819,327 | 592,555 | 1.07 | 34.7 |
| 23 | 24 | Nagasaki MEA | 785,108 | 553,101 | 1.06 | 27.9 |
| 24 | 17 | Himeji MEA | 773,389 | 709,219 | 1.03 | 33.6 |
| 25 | 30 | Fukuyama MEA | 753,528 | 517,514 | 1.00 | 31.5 |
| 26 | 19 | Kanazawa MEA | 747,780 | 626,523 | 1.13 | 31.7 |
| 27 | 21 | Oita MEA | 737,936 | 608,653 | 1.03 | 28.9 |
| 28 | 18 | Kagoshima MEA | 724,236 | 662,737 | 1.02 | 26.4 |
| 29 | 28 | Mito MEA | 687,734 | 532,911 | 1.16 | 30.3 |
| 30 | 27 | Toyohashi MEA | 670,144 | 540,880 | 0.95 | 31.0 |
| 31 | 36 | Tokushima MEA | 659,744 | 478,772 | 1.14 | 28.4 |
| 32 | 39 | Fukui MEA | 646,813 | 454,495 | 1.17 | 28.7 |
| 33 | 26 | Matsuyama MEA | 637,608 | 542,188 | 1.01 | 24.5 |
| 34 | 29 | Yokkaichi MEA | 623,210 | 522,233 | 1.08 | 29.1 |
| 35 | 94 | Ota MEA | 613,825 | 161,945 | 1.16 | 21.6 |
| 36 | 31 | Nagano MEA | 589,549 | 514,136 | 1.06 | 24.9 |
| 37 | 37 | Kofu MEA | 586,986 | 476,543 | 1.22 | 25.2 |
| 38 | 23 | Wakayama MEA | 569,758 | 566,668 | 1.08 | 24.6 |
| 39 | 55 | Koriyama MEA | 544,662 | 341,004 | 1.08 | 20.2 |
| 40 | 40 | Yamagata MEA | 534,571 | 415,965 | 1.10 | 20.0 |
| 41 | 34 | Kochi MEA | 519,390 | 490,401 | 1.04 | 17.5 |
| 42 | 48 | Miyazaki MEA | 502,401 | 356,771 | 1.01 | 18.2 |
| 43 | 66 | Tsu MEA | 499,709 | 280,045 | 1.05 | 23.8 |
| 44 | 35 | Numazu MEA | 497,258 | 487,606 | 1.11 | 22.9 |
| 45 | 56 | Toyota MEA | 484,352 | 340,596 | 1.21 | 28.3 |
| 46 | 45 | Morioka MEA | 470,414 | 382,706 | 1.10 | 17.9 |
| 47 | 53 | Fukushima MEA | 451,044 | 343,063 | 1.06 | 18.0 |
| 48 | 46 | Matsumoto MEA | 447,802 | 371,850 | 1.09 | 18.5 |
| 49 | 44 | Kurume MEA | 431,897 | 384,264 | 0.98 | 16.8 |
| 50 | 60 | Saga MEA | 398,217 | 304,703 | 1.12 | 15.2 |
| 51 | 43 | Akita MEA | 397,801 | 384,718 | 1.08 | 16.0 |
| 52 | 42 | Asahikawa MEA | 388,701 | 394,532 | 1.01 | 14.3 |
| 53 | 52 | Fuji MEA | 387,236 | 345,720 | 1.01 | 18.1 |
| 54 | 68 | Nagaoka MEA | 356,767 | 274,394 | 1.04 | 15.7 |
| 55 | 51 | Iwaki MEA | 350,237 | 347,408 | 0.97 | 13.0 |
| 56 | 47 | Hitachi MEA | 349,111 | 368,405 | 1.16 | 17.2 |
| 57 | 41 | Hakodate MEA | 340,489 | 395,403 | 1.05 | 12.7 |
| 58 | - | Narita MEA | 328,796 | - | 1.51 | 16.7 |
| 59 | 75 | Okinawa MEA | 327,550 | 236,398 | 0.95 | 7.1 |
| 60 | 58 | Hachinohe MEA | 324,451 | 331,608 | 1.08 | 12.5 |
| 61 | 65 | Ogaki MEA | 313,740 | 280,945 | 1.06 | 13.0 |
| 62 | 102 | Yamaguchi MEA | 313,364 | 147,867 | 1.02 | 14.6 |
| 63 | 57 | Aomori MEA | 310,640 | 336,677 | 1.03 | 12.3 |
| 64 | 61 | Sasebo MEA | 298,023 | 304,678 | 1.02 | 11.1 |
| 65 | 67 | Hirosaki MEA | 291,789 | 278,234 | 1.11 | 10.6 |
| 66 | 82 | Matsue MEA | 284,790 | 205,031 | 1.06 | 11.7 |
| 67 | - | Kamisu McEA | 270,079 | - | 1.16 | - |
| 68 | 49 | Shimonoseki MEA | 268,517 | 348,875 | 0.98 | 12.1 |
| 69 | 64 | Shunan MEA | 267,340 | 295,506 | 1.08 | 13.0 |
| 70 | 78 | Obihiro MEA | 263,344 | 221,659 | 1.07 | 9.9 |
| 71 | 59 | Kure MEA | 252,891 | 320,342 | 0.99 | 11.0 |
| 72 | 139 | Nasushiobara McEA | 250,876 | 100,083 | 0.92 | - |
| 73 | 87 | Miyakonojo MEA | 236,290 | 189,065 | 1.08 | 8.5 |
| 74 | 69 | Omuta MEA | 234,581 | 254,723 | 1.08 | 8.6 |
| 75 | 74 | Tottori MEA | 232,610 | 239,972 | 1.06 | 8.4 |
| 76 | 76 | Ube MEA | 232,100 | 229,729 | 0.99 | 10.7 |
| 77 | 70 | Yonago MEA | 231,746 | 246,581 | 1.06 | 8.1 |
| 78 | 77 | Joetsu MEA | 230,186 | 227,947 | 1.00 | 9.9 |
| 79 | - | Higashiomi McEA | 228,704 | - | 0.90 | - |
| 80 | 84 | Niihama MEA | 228,077 | 196,483 | 1.04 | 9.3 |
| 81 | 83 | Aizuwakamatsu MEA | 223,807 | 197,672 | 1.11 | 9.0 |
| 82 | 108 | Komatsu McEA | 222,986 | 141,582 | 1.01 | - |
| 83 | - | Higashihiroshima MEA | 219,333 | - | 0.98 | - |
| 84 | 86 | Oyama MEA | 218,354 | 190,194 | 1.00 | 9.7 |
| 85 | 130 | Sanjo MEA | 215,037 | 109,386 | 1.10 | 9.7 |
| 86 | - | Koga MEA | 212,776 | - | 0.90 | 9.2 |
| 87 | 80 | Ueda McEA | 212,314 | 205,775 | 1.02 | 8.8 |
| 88 | 211 | Osaki McEA | 205,925 | 65,525 | 0.95 | - |
| 89 | 72 | Kushiro MEA | 205,177 | 242,331 | 1.00 | 8.2 |
| 90 | 144 | Nakatsu McEA | 203,101 | 97,817 | 1.05 | - |
| 91 | 122 | Suwa McEA | 198,475 | 114,705 | 1.13 | - |
| 92 | 214 | Kakegawa McEA | 193,943 | 64,843 | 1.04 | - |
| 93 | 85 | Ishinomaki MEA | 193,051 | 194,680 | 1.07 | 7.9 |
| 94 | 184 | Kitakami McEA | 191,213 | 76,633 | 1.09 | - |
| 95 | 96 | Tomakomai MEA | 190,477 | 158,191 | 1.01 | 7.4 |
| 96 | 73 | Muroran MEA | 189,696 | 241,371 | 1.20 | 7.4 |
| 97 | 88 | Iizuka McEA | 189,195 | 188,420 | 1.03 | 7.2 |
| 98 | 170 | Ina McEA | 184,305 | 84,003 | 0.99 | - |
| 99 | 97 | Ise MEA | 183,793 | 157,669 | 0.96 | 7.9 |
| 100 | 104 | Tsuyama McEA | 182,412 | 144,230 | 1.03 | - |
These areas have multiple central cities. Municipal names are as of 2015.
- Tokyo: 8; Special wards of Tokyo, Saitama, Chiba, Tachikawa, Musashino, Yokohama, Kawasaki, and Atsugi.
- Osaka: 4; Osaka, Sakai, Moriguchi, Kadoma, and Higashiosaka.
- Nagoya: 6; Nagoya, Komaki, Tokai, Handa, Kariya, and Anjō.
- Kyoto: 2; Kyoto and Kusatsu.
- Sapporo: 2; Sapporo and Otaru.
- Maebashi: 2; Maebashi and Takasaki
- Naha: 2; Naha and Urasoe.
- Tsukuba: 2; Tsukuba and Tsuchiura.
- Ota: 2; Ota and Oizumi.
- Kamisu: 2; Kamisu and Kashima.
- Nasushiobara: 2; Nasushiobara and Otawara.
- Sanjō: 2; Sanjō and Tsubame.
These areas changed their names between 1980 and 2000, as the most populated central cities have changed.
See also
- List of metropolitan areas in Japan by population
- List of Japanese cities by population
References
- 経済産業省の地域政策におけるエリア概念について (PDF) (Report) (in Japanese). 2014. p. 3.
- Yoshitsugu Kanemoto. "Metropolitan Employment Area (MEA) Data". Center for Spatial Information Science, The University of Tokyo.
- Conversion rates - Exchange rates - OECD Data