1936 Belgian general election
General elections were held in Belgium on 24 May 1936.[1] The result was a victory for the Belgian Labour Party, which won 70 of the 202 seats in the Chamber of Representatives and 39 of the 101 seats in the Senate.[2] Voter turnout was 94.7%.[3]
| |||||||||||||||||||||||||||||||||||||||||||||||||||||||||||||||||||||||||||||||||||||
All 202 seats in the Chamber of Representatives All 101 seats in the Senate | |||||||||||||||||||||||||||||||||||||||||||||||||||||||||||||||||||||||||||||||||||||
|---|---|---|---|---|---|---|---|---|---|---|---|---|---|---|---|---|---|---|---|---|---|---|---|---|---|---|---|---|---|---|---|---|---|---|---|---|---|---|---|---|---|---|---|---|---|---|---|---|---|---|---|---|---|---|---|---|---|---|---|---|---|---|---|---|---|---|---|---|---|---|---|---|---|---|---|---|---|---|---|---|---|---|---|---|---|
| |||||||||||||||||||||||||||||||||||||||||||||||||||||||||||||||||||||||||||||||||||||
| |||||||||||||||||||||||||||||||||||||||||||||||||||||||||||||||||||||||||||||||||||||

.jpg.webp)
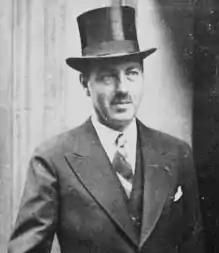
Despite the rise of far-right and far-left parties, Paul van Zeeland continued as Prime Minister leading a government of national unity, composed of the three major parties (Catholics, Socialists and Liberals).
Results
Chamber of Representatives
| Party | Votes | % | Seats | +/– | |
|---|---|---|---|---|---|
| Belgian Labour Party | 758,485 | 32.11 | 70 | –3 | |
| Catholic Party | 653,717 | 27.67 | 61 | –18 | |
| Liberal Party | 292,970 | 12.40 | 23 | –1 | |
| Rexist Party | 271,481 | 11.49 | 21 | New | |
| Flemish National Union | 166,737 | 7.06 | 16 | +8 | |
| Communist Party of Belgium | 143,223 | 6.06 | 9 | +6 | |
| Christian Democratic Party | 22,224 | 0.94 | 2 | New | |
| Other parties | 53,599 | 2.29 | 0 | 0 | |
| Invalid/blank votes | 148,810 | – | – | – | |
| Total | 2,511,246 | 100 | 202 | +15 | |
| Source: Belgian Elections | |||||
Senate
| Party | Votes | % | Seats | +/– | |
|---|---|---|---|---|---|
| Belgian Labour Party | 769,498 | 33.46 | 39 | 0 | |
| Catholic Party | 667,739 | 29.04 | 34 | –8 | |
| Liberal Party | 297,280 | 12.93 | 11 | 0 | |
| Rexist Party | 250,272 | 10.88 | 8 | New | |
| Flemish National Union | 160,212 | 6.97 | 5 | +4 | |
| Communist Party of Belgium | 110,855 | 4.82 | 4 | +4 | |
| Christian Democratic Party | 19,477 | 0.85 | 0 | 0 | |
| Other parties | 24,175 | 1.05 | 0 | 0 | |
| Invalid/blank votes | 209,055 | – | – | – | |
| Total | 2,508,489 | 100 | 101 | +8 | |
| Source: Belgian Elections | |||||
Constituencies
The distribution of seats among the electoral districts of the Chamber of Representatives was as follows.[4] Several arrondissements got one or more additional seats. Roeselare-Tielt lost one seat, which was a rare occurrence since population generally increased throughout the Belgian territory with each census.
| Province | Arrondissement(s) | Seats | Change |
|---|---|---|---|
| Antwerp | Antwerp | 18 | +3 |
| Mechelen | 6 | +1 | |
| Turnhout | 5 | +1 | |
| Limburg | Hasselt | 4 | +1 |
| Tongeren-Maaseik | 5 | +1 | |
| East Flanders | Aalst | 6 | +1 |
| Oudenaarde | 3 | – | |
| Gent-Eeklo | 12 | – | |
| Dendermonde | 4 | – | |
| Sint-Niklaas | 4 | – | |
| West Flanders | Bruges | 4 | – |
| Roeselare-Tielt | 4 | –1 | |
| Kortrijk | 6 | +1 | |
| Ypres | 3 | – | |
| Veurne-Diksmuide-Ostend | 5 | – | |
| Brabant | Leuven | 7 | – |
| Brussels | 30 | +4 | |
| Nivelles | 5 | +1 | |
| Hainaut | Tournai-Ath | 6 | – |
| Charleroi | 11 | – | |
| Thuin | 4 | +1 | |
| Mons | 7 | – | |
| Soignies | 3 | – | |
| Liège | Huy-Waremme | 4 | – |
| Liège | 14 | +1 | |
| Verviers | 5 | – | |
| Luxembourg | Arlon-Marche-Bastogne | 3 | – |
| Neufchâteau-Virton | 3 | – | |
| Namur | Namur | 5 | – |
| Dinant-Philippeville | 4 | – | |
| Total | 202 | +15 | |
References
- Nohlen, Dieter; Stöver, Philip (31 May 2010). Elections in Europe: A data handbook. Nomos Verlagsgesellschaft. p. 289. ISBN 978-3-8329-5609-7.
- Nohlen & Stöver, pp308-310
- Nohlen & Stöver, p290
- List of members of the Chamber of Representatives (1936)
