1977 Belgian general election
General elections were held in Belgium on 17 April 1977.[1] The result was a victory for the Christian People's Party, which won 56 of the 212 seats in the Chamber of Representatives and 28 of the 106 seats in the Senate. Voter turnout was 95.1%.[2] Elections were also held for the nine provincial councils and for the Council of the German Cultural Community.
| |||||||||||||||||||||||||||||||||||||||||||||||||||||||||||||||||||||||||||||||||||||
212 seats in the Chamber of Representatives | |||||||||||||||||||||||||||||||||||||||||||||||||||||||||||||||||||||||||||||||||||||
|---|---|---|---|---|---|---|---|---|---|---|---|---|---|---|---|---|---|---|---|---|---|---|---|---|---|---|---|---|---|---|---|---|---|---|---|---|---|---|---|---|---|---|---|---|---|---|---|---|---|---|---|---|---|---|---|---|---|---|---|---|---|---|---|---|---|---|---|---|---|---|---|---|---|---|---|---|---|---|---|---|---|---|---|---|---|
| |||||||||||||||||||||||||||||||||||||||||||||||||||||||||||||||||||||||||||||||||||||
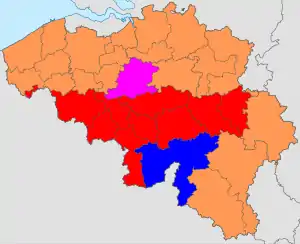 Colours denote the winning party in each electoral district (for the Chamber of Deputies).
a Whilst still technically the same party in this election, for the first time the Walloon and Flemish sections of the party ran candidates separately. | |||||||||||||||||||||||||||||||||||||||||||||||||||||||||||||||||||||||||||||||||||||
| |||||||||||||||||||||||||||||||||||||||||||||||||||||||||||||||||||||||||||||||||||||
%252C_Bestanddeelnr_933-5684.jpg.webp)

 |
|---|
| This article is part of a series on the politics and government of Belgium |
Results
Chamber of Deputies
| Party | Votes | % | Seats | +/– |
|---|---|---|---|---|
| Christian People's Party | 1,460,757 | 26.20 | 56 | +6 |
| Belgian Socialist Party (Flanders) | 725,513 | 13.01 | 27 | New |
| Belgian Socialist Party | 602,132 | 10.80 | 34 | New |
| People's Union | 559,567 | 10.04 | 20 | –2 |
| Party for Freedom and Progress | 475,917 | 8.54 | 17 | New |
| Christian Social Party | 406,694 | 7.29 | 24 | +2 |
| Democratic Front of the Francophones | 263,104 | 4.72 | 11 | New |
| Liberal Reformist Party | 191,196 | 3.34 | 16 | New |
| Belgian Socialist Party (Wallonia) | 145,771 | 2.61 | 0 | 0 |
| PSC-CSP | 138,361 | 2.48 | 0 | New |
| Walloon Rally | 132,773 | 2.38 | 4 | –7 |
| PLRW/PRF | 107,015 | 1.92 | 0 | New |
| PLRW-PL | 92,178 | 1.65 | 0 | New |
| Communist Party of Belgium | 62,410 | 1.12 | 0 | –2 |
| PCB-UDP | 51,930 | 0.93 | 0 | New |
| Community Party (Wallonia) | 37,104 | 0.67 | 2 | New |
| PSB-RW | 33,598 | 0.60 | 1 | New |
| AMADA | 22,919 | 0.41 | 0 | New |
| ECOLOG | 11,839 | 0.21 | 0 | New |
| RAL | 8,562 | 0.15 | 0 | New |
| Party of German-speaking Belgians | 7,735 | 0.14 | 0 | 0 |
| PLPW | 5,220 | 0.09 | 0 | New |
| ECOLOG-PBNZ | 4,321 | 0.08 | 0 | New |
| Ecolo | 3,834 | 0.07 | 0 | New |
| LRT-RAL | 3,127 | 0.06 | 0 | New |
| LRT | 2,905 | 0.05 | 0 | New |
| AGALEV | 2,435 | 0.04 | 0 | New |
| FFF | 2,099 | 0.04 | 0 | New |
| TPO | 1,980 | 0.04 | 0 | New |
| CPC/URB | 1,547 | 0.03 | 0 | New |
| PRF | 1,514 | 0.03 | 0 | New |
| RLiège | 1,421 | 0.03 | 0 | 0 |
| UB | 1,083 | 0.02 | 0 | New |
| FNP | 994 | 0.02 | 0 | New |
| VFP | 967 | 0.02 | 0 | New |
| KAGANO | 884 | 0.02 | 0 | New |
| COLOGIQUE | 777 | 0.01 | 0 | New |
| EW | 605 | 0.01 | 0 | New |
| PCBML | 533 | 0.01 | 0 | New |
| VOP | 443 | 0.01 | 0 | New |
| VB77 | 377 | 0.01 | 0 | New |
| UCMLB | 222 | 0.00 | 0 | New |
| UC-MEUNIER | 199 | 0.00 | 0 | New |
| PORT | 175 | 0.00 | 0 | New |
| PP | 169 | 0.00 | 0 | New |
| POE | 152 | 0.00 | 0 | New |
| Invalid/blank votes | 431,153 | – | – | – |
| Total | 6,006,211 | 100 | 212 | 0 |
| Source: Belgian Elections | ||||
Senate
| Party | Votes | % | Seats | +/– |
|---|---|---|---|---|
| Christian People's Party | 1,446,806 | 26.18 | 28 | +1 |
| Belgian Socialist Party (Wallonia) | 756,401 | 13.69 | 19 | New |
| Belgian Socialist Party (Flanders) | 719,533 | 13.02 | 12 | New |
| People's Union | 562,894 | 10.19 | 10 | 0 |
| Christian Social Party | 522,613 | 9.46 | 11 | +1 |
| Party for Freedom and Progress | 472,645 | 8.55 | 9 | New |
| Liberal Reformist Party | 316,292 | 5.72 | 7 | New |
| Democratic Front of the Francophones | 546,367 | 4.46 | 6 | New |
| Walloon Rally | 158,642 | 2.87 | 2 | New |
| Communist Party of Belgium | 108,000 | 1.95 | 1 | 0 |
| PL | 70,458 | 1.28 | 0 | New |
| PCB-UDP | 50,749 | 0.92 | 0 | New |
| BSP-RW | 33,945 | 0.61 | 1 | New |
| AMADA-TPO | 27,693 | 0.50 | 0 | New |
| Party of German-speaking Belgians | 10,213 | 0.18 | 0 | 0 |
| Ecolo | 7,558 | 0.14 | 0 | New |
| PLPW | 5,305 | 0.10 | 0 | New |
| VFP-PFU | 3,413 | 0.06 | 0 | New |
| AGALEV | 3,270 | 0.06 | 0 | New |
| UB | 1,182 | 0.02 | 0 | New |
| VOP | 896 | 0.02 | 0 | New |
| LRT-RAL | 387 | 0.01 | 0 | New |
| URB | 207 | 0.00 | 0 | New |
| Invalid/blank votes | 486,091 | – | – | – |
| Total | 6,012,062 | 100 | 106 | 0 |
| Source: Belgian Elections | ||||
References
- Dieter Nohlen & Philip Stöver (2010) Elections in Europe: A data handbook, p289 ISBN 978-3-8329-5609-7
- Nohlen & Stöver, p291
This article is issued from Wikipedia. The text is licensed under Creative Commons - Attribution - Sharealike. Additional terms may apply for the media files.
