1981 Belgian general election
General elections were held in Belgium on 8 November 1981.[1] Voter turnout was 94.5% in the Chamber election and 94.6% in the Senate election.[2] Elections were also held for the nine provincial councils and for the Council of the German Cultural Community. They were the first elections after the voting age was lowered from 21 to 18. This contributed to the success of the socialist parties and the green parties (Agalev and Ecolo). The traditionally largest Christian People's Party saw significant losses, with only 43 of the 212 seats in the Chamber of Representatives.
| |||||||||||||||||||||||||||||||||||||||||||||||||||||||||||||||||||||||||||||||||||||
212 seats in the Chamber of Representatives | |||||||||||||||||||||||||||||||||||||||||||||||||||||||||||||||||||||||||||||||||||||
|---|---|---|---|---|---|---|---|---|---|---|---|---|---|---|---|---|---|---|---|---|---|---|---|---|---|---|---|---|---|---|---|---|---|---|---|---|---|---|---|---|---|---|---|---|---|---|---|---|---|---|---|---|---|---|---|---|---|---|---|---|---|---|---|---|---|---|---|---|---|---|---|---|---|---|---|---|---|---|---|---|---|---|---|---|---|
| |||||||||||||||||||||||||||||||||||||||||||||||||||||||||||||||||||||||||||||||||||||
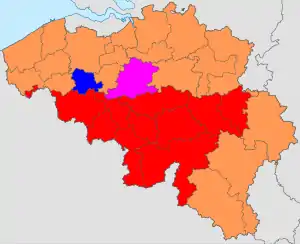 Colours denote the winning party in each electoral district (for the Chamber of Deputies). | |||||||||||||||||||||||||||||||||||||||||||||||||||||||||||||||||||||||||||||||||||||
| |||||||||||||||||||||||||||||||||||||||||||||||||||||||||||||||||||||||||||||||||||||

%252C_Bestanddeelnr_918-9461.jpg.webp)
%252C_Bestanddeelnr_933-5684.jpg.webp)


 |
|---|
| This article is part of a series on the politics and government of Belgium |
Results
Chamber of Deputies
| Party | Votes | % | Seats | +/– |
|---|---|---|---|---|
| Christian People's Party | 1,165,239 | 19.34 | 43 | –14 |
| Party for Freedom and Progress | 776,871 | 12.89 | 28 | +6 |
| Parti Socialiste | 733,137 | 12.17 | 35 | +4 |
| Socialistische Partij | 744,593 | 12.36 | 26 | 0 |
| People's Union | 588,436 | 9.77 | 20 | +6 |
| Liberal Reformist Party | 480,380 | 7.97 | 24 | +9 |
| Social Christian Party | 390,896 | 6.49 | 18 | –7 |
| FDF-RW | 253,720 | 4.21 | 8 | –3 |
| Agalev | 138,575 | 2.30 | 2 | +2 |
| Ecolo | 132,312 | 2.20 | 2 | +2 |
| UDRT/RAD | 130,526 | 2.17 | 3 | +2 |
| Communist Party of Belgium | 138,978 | 2.31 | 2 | –2 |
| Vlaams Blok | 66,424 | 1.10 | 1 | 0 |
| PVDA | 40,446 | 0.67 | 0 | New |
| PSC/CSP | 39,961 | 0.66 | 0 | New |
| PRL/PFF | 35,925 | 0.60 | 0 | New |
| SP/PS | 31,784 | 0.53 | 0 | New |
| WALLON | 31,061 | 0.52 | 0 | New |
| RAD | 28,661 | 0.48 | 0 | New |
| ECOLO-J | 10,946 | 0.18 | 0 | New |
| Party of German-speaking Belgians | 8,397 | 0.14 | 0 | 0 |
| RAL | 7,110 | 0.12 | 0 | New |
| ECOLOS | 5,858 | 0.10 | 0 | New |
| LRT-PLS | 5,241 | 0.09 | 0 | New |
| FNK | 5,102 | 0.08 | 0 | New |
| UDRT | 4,540 | 0.08 | 0 | New |
| BLANCO | 4,118 | 0.07 | 0 | New |
| DD | 3,545 | 0.06 | 0 | New |
| UNF | 2,914 | 0.05 | 0 | New |
| PVDA/PTB | 2,898 | 0.05 | 0 | New |
| ECO-BXL | 2,710 | 0.04 | 0 | New |
| FN | 2,479 | 0.04 | 0 | New |
| PTB | 2,460 | 0.04 | 0 | New |
| BNP | 2,263 | 0.04 | 0 | New |
| PCPA | 1,785 | 0.03 | 0 | New |
| PNB-BNP | 954 | 0.02 | 0 | New |
| PFU | 856 | 0.01 | 0 | 0 |
| AAJ | 838 | 0.01 | 0 | New |
| URD | 598 | 0.01 | 0 | New |
| LISTE-12 | 588 | 0.01 | 0 | New |
| LISTE-14 | 372 | 0.01 | 0 | New |
| CIN | 210 | 0.00 | 0 | New |
| LISTE-13 | 180 | 0.00 | 0 | New |
| PNB | 140 | 0.00 | 0 | New |
| Invalid/blank votes | 477,043 | – | – | – |
| Total | 6,502,070 | 100 | 212 | 0 |
| Source: Belgian Election Results | ||||
Senate
| Party | Votes | % | Seats | +/– |
|---|---|---|---|---|
| Christian People's Party | 1,149,353 | 19.26 | 22 | –7 |
| Party for Freedom and Progress | 781,137 | 13.09 | 14 | +3 |
| Parti Socialiste | 755,512 | 12.66 | 18 | New |
| Socialistische Partij | 732,126 | 12.27 | 13 | New |
| People's Union | 587,002 | 9.84 | 10 | +3 |
| Liberal Reformist Party | 515,868 | 8.64 | 11 | New |
| Social Christian Party | 414,733 | 6.95 | 8 | –4 |
| FDF-RW | 255,727 | 4.28 | 4 | –3 |
| UDRT/RAD | 164,131 | 2.75 | 1 | +1 |
| Ecolo | 153,989 | 2.58 | 3 | +3 |
| Communist Party of Belgium | 140,577 | 2.36 | 1 | 0 |
| Agalev | 121,016 | 2.03 | 1 | New |
| Vlaams Blok | 71,733 | 1.20 | 0 | 0 |
| PVDA/PTB | 49,577 | 0.83 | 0 | New |
| WALLON | 30,632 | 0.51 | 0 | New |
| Party of German-speaking Belgians | 8,770 | 0.15 | 0 | 0 |
| RAL | 8,450 | 0.14 | 0 | New |
| LRT-PLS | 5,894 | 0.10 | 0 | New |
| FNK | 5,317 | 0.09 | 0 | New |
| ECOLOS | 2,796 | 0.05 | 0 | New |
| UNF | 2,721 | 0.05 | 0 | New |
| DD | 2,295 | 0.04 | 0 | New |
| FN | 2,092 | 0.04 | 0 | New |
| GOOSSE | 1,511 | 0.03 | 0 | New |
| BELGE | 1,326 | 0.02 | 0 | New |
| PFU | 1,052 | 0.02 | 0 | 0 |
| PKS | 737 | 0.01 | 0 | New |
| URD | 629 | 0.01 | 0 | New |
| LISTE-12 | 626 | 0.01 | 0 | New |
| PAIX | 611 | 0.01 | 0 | New |
| LISTE-14 | 378 | 0.01 | 0 | New |
| LISTE-13 | 111 | 0.00 | 0 | New |
| Invalid/blank votes | 534,297 | – | – | – |
| Total | 6,502,726 | 100 | 106 | 0 |
| Source: Election Results | ||||
References
- Dieter Nohlen & Philip Stöver (2010) Elections in Europe: A data handbook, p289 ISBN 978-3-8329-5609-7
- Nohlen & Stöver, p291
This article is issued from Wikipedia. The text is licensed under Creative Commons - Attribution - Sharealike. Additional terms may apply for the media files.